. 2025 Apr 16;30(8):1783.
doi: 10.3390/molecules30081783.

Modulation of Tumor Metabolism in Acute Leukemia by Plant-Derived Polymolecular Drugs and Their Effects on Mitochondrial Function

Affiliations

Modulation of Tumor Metabolism in Acute Leukemia by Plant-Derived Polymolecular Drugs and Their Effects on Mitochondrial Function

Cindy Arévalo et al. Molecules. .

Abstract

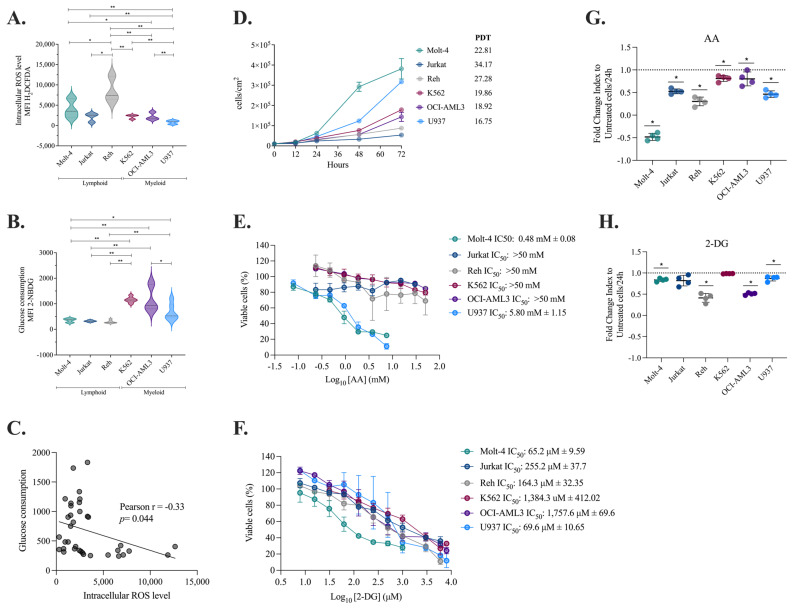
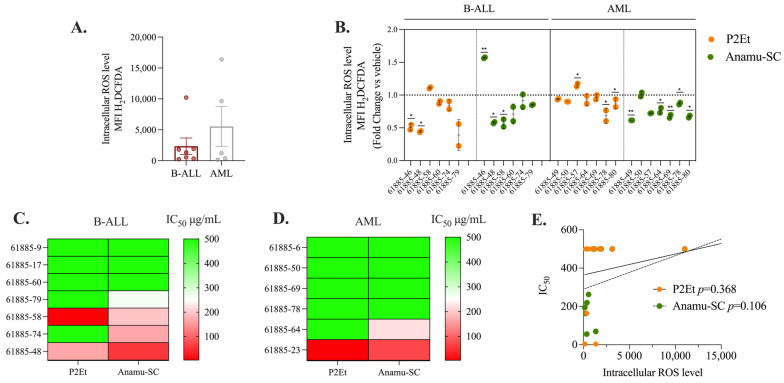
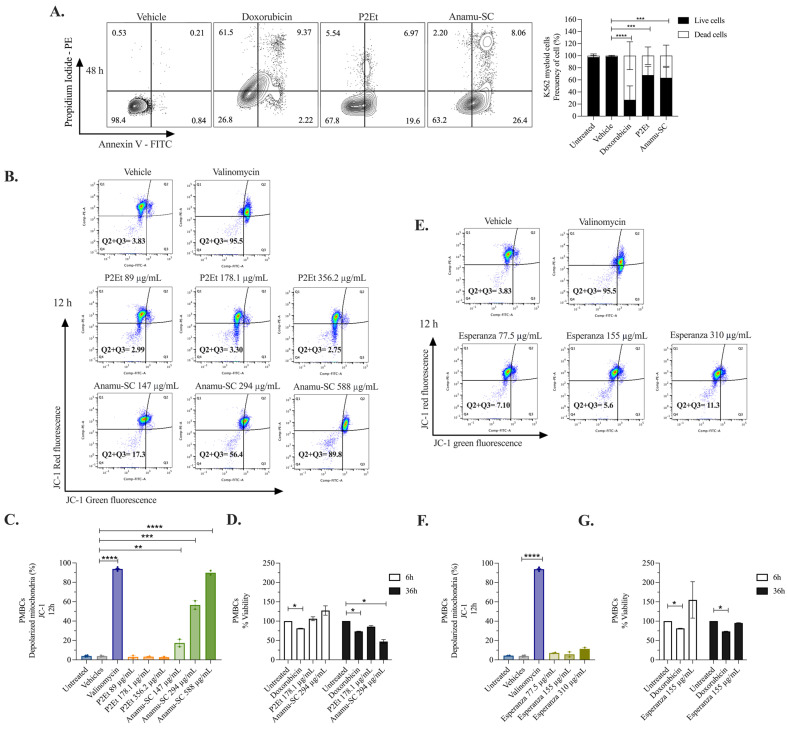
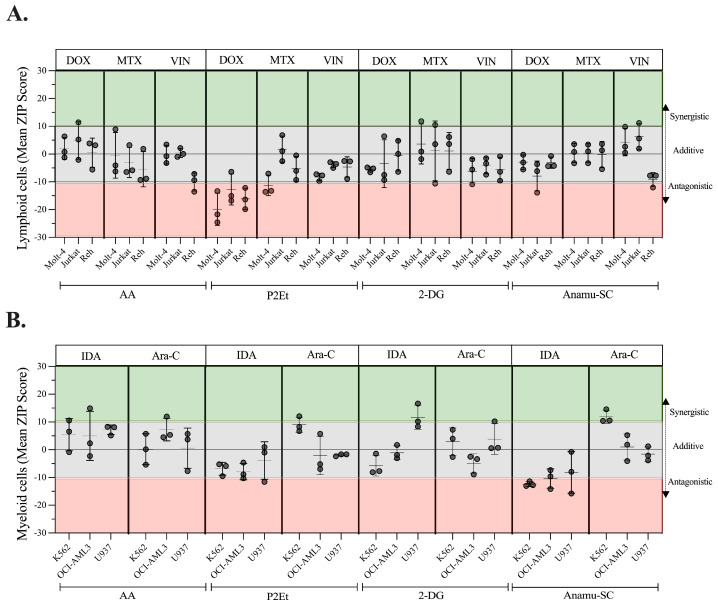
The analysis of tumor metabolism offers promising opportunities for developing new therapeutic strategies. Plant-derived polymolecular drugs can regulate cellular metabolism, making them potential candidates for treatment. This study examined the metabolic effects of plant-derived polymolecular drugs-P2Et, Anamu-SC, and Esperanza-on leukemic cell lines (lymphoid and myeloid types) and primary leukemic blasts. The metabolic analysis included oxidative status, glucose consumption, extracellular acidification, oxygen consumption, mitochondrial dynamics, and untargeted metabolomics. Additionally, the effect of co-treatment with conventional chemotherapeutic drugs was investigated. Results showed that P2Et and Anamu-SC reduced the viability and proliferation of all tumor cell lines, exhibiting antioxidant effects. Anamu-SC decreased reactive oxygen species levels in lymphoid tumor cells. Mitochondrial activity was selectively affected by the plant-derived polymolecular drugs, with Anamu-SC and Esperanza causing more significant, potentially reversible damage compared to P2Et. Anamu-SC and Esperanza increased levels of phosphatidylcholines and carnitines. The co-administration of plant-derived polymolecular drugs with chemotherapeutics improved the cytostatic efficacy of cytarabine. In conclusion, this research highlights the promising pharmacological activity of Anamu-SC and Esperanza as mitocans for the treatment of acute leukemia. The study emphasizes the practical significance of combining plant-derived polymolecular drugs with conventional chemotherapeutics to enhance their cytostatic efficacy.

Keywords: acute leukemia; chemotherapy; metabolism; mitocans; plant-derived polymolecular drugs.


Conflict of interest statement

The authors declare no conflicts of interest.

Figures

Figure 5
Figure 5
Morphometric and mitochondrial depolarization analysis in K562 myeloid cells. (A) Images captured by confocal microscopy of cells labeled with MTCO2 (green) and DAPI (blue). Parameters extracted from images captured by confocal microscopy under basal and post-treatment conditions with the metabolic modulators and/or FCCP 3.5 µmol. (B) AR. (C) FF. (D) Schematic showing mitochondrial fragmentation analysis. Cells were treated (left). The dotted box (right) marks the mitochondria that responded in the injured cell. The degree of fragmentation was calculated by dividing the area of injured cells with fragmented mitochondria (blue) by the area of cells containing responding mitochondria (dotted box) [43]. (E) Percentage of fragmentation under basal conditions (left axis); percentage of cell death (right axis). (F) Analysis of ΔΨm using the JC-1 probe by flow cytometry, upper panel at 6 h and lower panel at 12 h. (G) Percentage of cells with mitochondrial depolarization. Data are represented as the mean ± SD for two independent experiments; * p < 0.05; ** p < 0.01, **** p < 0.0001.
Figure 1
Figure 1
Metabolic differences between lymphoid and myeloid leukemia cells and their response to metabolic modulators. (A) Comparative analysis of intracellular ROS levels in lymphoid and myeloid leukemia cell lines at baseline conditions (Molt-4-MFI: 3522 ± 2.151, Jurkat-MFI: 2540 ± 994.6, Reh-MFI: 7441 ± 2943, K562-MFI: 2459 ± 478.7, OCI-AML3-MFI: 1809 ± 861.7, U937-MFI: 946 ± 432.6). (B) Comparative analysis of glucose consumption in lymphoid and myeloid leukemia cell lines at baseline conditions (Molt-4-MFI: 374 ± 75, Jurkat-MFI: 318 ± 33.1, Reh-MFI: 261 ± 61.8, K562-MFI: 1145 ± 112.7, OCI-AML3-MFI: 925.5 ± 485.2, U937-MFI: 524.5 ± 326). (C) Pearson correlation analysis between glucose consumption and ROS levels. (D) Comparison of PDTs between lymphoid and myeloid cell lines. (E) Cytotoxicity evaluations in leukemic cells treated with AA. (F) Cytotoxicity evaluations in leukemic cells treated with 2-DG. (G) Fold change in the leukemia cells’ proliferation index 24 h after they were treated with AA. (H) Fold change in the leukemia cells’ proliferation index 24 h after they were treated with 2-DG. The data are represented as the mean ± SD for two or three independent experiments. * p < 0.05; ** p < 0.01. AA: ascorbic acid, 2-DG: 2-deoxy-d-glucose.
Figure 2
Figure 2
Evaluation of the anti-leukemic activity of P2Et and Anamu-SC. (A) Cytotoxicity evaluations in leukemic cells treated with P2Et. (B) Cytotoxicity evaluations in leukemic cells treated with Anamu-SC. (C) Fold change in the leukemia cells’ proliferation index 24 h after they were treated with P2Et. (D) Fold change in the leukemia cells’ proliferation index 24 h after they were treated with Anamu-SC. (E) Fold change in H2DCFDA MFI after treatments with IC50 and IC50/5 of P2Et extract, 2 mM Ara-C (positive control), doxorubicin IC50 (positive control), or ascorbic acid (negative control) for 6 h and 12 h in all leukemic cells. (F) Fold change in 2-NBDG MFI after treatments with IC50 and IC50/5 of P2Et extract, Rotenone (positive control), or 3-PO (negative control) for 6 h and 12 h in all leukemic cells. (G) Fold change in H2DCFDA MFI after treatments with IC50 and IC50/5 of Anamu-SC extract, 2 mM Ara-C (positive control), doxorubicin IC50 (positive control), or ascorbic acid (negative control) for 6 h and 12 h in all leukemic cells. (H) Fold change in 2-NBDG MFI after treatments with IC50 and IC50/5 of Anamu-SC extract, Rotenone (positive control), or 3-PO (negative control) for 6 h and 12 h in all leukemic cells. Data are represented as the mean ± SD for two or three independent experiments; * p < 0.05; ** p < 0.01, *** p < 0.001, **** p < 0.0001. AA: ascorbic acid.
Figure 3
Figure 3
P2Et and Anamu-SC extracts’ anti-leukemia effects on patient-derived leukemia blasts. (A) Intracellular ROS levels in leukemic blasts (B-ALL-MFI: 1144 ± 671.9; AML-MFI: 4661.8 ± 6452). (B) Measurement of intracellular ROS in leukemic blasts after 6 h of treatment with P2Et and Anamu-SC. (C) Response of blasts derived from B-ALL patients to the extracts. (D) Response of blasts derived from AML patients to the extracts. Red color indicates higher sensitivity, and green color indicates lower sensitivity. Sensitivity is based on calculated IC50 values. (E) Pearson correlation analysis between the IC50 of P2Et or Anamu-SC extracts and basal intracellular ROS levels. The data are shown as the mean of the two measured replicates ± SD; * p < 0.05; ** p < 0.01.
Figure 4
Figure 4
Changes in energy metabolism in K562 myeloid cells caused by P2Et and Anamu-SC. (A) ECAR and (B) OCR without or with 6 h treatment with P2Et and Anamu-SC. (C) Comparative metabolic map of the bioenergetic phenotype. (D) Glycolytic capacity of cells without or with pretreatment with the extracts and then exposed to 1 µmol oligomycin for 2 h. (E) Respiratory reserve capacity of cells without or with pretreatment with the extracts and then exposed to 3.5 µmol FCCP for 1.5 h. (F) Intracellular ATP levels post-treatment for 6 h with the extracts. The data are represented as the mean ± SD for three independent experiments; * p < 0.05; ** p < 0.01, *** p < 0.001, **** p < 0.0001. OCR: oxygen consumption rate, ECAR: extracellular acidification rate, 2-DG: 2-deoxy-d-glucose, AntiA: Antimycin A.
Figure 6
Figure 6
Evaluation of viability and depolarization of the mitochondrial membrane in PBMCs treated with P2Et and extracts derived from P. alliacea. (A) Cell death induction and frequency of live cells and dead cells in K562 myeloid cells by flow cytometry. (B) Analysis of ΔΨm using the JC-1 probe by flow cytometry in PMBCs treated with P2Et and Anamu-SC for 12 h. (C) Percentage of PMBCs with mitochondrial depolarization after 12 h of treatment with P2Et and Anamu-SC. (D) Percentage of viable PMBCs after 6 h and 36 h of treatment with P2Et and Anamu-SC. (E) Analysis of ΔΨm using the JC-1 probe by flow cytometry in PMBCs treated with Esperanza for 12 h. (F) Percentage of PMBCs with mitochondrial depolarization after 12 h of treatment with Esperanza. (G) Percentage of viable PMBCs after 6 and 36 h of treatment with Esperanza. The data from two independent experiments are presented. The p-values indicate a statistically significant difference between the compared treatments; * p < 0.05, ** p < 0.01, *** p < 0.001, **** p < 0.0001.
Figure 7
Figure 7
Summary of ZIP scores obtained from the combination of metabolic modulators and chemotherapeutics on lymphoid and myeloid leukemia cells. (A) Combinations of AA, P2Et, 2-DG, or Anamu-SC with DOX, MTX, and VIN on lymphoid cells. (B) Combinations of AA, P2Et, 2-DG, or Anamu-SC with IDA and Ara-C on myeloid cells. Green area, synergistic values; gray area, additive values; red area, antagonistic values. Data are represented as the mean ± SD for three independent experiments.
Figure 8
Figure 8
Model of the metabolic regulation of P2Et and P. alliacea on leukemic cells. (A) The K562 myeloid cells have high metabolic activity and are primarily dependent on OxPhos and glycolysis, which support sustained proliferation. (B) P2Et-treated K562 cells exhibit reduced metabolic activity with indirect mitochondrial damage, resulting in their low proliferation and death. (C) Anamu-SC-treated K562 myeloid cells have significant mitochondrial damage that leads them to depend on glycolysis to survive; however, it appears to be ineffective glycolysis, which is why the cells reduce their proliferation and death. (D) Esperanza-treated K562 myeloid cells have significant mitochondrial damage that leads them to depend on glycolysis to survive; however, it appears to be ineffective glycolysis, which is why the cells reduce their proliferation.

Similar articles

References

    1. Swerdlow S.H., Campoo E., Lee N., Jaffe E.S., Pileri S.A., Stein H., Thiele J. WHO Classification of Tumors for Haematopoietic and Lymphoid Tissues. International Agency for Research on Cancer; Lyon, France: 2017.
    1. Kreitz J., Schönfeld C., Seibert M., Stolp V., Alshamleh I., Oellerich T., Steffen B., Schwalbe H., Schnütgen F., Kurrle N., et al. Metabolic Plasticity of Acute Myeloid Leukemia. Cells. 2019;8:805. doi: 10.3390/cells8080805. - DOI - PMC - PubMed
    1. Di Martino L., Tosello V., Peroni E., Piovan E. Insights on Metabolic Reprogramming and Its Therapeutic Potential in Acute Leukemia. Int. J. Mol. Sci. 2021;22:8738. doi: 10.3390/ijms22168738. - DOI - PMC - PubMed
    1. Loew A., Köhnke T., Rehbeil E., Pietzner A., Weylandt K.-H. A Role for Lipid Mediators in Acute Myeloid Leukemia. Int. J. Mol. Sci. 2019;20:2425. doi: 10.3390/ijms20102425. - DOI - PMC - PubMed
    1. Sriskanthadevan S., Jeyaraju D.V., Chung T.E., Prabha S., Xu W., Skrtic M., Jhas B., Hurren R., Gronda M., Wang X., et al. AML cells have low spare reserve capacity in their respiratory chain that renders them susceptible to oxidative metabolic stress. Blood. 2015;125:2120–2130. doi: 10.1182/blood-2014-08-594408. - DOI - PMC - PubMed

MeSH terms

Substances

LinkOut - more resources