. 2025 May 9;11(19):eadt5356.
doi: 10.1126/sciadv.adt5356. Epub 2025 May 7.

DUX4 activates common and context-specific intergenic transcripts and isoforms

Affiliations

DUX4 activates common and context-specific intergenic transcripts and isoforms

Dongxu Zheng et al. Sci Adv. .

Abstract

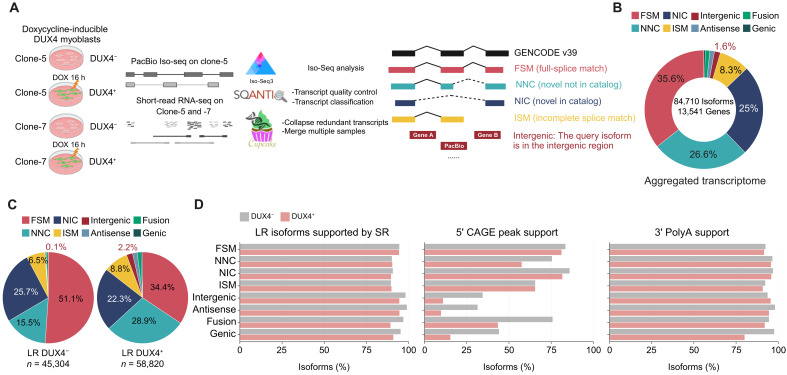
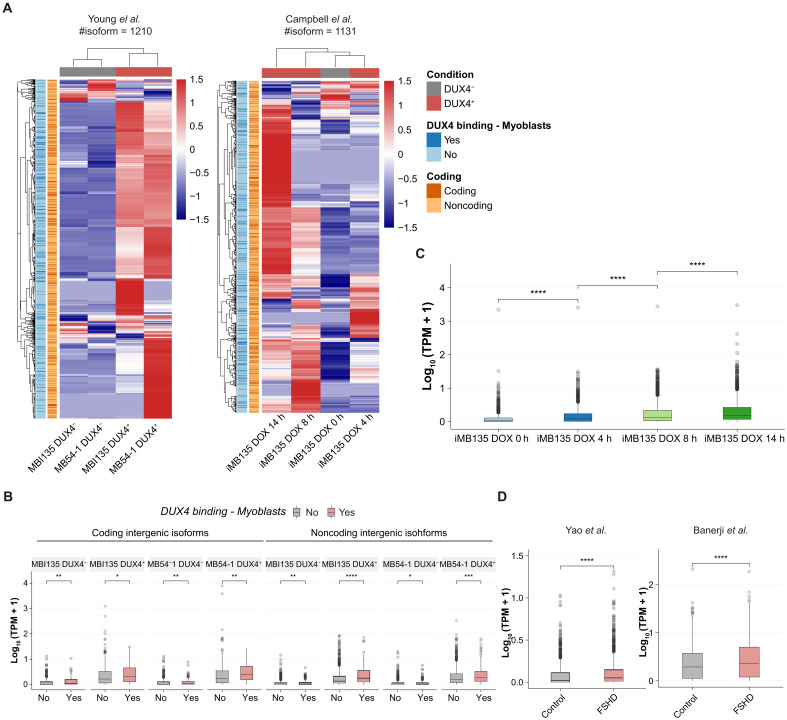
DUX4 regulates the expression of genic and nongenic elements and modulates chromatin accessibility during zygotic genome activation in cleavage stage embryos. Its misexpression in skeletal muscle causes facioscapulohumeral dystrophy (FSHD). By leveraging full-length RNA isoform sequencing with short-read RNA sequencing of DUX4-inducible myoblasts, we elucidate an isoform-resolved transcriptome featuring numerous unannotated isoforms from known loci and novel intergenic loci. While DUX4 activates similar programs in early embryos and FSHD muscle, the isoform usage of known DUX4 targets is notably distinct between the two contexts. DUX4 also activates hundreds of previously unannotated intergenic loci dominated by repetitive elements. The transcriptional and epigenetic profiles of these loci in myogenic and embryonic contexts indicate that the usage of DUX4-binding sites at these intergenic loci is influenced by the cellular environment. These findings demonstrate that DUX4 induces context-specific transcriptomic programs, enriching our understanding of DUX4-induced muscle pathology.


Figures

Fig. 1.
Fig. 1.. The landscape of full-length transcriptome in DUX4i myoblasts.
(A) Schematic of experimental design and full-length isoform profiling by integrating LR and SR RNA-seq data. Full-length isoforms in LR RNA-seq are classified into different structural categories using SQANTI3 compared with the GENCODE (v39) isoform structure. Color codes represent each structural category. Gray dashed lines depict the novel splice junctions and black solid lines depict the known splice junctions. The figure is created with Biorender.com. (h, hours). (B) Donut plot showing the percentage of the aggregated full-length transcriptome classified into each structural category. (C) Pie charts, colored as in (B), showing the percentage of full-length isoforms classified into each structural category in the DUX4 and DUX4+ transcriptome separately. (D) Bar plots depicting the percentage of isoforms detected by SR RNA-seq data (left), isoform TSS supported by CAGE (middle), and isoform TTS supported by the presence of a poly(A) motif (right) in each structural category. Color codes represent the DUX4 conditions.
Fig. 2.
Fig. 2.. Characteristics of novel isoforms from known loci.
(A) Venn diagrams showing the overlap of isoforms classified into FSM, NIC, and NNC between DUX4 and DUX4+ transcriptomes. Color codes are plotted for the subtypes of isoforms: uniquely expressed in DUX4, uniquely expressed in DUX4+, and commonly expressed in both conditions. (B) Stacked bar plots displaying the percentage of isoforms in each subtype per structural category with or without: (left) over 100-bp shift in known TSSs compared with transcript in GENCODE; (right) over 100-bp shift in known TTSs compared with GENCODE transcript. (C) Schematic of classification of alternative splicing events using SUPPA2. The figure is created with Biorender.com. (D) Stacked bar plots depicting the percentage of known and novel ASEs in each category from the DUX4 and DUX4+ transcriptome. The dashed line in dark red represents the 50% to identify the ratio of known and novel events per type of ASE. (E) Stacked bar plots showing the percentage of commonly expressed and uniquely expressed isoforms with known or novel ASEs under each condition. Statistical significance was assessed using proportion test (P value <0.001). (F) Bar plots displaying GO terms [Biological Processes (BPs)] significantly enriched (adjusted P value <0.05) for genes associated with isoforms with novel RI, AL, and MX ASEs. (G) Stacked bar plot displaying the percentages of isoform-derived ORFs that obtained no match against the UniProt database, plotted by subtypes of isoforms in FSM, NIC, and NNC. (H) Stacked bar plot depicting the percentages of novel amino acid sequence identity for isoform-derived ORFs compared to their closest human protein isoform in the UniProt database, plotted by subtype of isoforms in FSM, NIC, and NNC. Novel ORFs show <99% identity with existing entries from UniProt.
Fig. 3.
Fig. 3.. Annotation of FSM, NIC, and NNC isoforms with DUX4 peaks.
(A) Venn diagrams showing the overlap of DUX4-bound isoforms across three cell lines. DUX4 peaks from three cell lines were annotated to isoforms classified into FSM, NIC, and NNC. Numbers indicate the count of isoforms with DUX4-binding sites in each cell line and their intersections. Pairwise hypergeometric tests revealed significant overlaps between any two cell lines (all P values <0.0001). (B) Peak density plots illustrating the genomic distribution of DUX4-binding sites around TSS (±2 kb) for FSM, NIC, and NNC isoforms. Each category contains three panels representing peak distributions from different cell lines. Shaded areas indicate confidence intervals estimated by bootstrap method. (C) Peak density plots showing DUX4-binding patterns across scaled transcript bodies (from TSS to TTS) plus upstream and downstream regions (20% of transcript length) for FSM, NIC, and NNC isoforms. Each panel represents peak distributions from different cell lines as indicated. Confidence intervals (shaded areas) were estimated using bootstrap method.
Fig. 4.
Fig. 4.. Identification of isoform usage shift in DUX4-expressing cells.
(A) Schematic of all types of isoform compositions for each known gene under each condition. Color codes represent the structural categories: FSM, NIC, NNC, and isoforms without expression. The figure is created with Biorender.com. (B) Box plots showing the expression levels of isoforms associated with each isoform composition usage using LR RNA-seq data and SR RNA-seq data. P values are calculated using unpaired Wilcoxon test. Statistical significance is denoted as follows: ****P < 0.0001, *P < 0.05, and P > 0.05 represented as “ns” (not significant). (C) Bar plots depicting the GO terms (BP) significantly (adjusted P value <0.05) enriched for genes with isoform in category 1 (left) and isoform in category 2 (right). (D) Heatmaps showing the expression levels of DUX4 core target genes from LR RNA-seq data obtained from DUX4i myoblasts (top) and four-cell stage cells (bottom). Expression at the gene level is calculated by summing up the normalized expression values of all isoforms for each gene. Color scales depict the expression level of each gene (Z score); red represents a high expression level; blue represents a low expression level. The number labeled in each cell represents the count of isoforms classified into each structural category for each DUX4 target gene. (E) Dot plot depicting the number of spliced isoforms in DUX4+ myoblasts and four-cell stage cells compared to the GENCODE transcriptome for the DUX4 target genes. Color codes represent each transcriptome.
Fig. 5.
Fig. 5.. Identification of cellular context–specific isoforms of DUX4 target genes.
(A) Dot plot showing expression levels of DUX4 target isoforms, identified in DUX4+ DUX4i myoblasts, across RNA-seq datasets from primary myotube cultures and four-cell stage cells. Color codes represent the structural categories and the size of dots represents the expression level of each isoform in each sample. Dark red represents the condition where the isoform shows the highest average expression. (B) Plots showing the isoforms of DUX4 target genes PRAMEF9 and SLC34A2, with an entirely novel exon (PB.76.171 and PB.12232.51) compared to the transcriptome of four-cell stage cells. The shadow highlights the novel exons.
Fig. 6.
Fig. 6.. Identification and classification of intergenic isoforms.
(A) Venn diagram showing the overlap between intergenic isoforms from DUX4 and DUX4+ transcriptomes. (B) Heatmaps depicting the signal intensities of DUX4 ChIP-seq peaks near TSS regions (±2 kb) of intergenic isoforms expressed in DUX4+ myoblasts using three publicly available DUX4 ChIP-seq datasets obtained from DUX4i myoblasts, DUX4i hESCs, and DUX4i iPSCs. Each row represents an individual isoform. The isoforms in each heatmap are independently clustered based on their binding patterns in the respective cell line. (C) Stacked bar plot displaying the percentage of intergenic isoforms with or without at least one DUX4-binding site or ATAC-seq peak. (D) Venn diagram showing the overlapping intergenic isoforms with DUX4 ChIP-seq peak. Color scale represents the count of overlapping intergenic isoforms. Pairwise hypergeometric tests revealed significant overlaps between any two cell lines (all P values <0.0001). (E) UCSC genome browser visualization of an example of the intergenic locus with a DUX4-binding site. Color codes indicate the data in each track: black for transcriptomes of DUX4, DUX4+, and GENCODE reference; bright red for LR RNA-seq data; blue for SR RNA-seq data; dark red for DUX4 ChIP-seq data from DUX4i myoblasts. (F) Box plots displaying the expression levels of intergenic isoforms with or without DUX4 ChIP-seq peak in each sample. P values are calculated using unpaired Wilcoxon test. Statistical significance is denoted as follows: ****P < 0.0001, *P < 0.05, and P > 0.05 represented as ns (not significant).
Fig. 7.
Fig. 7.. Validation of intergenic isoforms in biologically relevant datasets.
(A) Heatmaps showing the expression levels of intergenic isoforms in two published RNA-seq datasets obtained from DUX4i immortalized myoblast cell lines through different DUX4 expression induction methods. Color scale depicts the expression level normalized in Z score. (h, hours). (B) Box plots displaying the expression levels of intergenic isoforms with or without the DUX4 ChIP-seq peak in each sample of RNA-seq data obtained from DUX4i iMB135 myoblasts. P values are calculated using unpaired Wilcoxon test. Statistical significance is denoted as follows: ****P < 0.0001, ***P < 0.001, **P < 0.01, *P < 0.05, and P > 0.05 represented as ns (not significant). (C) Box plot showing the average expression levels of intergenic isoforms in each condition (0-, 4-, 8-, and 14-hour DOX treatment). P values are calculated the same as in (B). (D) Box plots showing the average expression levels of intergenic isoforms in FSHD and control samples [left, Yao et al. (27); right, Banerji et al. (42)]. P value is calculated the same as in (B).
Fig. 8.
Fig. 8.. Intergenic isoforms often originate from REs.
(A) Venn diagram showing the overlapping intergenic isoforms with REs. Color scale represents the count of overlapping intergenic isoforms. (B) UCSC genome browser visualization of an example intergenic locus with RepeatMasker track. Color codes indicate the data in each track: black for transcriptomes of DUX4, DUX4+, and GENCODE reference; bright red for LR RNA-seq data; blue for SR RNA-seq data. (C) Pie charts showing the percentage of subfamilies for each RE. Color codes represent different subfamilies within each family.
Fig. 9.
Fig. 9.. Characteristics of intergenic loci in human preimplantation embryos.
(A) Heatmap showing the expression levels of intergenic isoforms in published RNA-seq data obtained from human preimplantation embryos. Color scale depicts the expression level normalized in Z score. (B) Density plots showing the signal intensity of ATAC-seq peaks near the TSS regions of intergenic isoforms using the published ATAC-seq data obtained from human four-cell stage cells, eight-cell stage cells, and morula. Sequence motif plots depicting the significantly (P value <0.05) enriched motifs for ATAC-seq peaks from each developmental stage. (C) Box plots depicting the methylation level of the 1-kb genomic region surrounding the TSS of intergenic isoforms, using published RRBS data obtained from cleavage stage cells, postimplantation embryos, and primary myoblasts derived from patients with FSHD and healthy donors. P value is calculated using unpaired Wilcoxon test to assess the difference in methylation level between FSHD and control myoblasts. Statistical significance is denoted as follows: **P < 0.01, *P < 0.05, and P > 0.05 represented as ns (not significant). (D) Venn diagram visualizing the overlapping isoforms with H3K4me3 marks in 4C, H3K27ac marks in 8C (eight-cell), and H3K9me4 marks in 4C (four-cell). Color scale shows the number of isoforms. (E) Boxplot showing the expression levels of intergenic isoforms with different histone modification marks. The P values are calculated in the same way as in (C). (F) Line plot showing the dynamics of isoforms with different histone marks during early embryogenesis. The shape of the dot represents the type of histone marks.

References

    1. De laco A., Planet E., Coluccio A., Verp S., Duc J., Trono D., DUX-family transcription factors regulate zygotic genome activation in placental mammals. Nat. Genet. 49, 941–945 (2017). - PMC - PubMed
    1. Hendrickson P. G., Doráis J. A., Grow E. J., Whiddon J. L., Lim J.-W., Wike C. L., Weaver B. D., Pflueger C., Emery B. R., Wilcox A. L., Nix D. A., Peterson C. M., Tapscott S. J., Carrell D. T., Cairns B. R., Conserved roles of mouse DUX and human DUX4 in activating cleavage-stage genes and MERVL/HERVL retrotransposons. Nat. Genet. 49, 925–934 (2017). - PMC - PubMed
    1. Whiddon J. L., Langford A. T., Wong C.-J., Zhong J. W., Tapscott S. J., Conservation and innovation in the DUX4-family gene network. Nat. Genet. 49, 935–940 (2017). - PMC - PubMed
    1. Geng L. N., Yao Z., Snider L., Fong A. P., Cech J. N., Young J. M., van der Maarel S. M., Ruzzo W. L., Gentleman R. C., Tawil R., Tapscott S. J., DUX4 activates germline genes, retroelements, and immune mediators: Implications for facioscapulohumeral dystrophy. Dev. Cell 22, 38–51 (2012). - PMC - PubMed
    1. Lemmers R. J., van der Vliet P. J., Klooster R., Sacconi S., Camano P., Dauwerse J. G., Snider L., Straasheijm K. R., van Ommen G. J., Padberg G. W., Miller D. G., Tapscott S. J., Tawil R., Frants R. R., van der Maarel S. M., A unifying genetic model for facioscapulohumeral muscular dystrophy. Science 329, 1650–1653 (2010). - PMC - PubMed

MeSH terms

LinkOut - more resources