. 2025 May 9;11(19):eadu8811.
doi: 10.1126/sciadv.adu8811. Epub 2025 May 7.

Structural basis for hepatitis E virus neutralization by potent human antibodies

Affiliations

Structural basis for hepatitis E virus neutralization by potent human antibodies

Luis M Molinos-Albert et al. Sci Adv. .

Abstract

Antibodies targeting the hepatitis E virus (HEV) surface capsid protein (CA) are essential for infection control and resolution, yet their molecular and functional attributes remain largely elusive. We characterized 144 human HEV-CA-specific monoclonal antibodies cloned from the memory B cells of HEV-exposed individuals. Most human anti-CA antibodies cross-reacted with all HEV genotype variants, and a subset also recognized the zoonotic rat hepatitis E virus. HEV antibody repertoire was diverse and contained highly potent neutralizing antibodies binding to the CA protruding (P) domain. Structural analyses of CA protein complexed with three potent and broad HEV antibodies uncovered a neutralizing site located on monomeric P domain loops at the apex of the viral spike. These findings provide valuable insights into the protective humoral response to HEV and offer a framework for the rational design of HEV vaccines and immunotherapies.


Figures
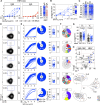
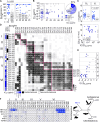
Fig. 1.
Fig. 1.. Human HEV memory B cell antibodies.
(A) ELISA graphs showing the reactivity of purified serum IgGs (blue) and IgAs (red) from HEV-exposed donors against HEV-CA protein (left). The heatmap comparing the area under the curve (AUC) values derived from the ELISA titration curves (right). The black line corresponds to the negative control (Ctr-, seronegative donor). (B) Graph comparing the in vitro neutralization activity of purified IgGs against naked HEV virions (HEV-3c) (left). Calculated IC50 values are presented on the heatmap (right). (C) Heatmap comparing the AUC values for the ELISA binding of purified IgGs to HEV-CA domain proteins. (D) Flow cytometric plots showing the percentage of circulating blood HEV-CA+ IgG memory B cells in HEV-exposed individuals. (E) ELISA graphs showing the reactivity of the HEV memory B cell antibodies against HEV-CA protein (left). The pie charts (middle) show the proportion of antibodies binding to the HEV-CA protein. The number of tested antibodies is indicated in the center of the pie chart. EC50 values calculated from the titration curves are represented in the dot plots (right). (F) Pie charts showing the distribution of clonally expanded (colored) and unique (white) IgG+ B cell clones (306 total sequences) with confirmed HEV-CA specificity, with only one representative IgG antibody tested per clonal family, as presented in (E) (n = 138). The total number of clones, including clonal variants, is indicated in the center of the pie chart. (G) Dot plots comparing the number of VH and VL gene mutations in HEV-CA (n = 138, blue) and control (n = 71, black) IgG antibodies. (H) Volcano plot analysis comparing the Ig gene repertoire of HEV-CA–specific IgG+ B cells and total IgG+ memory B cells from healthy individuals (IgG.mB) (20). FC, fold change. (I) Dendrogram showing the maximum likelihood estimation of the similarity level between VH amino acid sequences of HEV antibodies from all donors.
Fig. 2.
Fig. 2.. Reactivity profiles of human HEV antibodies and their corresponding immunoglobulin gene repertoire.
(A) Heatmap showing the reactivity of anti-HEV-CA IgG and IgA memory B cell antibodies (n = 144) against HEV g3-2712 capsid domains, Paslahepevirus HEV-CA (genotypes 1d to 8) and Rocahepevirus CA (HEV-C1) proteins, with color-coded cells according to the values shown in table S2. Black dots on the right indicate IgA antibodies. (B) Bar graph and pie chart showing the proportion of IgG antibodies (n = 138) recognizing the P domain for each HEV-exposed donor (left) and in total (right), respectively. (C) Pie charts comparing the distribution of VH and JH gene usage of anti-CA P domain (CAP), anti-CA MS domains (CAMS) and control (IgG.mB) IgG memory B cell antibodies. (D) Pie charts comparing the κ- versus λ-Ig chain usage of CAP and CAMS IgG antibodies. Groups in [(C) and (D)] were compared using 2 × 5 and 2 × 2 Fisher’s exact test, respectively. (E) Dot plots comparing plots comparing the number VH, Vκ, and Vλ gene mutations of CAP, CAMS, and control (IgG.mB, white) IgG antibodies. (F) Bar graph showing the proportion of IgGs recognizing strictly conformational HEV-CA epitopes on as shown in fig. S5 (left). Pie chart showing the proportion of IgGs binding to HEV-CA monomers only or to both monomeric and dimeric proteins as determining by immunoblotting (fig. S5) (right). (G) Dot plot (right) shows the binding of IgG and IgA antibodies (n = 144) to CA proteins from different Paslahepevirus genotypes in the dendrogram (left; generated from Paslahepevirus CA protein alignment). Dots correspond to ELISA AUC values shown in fig. S3. Pie chart (right) shows the percentage of antibodies binding to all genotypes (blue-colored slice). (H) ELISA graphs showing the binding of P-reactive (left) and non–P-reactive (right) IgG antibodies against the Rocahepevirus HEV-C1 protein. Pie charts showing the proportion of antibodies recognizing HEV-C1 are shown on the side.
Fig. 3.
Fig. 3.. Neutralizing activity of human HEV antibodies.
(A) Dot plots comparing the percentage of HEV neutralization of human anti-CA antibodies tested in triplicate at 50 μg/ml according to the targeted region (left) and donor (right). Blue-colored dots correspond to P-specific antibodies. (B) Dot plots (left) showing IC50 values of HEV neutralization for anti-P antibodies segregated according to the donors. Pie chart (right) showing the distribution of anti-P antibodies by IC50 values color coded in shades of blue, with darker shades indicating higher potency. (C) Dot plots (top) comparing the number of somatic mutations in VH and VL genes between neutralizing and non-neutralizing anti-P antibodies. Antibodies with IC50 > 50 μg/ml were considered as non-neutralizing. Groups were compared with the two-tailed Mann-Whitney test. Correlation plot (bottom) showing the frequency of somatic mutations in VH and VL genes [f(VH+VL mut.)] versus IC50 values of anti-P antibodies. White dots correspond to non-neutralizing antibodies. The two-sided Spearman rho correlation coefficient and corresponding P value are shown. (D) Competition ELISA heatmap showing the level of binding inhibition to HEV-CA by biotinylated anti-P antibodies (bio-mAbs) in the presence of potential antibody competitor (comp-mAbs). Darker- and white-colored cells indicate high and no or low inhibition, respectively. Antibodies are grouped according to their epitope cluster (I to VI), with colored-coded IC50 and the ability to bind strictly conformational versus nonconformational/conformation-sensitive epitopes (left). (E) Dot plot showing the distribution of IC50 values of anti-P antibodies according with the epitope group. (F) Heatmap (left) comparing the reactivity of anti-HEV-CA antibodies to purified recombinant P proteins from selected Orthohepevirinae genera (Rocahepevirus, Chirohepevirus, and Avihepevirus), depicted in the dendrogram (left; generated from P domain amino acid alignment). The mean AUCs from duplicate titration values are shown. Cells are color coded according to AUC values, with darker colors indicating high binding and lighter colors representing moderate binding (white: no binding).
Fig. 4.
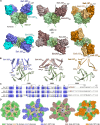
Fig. 4.. Structure of HEV capsid P domain complexes with Es1.327, Es4.431, and Es5.127.
(A) Surface representation of cryo-EM models of the HEV-CA P domain in complex with Es1.327, Es4.431, and Es5.127 Fabs. Protomers of the P dimer are colored in shades of green. VH and VL chains of each Fab are highlighted with distinctive colors. The black lines indicate the approach angle. White arrows on top views of the complexes indicate the rotation angle of Es4.431 and Es5.127 Fabs relative to Es1.327 Fab. (B) Close-up in ribbon representation of the epitope and paratopes in the P domain–Fab interaction. Hydrogen bonds between chains are represented with dashed lines, and the residues participating in the interactions are indicated. (C) Amino acid sequence alignment of Es1.327, Es4.431, and Es5.127 VH and corresponding germline genes. Residues participating in hydrogen bonds indicated in (B) are highlighted with red boxes. (D) Binding of Es1.327, Es4.431, and Es5.127 Fabs to HEV viral-like particle (VLP). Surface representation of the crystal structure of Paslahepevirus HEV VLP (PDB ID: 3HAG) colored by domains according to (A). Fivefold (pentagon), threefold (triangle), and twofold (oval) symmetry axes are indicated. Fabs in surface representation are shown binding to P dimers around one fivefold and one threefold axes.
Fig. 5.
Fig. 5.. Molecular determinants of cross-genotype binding by group VI anti-P HEV antibodies.
(A) SPR sensorgrams (left) comparing the apparent affinity of purified neutralizing anti-P IgG antibodies (n = 5) for the binding to genotype 1d (purple) and 3a (blue) HEV-CA proteins. Corresponding calculated KD values are indicated in the dot plot on the right. RU, response units; FD, fold difference between KD values obtained with genotype 1 and 3 HEV-CA proteins. (B) Modeling of amino acid variations in the RS loop of the P domain across different HEV genotypes. Ribbon representations of AlphaFold-predicted P domain structures (green) aligned to the cryo-EM model of the HEV P domain genotype 3 in complex with Es1.327 (blue) or Es4.431 Fabs (brown). Dashed lines indicate hydrogen bonds identified in the cryo-EM structures. HEV-CA UniProt accession numbers: P29326, Q03500, Q9YLQ9, A0A348BSN0, BCD83331.1, BFL88677.1, UEC95198.1, and MH410174. Amino acid variants are shown as purple stick representations and highlighted with purple boxes in the sequence alignment (bottom left). (C) Heatmap comparing the ELISA binding (as AUC values) of group VI anti-P antibodies to purified recombinant genotype 3 (2712 strain) HEV-CA P domain mutant proteins Q482A/T483A/S488A, S488P, and S488W. The means of assay duplicates are shown. Representative ELISA titration curves of selected antibodies are displayed on the right. Error bars represent the SD of duplicate values. Blue lines indicate the binding to wild-type HEV-CA P domain protein as a comparator.
Fig. 6.
Fig. 6.. Cryo-EM reconstruction of HEV-C1 P domains in complex with Es5.127.
(A) Comparison of Paslahepevirus (cryo-EM) and Rocahepevirus (AlphaFold) HEV P domains. Left and middle panels: Surface representation of P colored by electrostatic potential on a scale from −5 (negative charge) to 5 (positive charge) kT/e. Black line delimits the interaction zone of Es5.127 Fab with Paslahepevirus P domain. Right panel: Close-up views of RS and XY loops in ribbon representation of Paslahepevirus and Rocahepevirus P domain. Side chains of these loops are showed in stick representation. (B) Fitting of the model of Paslahepevirus P/Es5.127 complex into the cryo-EM reconstruction of Rocahepevirus HEV P/Es5.127 complex. (C) SPR sensorgram showing the apparent affinity of the anti-HEV P domain IgG antibody Es5.127 for binding to purified HEV-C1 protein. The corresponding calculated KD value is indicated in the graph (top left).

References

    1. World Health Organization (WHO), Hepatitis E. Fact sheet (WHO, 2023).
    1. Ma Z., de Man R. A., Kamar N., Pan Q., Chronic hepatitis E: Advancing research and patient care. J. Hepatol. 77, 1109–1123 (2022). - PubMed
    1. Kamar N., Izopet J., Pavio N., Aggarwal R., Labrique A., Wedemeyer H., Dalton H. R., Hepatitis E virus infection. Nat. Rev. Dis. Primers 3, 17086 (2017). - PubMed
    1. Wang Y., Zhao C., Qi Y., Geng Y., Hepatitis E virus. Adv. Exp. Med. Biol. 1417, 1–13 (2023). - PubMed
    1. Geng Y., Shi T., Wang Y., Transmission of hepatitis E virus. Adv. Exp. Med. Biol. 1417, 73–92 (2023). - PubMed

MeSH terms

LinkOut - more resources