. 2025 May 9;11(19):eadr5703.
doi: 10.1126/sciadv.adr5703. Epub 2025 May 7.

Niemann Pick C1 mistargeting disrupts lysosomal cholesterol homeostasis contributing to neurodegeneration in a Batten disease model

Affiliations

Niemann Pick C1 mistargeting disrupts lysosomal cholesterol homeostasis contributing to neurodegeneration in a Batten disease model

Abhilash P Appu et al. Sci Adv. .

Abstract

Neurodegeneration is a devastating manifestation in most lysosomal storage disorders (LSDs). Loss-of-function mutations in CLN1, encoding palmitoyl-protein thioesterase-1 (PPT1), cause CLN1 disease, a devastating neurodegenerative LSD that has no curative treatment. Numerous proteins in the brain require dynamic S-palmitoylation (palmitoylation-depalmitoylation) for trafficking to their destination. Although PPT1 depalmitoylates S-palmitoylated proteins and its deficiency causes CLN1 disease, the underlying pathogenic mechanism has remained elusive. We report that Niemann-Pick C1 (NPC1), a polytopic membrane protein mediating lysosomal cholesterol egress, requires dynamic S-palmitoylation for trafficking to the lysosome. In Cln1-/- mice, Ppt1 deficiency misroutes NPC1-dysregulating lysosomal cholesterol homeostasis. Along with this defect, increased oxysterol-binding protein (OSBP) promotes cholesterol-mediated activation of mechanistic target of rapamycin C1 (mTORC1), which inhibits autophagy contributing to neurodegeneration. Pharmacological inhibition of OSBP suppresses mTORC1 activation, rescues autophagy, and ameliorates neuropathology in Cln1-/- mice. Our findings reveal a previously unrecognized role of CLN1/PPT1 in lysosomal cholesterol homeostasis and suggest that suppression of mTORC1 activation may be beneficial for CLN1 disease.


Figures
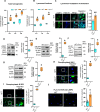
Fig. 1.
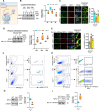
Fig. 1.. Cholesterol-mediated activation of mTORC1 in Cln1 −/− mouse brain.
(A) Cholesterol levels in total cortical homogenates from WT and Cln1−/− mice (n = 4). (B) Cholesterol levels in lysosomal fractions. (C) Confocal images of cortical neurons from WT (n = 24) and Cln1−/− mice (n = 24) showing higher colocalization of cholesterol in lysosomes. Scale bar, 20 μm. Also note that in Cln1−/− mice, a significantly higher level of phosphorylated-S6K1 (pS6K1) (D), p4E-BP1 (E), pULK1 (F), and pTFEB (G) compared with those in their WT littermates (n = 4) suggests hyperactivation of mTORC1 signaling. Immunostaining to confirm the localization of phosphorylated-S6K1 (pS6K1) (H) and p4E-BP1 (I) in the cerebral cortex of WT (n = 12) and Cln1−/− mice (n = 12). Scale bar, 50 μm. (J) PLA to confirm the interaction between mTOR and lysosome marker, LAMP2 (n = 24). Scale bar, 20 μm. Note a significantly higher colocalization of mTOR with LAMP2 in cortical neurons from Cln1−/− mice compared with those from their WT littermates. Two-sided permutation t test with complete enumeration was used to calculate the P values (*P < 0.5; **P < 0.01. Asterisks indicate a significant difference relative to corresponding control group). Data are presented as the means ± SD. “n” denotes the number of independent biological replicates for each experiment. In the box plots, the center line is the median, + symbol represents the sample mean, the limits are 25th and 75th percentile, and the whiskers are the minimum and maximum values, respectively. Source data are provided in the source data file.
Fig. 2.
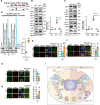
Fig. 2.. Dynamic S-palmitoylation of NPC1 facilitates trafficking to the lysosomal membrane.
(A) Schematic explaining how under physiological conditions cholesterol homeostasis is maintained in WT mice. (B) Levels of NPC1 protein in lysosomes purified from cortical tissues of 2-, 4-, and 6-month-old WT and Cln1−/− mice (n = 24). (C) Colocalization of NPC1 signal with that of lysosomal marker, LAMP2, in isolated neurons from cortical tissues of WT, Cln1−/− mice and Cln1−/− mice treated with r-PPT1 (n = 24). Scale bar, 10 μm. (D) Level of NPC1 in plasma membrane fractions of cortical tissues from 2-, 4-, and 6-month-old WT and Cln1−/− mice (n = 4). (E) Confocal images showing colocalization of NPC1 with the plasma membrane marker, Na+,K+-ATPase, in cortical neurons from WT, Cln1−/− mice and the neurons from Cln1−/− mice treated with r-PPT1 (n = 24). Scale bar, 10 μm. Flow cytometry sorting of lysosomes (F) and plasma membrane (H) from cortical neurons of WT and Cln1−/− mice using anti–LAMP1-FITC and anti–Na+,K+-ATPase–APC antibodies, respectively. The level of NPC1 in purified lysosomal fractions (G) and plasma membrane fractions (I) (n = 4) were then determined by Western blot analysis. Note that in Cln1−/− mice, higher level of NPC1 is localized on the plasma membrane instead of its normal localization on lysosomal membrane. Two-sided permutation t test with complete enumeration was used to calculate the P values (*P < 0.5; Asterisks indicate a significant difference relative to corresponding control group). Data are presented as the mean ± SD. n denotes the number of independent biological replicates in each experiment. In the box plots, the center line is the median, + symbol representing the sample mean, limits are 25th and 75th percentile, and whiskers are the minimum and maximum values, respectively. Source data are provided as a source data file. r-PPT1, recombinant PPT1.
Fig. 3.
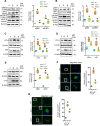
Fig. 3.. Ppt1 deficiency misroutes S-palmitoylated-NPC1 to the plasma membrane.
(A) Acyl-RAC assay using lysates from HEK293T cells transfected with WT-NPC1 and mutant (Cys97Ala)–NPC1 constructs. Note that Cys97Ala mutation abrogates S-palmitoylation of NPC1 (n = 4), confirming that Cys97 is the S-palmitoylation site in this protein. (B) Various APs were pulled down by NPC1 antibody (n = 4) and immunoblotted using AP antibodies. (C) NPC1 pull-down assays (n = 4) were performed using various AP antibodies and immunoblotted using NPC1antibody. (D) Level of S-palmitoylated NPC1 in plasma membrane fractions of cortical tissues from WT and Cln1−/− mice (n = 4) by Acyl-RAC assay. Colocalization of NPC1 with Rab5 (E), EEA1 (F), Rab9 (G), and Rab11 (H) in cortical neurons from WT and Cln1−/− mice (n = 24). Scale bar, 10 μm. (I) Endosomal trafficking of NPC1. Note that in WT cells (left), trafficking of NPC1 protein is facilitated by dynamic S-palmitoylation on Cys97, requiring thioesterase activity of Ppt1. Depalmitoylation of NPC1 allows handover of NPC1 bound to AP-2 to AP-3. The AP-3 bound NPC1 is then transported to the limiting membrane of late endosome/lysosome. In Cln1−/− cells (right), the lack of Ppt1 activity impairs dynamic S-palmitoylation of NPC1. Consequently, S-palmitoylated NPC1 is transported via recycling endosome to the plasma membrane instead of its normal location on lysosome. The two-sided permutation t test with complete enumeration was used to calculate the P values (*P < 0.5; **P < 0.01. Asterisks indicate a significant difference relative to corresponding control group. NS, non-significant). Data are presented as mean values ± SD. n denoting the number of independent biological replicates. In the box plots, the center line is the median, + symbol representing the sample mean, limits are 25th and 75th percentile, and whiskers are the minimum and maximum values, respectively. Source data are provided as a source data file. PM, plasma membrane, PBS-C, PBS control, HA, hydroxylamine unbound; HA+, hydroxylamine bound.
Fig. 4.
Fig. 4.. Dysregulation of cholesterol homeostasis in Cln1−/− mice.
(A) Schematic representation of cholesterol transport from the ER to the lysosome; (B) the levels of OSBP, VAPA, and VAPB in lysosomal fractions from cortical tissues of WT and Cln1−/− mice (n = 4). (C) Colocalization of OSBP with lysosomal marker, LAMP2, in cortical neurons from WT, Cln1−/− mice, and Cln1−/− mice treated with r-PPT1 (n = 24). Scale bar, 10 μm. (D) Colocalization of VAPA with lysosomal marker, LAMP2, in cortical neurons from WT, Cln1−/− mice, and Cln1−/− mice treated with r-PPT1 (n = 24). Scale bar, 10 μm. (E) Colocalization of VAPB with lysosomal marker, LAMP2, in cortical neurons from WT, Cln1−/− mice, and Cln1−/− mice treated with r-PPT1 (n = 24). Scale bar, 10 μm. (F) TEM analysis of cortical tissues to determine the ER-lysosome contacts in cortical cells from WT and Cln1−/− mice (n = 3). Scale bar, 0.5 μm. (G) TEM analysis of cortical tissues to determine ER-lysosome contacts in WT and Cln1−/− mice. Note that intracellular accumulation of GRODs, characteristically found in Cln1−/− mice, interferes with clear visualization of ER-lysosome contacts. Despite this disadvantage, the ER-lysosome contacts in Cln1−/− mice appear to be tighter than those in their WT littermates (n = 3). Scale bar, 5 μm. Two-sided permutation t test with complete enumeration was used to calculate the P values (*P < 0.5; **P < 0.01. Asterisks indicate a significant difference relative to corresponding control group). Data are presented as mean values ± SD. n denoting the number of independent biological replicates. In the box plots, the center line is the median, + symbol representing the sample mean, limits are 25th and 75th percentile, whiskers are the minimum and maximum values, respectively. Source data are provided in the source data file. L, Lysosomes; G, GRODS.
Fig. 5.
Fig. 5.. Pharmacological inhibition of OSBP suppresses mTORC1 activation rescuing autophagy.
Western blot analyses: (A) pS6K1 and p4E-BP1 in normal (1), untreated human CLN1-disease lymphoblasts (2), and those treated with OSBP-inhibitor, OSW1 (5 nM) (n = 4) (3). (B) Quantitation of pS6K1 and p4E-BP1 levels in WT (1), untreated Cln1 −/− mice (2) and those treated with OSW1 (10 μg/kg body weight), (n = 5) (3). (C) Levels of LC3-II and p62 in normal (1), untreated human CLN1 disease-lymphoblasts (2), and those treated with OSBP-inhibitor, OSW1 (5 nM)] (n = 4) (3). (D) Quantitation of LC3-II and p62 in the cortical tissue of WT (1), Cln1−/− mice (n = 4) untreated (2) or treated with OSBP inhibitor, OSW1 (10 μg/kg body weight), (n = 4) (3). (E) Level of CD68 and GFAP in cortical tissues from WT (1), untreated-Cln1−/− mice (2), and from those treated with OSW1 (10 μg/kg body weight) (n = 4) (3). Immunostaining of mTORC1-activation markers, (F) pS6K1 and (G) p4E-BP1 in cortical tissues from OSW1-treated Cln1−/− mice compared with those from untreated mice (n = 12). Scale bar, 50 μm. Two-sided permutation t test with complete enumeration was used to calculate the P values (*P < 0.5. Asterisks indicate a significant difference between treated and untreated control group). Data are presented as mean values ± SD. n denotes the number of independent biological replicates for each experiment. In the box plots, the center line is the median, + symbol representing the sample mean, limits are 25th and 75th percentile, whiskers are the minimum and maximum values, respectively. Source data are provided in source data file.

References

    1. de Duve C., Wattiaux R., Functions of lysosomes. Annu. Rev. Physiol. 28, 435–492 (1966). - PubMed
    1. Saftig P., Klumperman J., Lysosome biogenesis and lysosomal membrane proteins: Trafficking meets function. Nat. Rev. Mol. Cell Biol. 10, 623–635 (2009). - PubMed
    1. Yang C., Wang X., Lysosome biogenesis: Regulation and functions. J. Cell Biol. 220, e202102001 (2021). - PMC - PubMed
    1. Marques A. R. A., Saftig P., Lysosomal storage disorders - challenges, concepts and avenues for therapy: Beyond rare diseases. J. Cell Sci. 132, jcs221739 (2019). - PubMed
    1. Udayar V., Chen Y., Sidransky E., Jagasia R., Lysosomal dysfunction in neurodegeneration: Emerging concepts and methods. Trends Neurosci. 45, 184–199 (2022). - PMC - PubMed

MeSH terms