. 2025 May 7;21(5):e1013092.
doi: 10.1371/journal.pcbi.1013092. eCollection 2025 May.

Noise correlations and neuronal diversity may limit the utility of winner-take-all readout in a pop out visual search task

Affiliations

Noise correlations and neuronal diversity may limit the utility of winner-take-all readout in a pop out visual search task

Ori Hendler et al. PLoS Comput Biol. .

Abstract

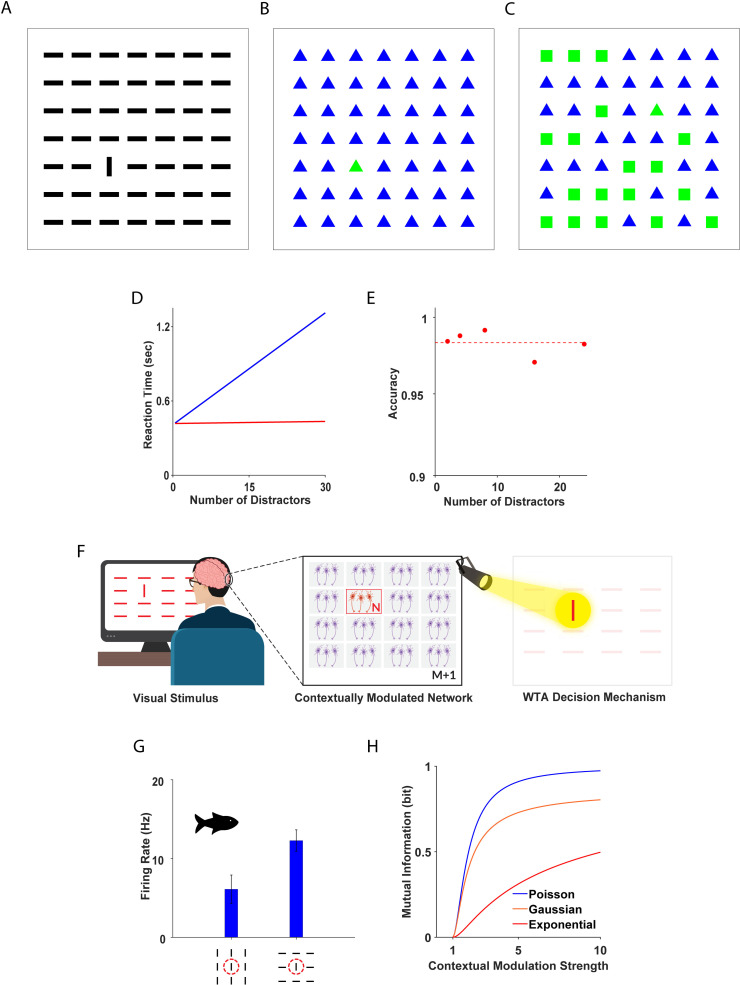
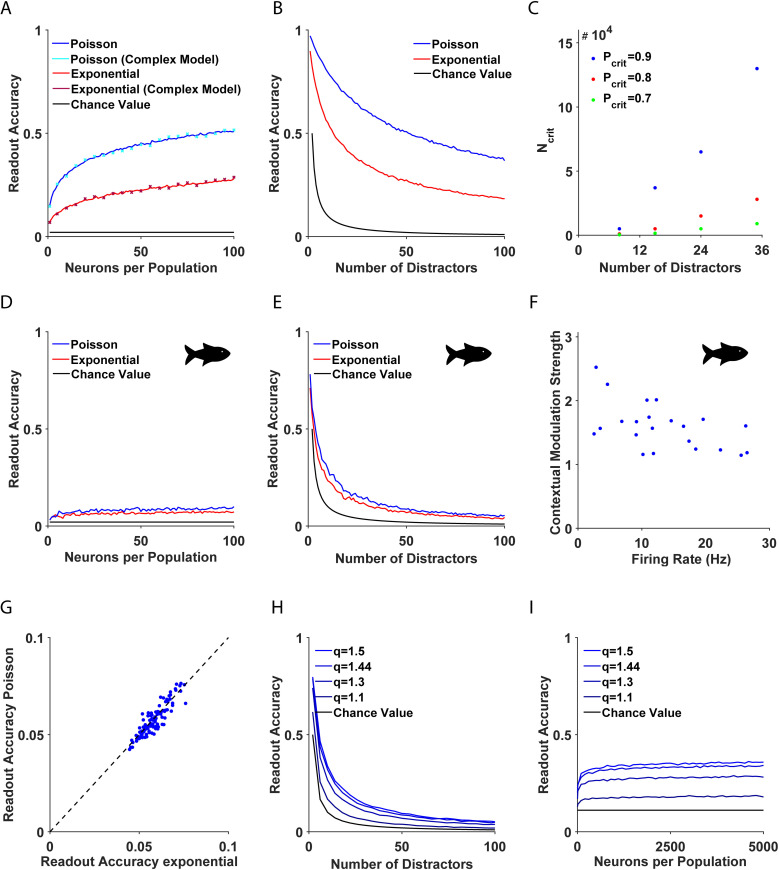
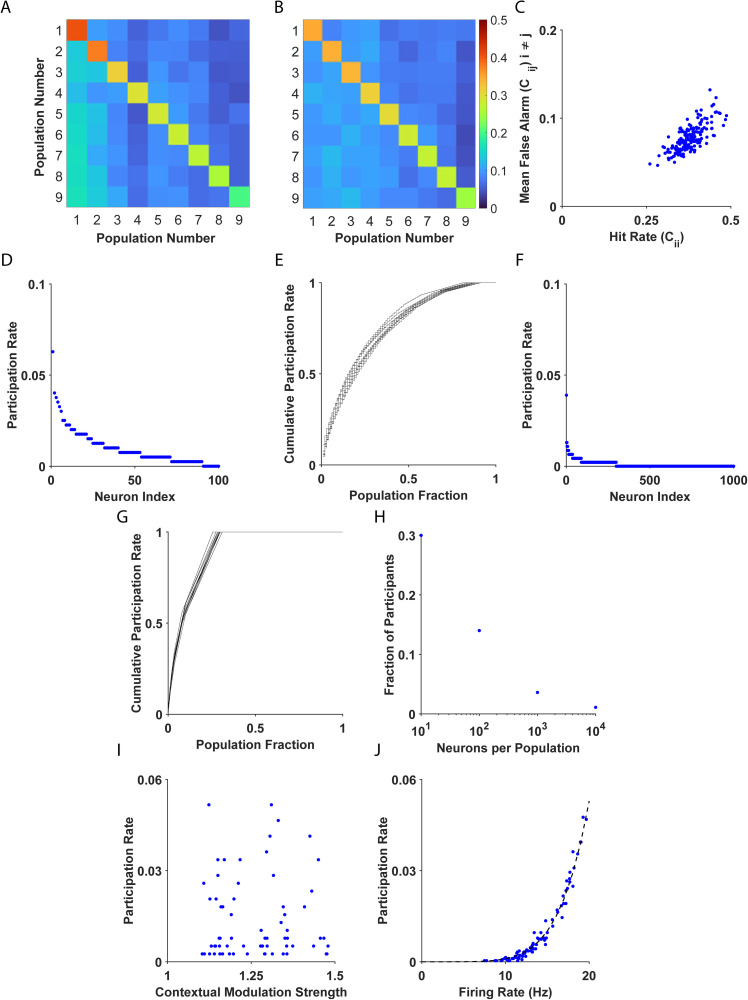
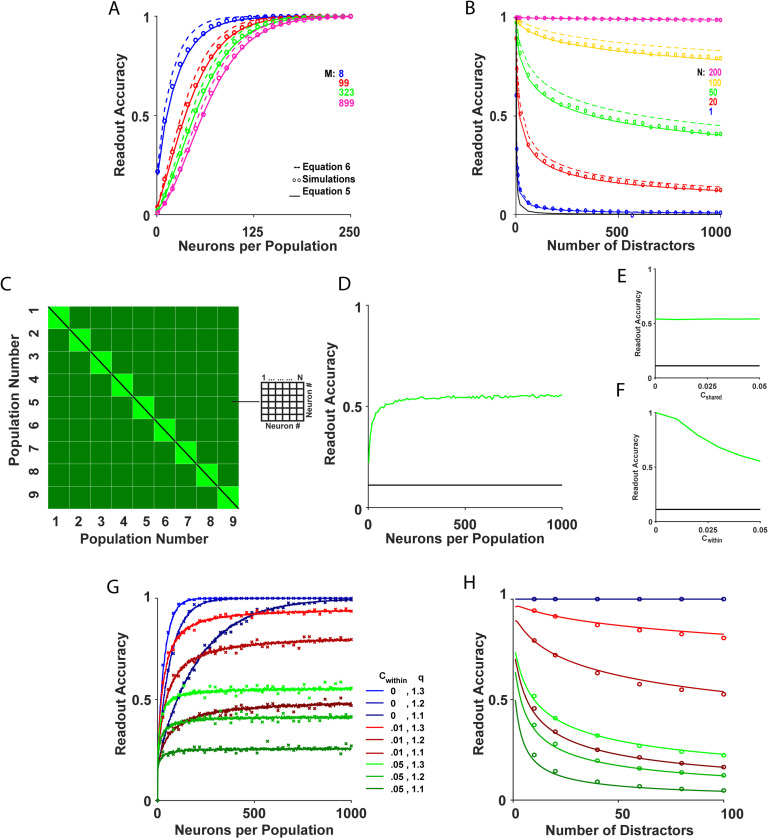
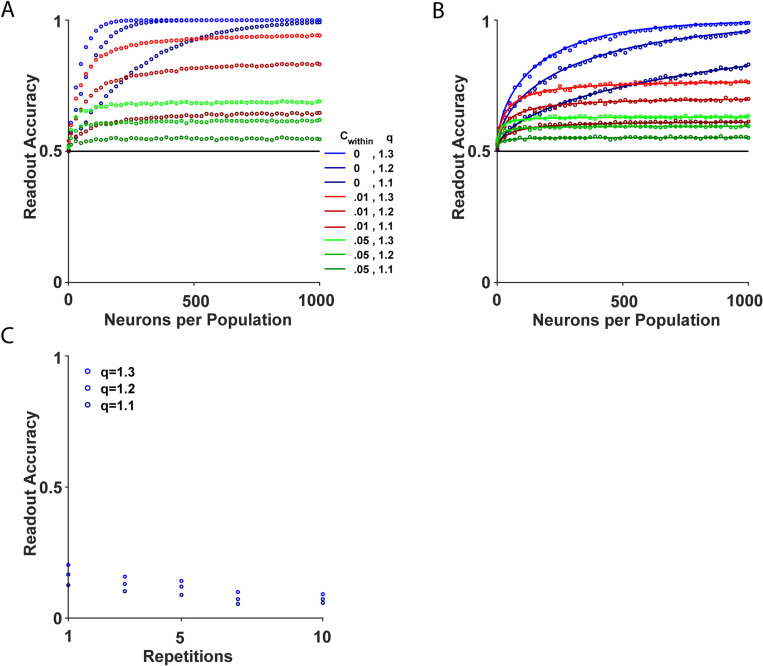
Visual search involves active scanning of the environment to locate objects of interest against a background of irrelevant distractors. One widely accepted theory posits that pop out visual search is computed by a winner-take-all (WTA) competition between contextually modulated cells that form a saliency map. However, previous studies have shown that the ability of WTA mechanisms to accumulate information from large populations of neurons is limited, thus raising the question of whether WTA can underlie pop out visual search. To address this question, we conducted a modeling study to investigate how accurately the WTA mechanism can detect the deviant stimulus in a pop out task. We analyzed two types of WTA readout mechanisms: single-best-cell WTA, where the decision is made based on a single winning cell, and a generalized population-based WTA, where the decision is based on the winning population of similarly tuned cells. Our results show that neither WTA mechanism can account for the high accuracy found in behavioral experiments. The inherent neuronal heterogeneity prevents the single-best-cell WTA from accumulating information even from large populations, whereas the accuracy of the generalized population-based WTA algorithm is negatively affected by the widely reported noise correlations. These findings underscore the need to revisit the key assumptions explored in our theoretical analysis, particularly concerning the decoding mechanism and the statistical properties of neuronal population responses to pop out stimuli. The analysis identifies specific response statistics that require further empirical characterization to accurately predict WTA performance in biologically plausible models of visual pop out detection.


Conflict of interest statement

The authors have declared that no competing interests exist.

Figures

Fig 1
Fig 1. Pop out: Behavior and Physiological Correlates.
(A-B) Illustration of two pop out stimuli: (A) A deviant vertical bar among numerous horizontal bars. (B) A deviant green triangle among many blue triangles. (C) A deviant green triangle among numerous green squares and blue triangles. (D) Illustration of reaction times in serial (blue) and parallel (red) visual search tasks. (E) Accuracy of human subjects on a pop out task is plotted as a function of the number of distractors, adapted with permission from [24]. (F) Schematic illustration of the model system. From left to right: Pop out stimulus presented to the subject, system of M+1 populations of N contextually modulated neurons each, WTA decision mechanism. (G) Example: mean firing rate of a single contextually modulated neuron in response to uniform and pop out stimuli from the optic tectum of a fish. Data courtesy of the Segev lab. The methodology and experimental procedure used to harvest these data are detailed in [21]. The dashed red line schematically depicts the classical receptive field of the neuron. (H) Mutual information of a neuron (see Methods) is presented as a function of its contextual modulation strength, q, for Poisson (blue), Gaussian (orange) and exponential (red) noise.
Fig 2
Fig 2. Accuracy of the single-best-cell WTA.
(A-B, D-E) The accuracy of the single-best-cell WTA in homogeneous (A-B) and heterogeneous (D-E) systems is shown as a function of (A, D) the number of neurons, N, and (B, E) the number of distractors, M. The blue and red traces depict Poisson and exponential neuronal response distributions, respectively. Chance value is depicted in black. For a comprehensive list of all parameter values see Table 1 – Parameters for the numerical simulations. The scatter plot (cyan and magenta (x) markers) illustrates the readout accuracy of the WTA mechanism applied to natural images using the model proposed by Itti et al. [6], along with our framework (see Methods). (C) The number of neurons, Ncritical, required to reach a given accuracy threshold level, Pcritical, is shown as a function of the number of distractors, M. The different accuracy threshold levels are depicted by color. (F) Scatter plot depicting the response to a pop out stimulus and the contextual modulation strength of 22 contextually modulated neurons in the optic tectum of the archerfish, where the correlation between the two parameters was ρ=0.53,p<0.05. Data courtesy of the Segev lab. The methodology and experimental procedure used to harvest these data are detailed in [21]. (G) WTA accuracy for a Poisson population is shown as a function of its accuracy for an exponential population; for the same realization of neuronal heterogeneity, the correlation was ρ=0.89,p<0.05. The identity mapping is presented (dashed blue line) for comparison. (H-I) WTA accuracy in artificial heterogeneous systems is shown as a function of (H) the number of distractors, M, and (I) the number of neurons, N, for different contextual modulation strengths, depicted by color. Chance value is depicted in black. The mean firing rates, rt, and mean contextual modulation strength, q, used in A-E, and G are the same and were taken from the data, F.
Fig 3
Fig 3. Investigation of WTA errors.
(A-B) Two examples of confusion matrices presenting the performance of the WTA algorithm in two example heterogeneous systems. (C) The mean false alarm is shown as a function of the hit rate for different realizations of system heterogeneity; correlation ρ=0.76,p<0.05. (D) Participation rate of different neurons is shown for one example of a single individual with N=100 neurons per population. (E) The cumulative sum of the participation rate of the n neurons in (D) with the highest participation rate, as a function of the fraction of neurons from the entire population, n/N. (F) As in D with N=1000neurons per population (G) As in E, for the neurons in F. (H) The fraction of neurons required to reach a cumulative participation rate of 50\% is shown as a function of the number of neurons per population, N. (I) Participation rate of different neurons is shown as a function of their contextual modulation strength, ρ=0.05,p=0.67. (J) Participation rate of different neurons is shown as a function of their firing rate. The dashed black line depicts the exponential fit of the form f(x)=axb, with, a=1.77·109,b=5.74 and R2=0.98.
Fig 4
Fig 4. Accuracy of the Generalized WTA.
(A) The accuracy of the generalized WTA is presented as a function of N. The different colors depict different numbers of distractors, M. (B) The accuracy is presented versus M. The different colors depict different values of N. The open circles, solid lines and dashed lines depict the accuracy as estimated by simulations, equation (5), and equation (6), respectively. Chance value is depicted in black. (C) A visual representation of the pairwise correlation matrix as defined in equation (9). This matrix captures the correlations among neurons within the system and has dimensions of (N(M+1))2. The diagonal elements (black) represent the variance of individual neurons. The central squares along the diagonal (light green) indicate the correlation coefficient c1, whereas the remaining off-diagonal elements (dark green) indicate the correlation coefficient c2. (D-F) Readout accuracy is presented in the cases of (D) both cshared0 and cwithin0 correlations, (E) cwithin=0.05,cshared0, (F) cwithin0,cshared=0. (G) Accuracy as a function of the number of neurons per population, N. The lines depict the numerical estimation of the accuracy in the Gaussian model. The x’s depict the accuracy in the complex model. (H) Accuracy as a function of the number of distractors, M, for large N=104. The solid lines show the analytical result of equation (5). The open circles depict the numerical estimation of the accuracy. The colors in G-H represent different correlation levels, cwithin, and contextual modulation strengths, q.
Fig 5
Fig 5. Accuracy of WTA and generalized WTA in the present/absent task and repetition impact on WTA.
(A-B) Readout accuracy in the target present/target absent pop out task for (A) WTA, and (B) generalized WTA, is shown as a function of the number of neurons per population, N. Open circles and solid lines denote accuracy estimated via simulations and Equation (21), respectively. Different levels of within-population correlation, cwithin, are indicated by different colors (blue, red, green), and contextual modulation strengths, q, are represented by shades of these colors. Chance value is depicted by a solid black line. (C) Readout accuracy of the WTA is plotted as a function of the number of repetitions, K(see Methods), with different contextual modulation strengths, q, depicted by different shades of blue.

Similar articles

References

    1. Dehaene S. Discriminability and dimensionality effects in visual search for featural conjunctions: a functional pop-out. Percept Psychophys. 1989;46(1):72–80. doi: 10.3758/bf03208076 - DOI - PubMed
    1. Wolfe JM, Horowitz TS. What attributes guide the deployment of visual attention and how do they do it?. Nat Rev Neurosci. 2004;5(6):495–501. doi: 10.1038/nrn1411 - DOI - PubMed
    1. Huang L, Pashler H. Attention capacity and task difficulty in visual search. Cognition. 2005;94(3):B101-11. - PubMed
    1. Liesefeld HR, Moran R, Usher M, Müller HJ, Zehetleitner M. Search efficiency as a function of target saliency: The transition from inefficient to efficient search and beyond. J Exp Psychol Hum Percept Perform. 2016;42(6):821–36. doi: 10.1037/xhp0000156 - DOI - PubMed
    1. Treisman AM, Gelade G. A feature-integration theory of attention. Cogn Psychol. 1980;12(1):97–136. doi: 10.1016/0010-0285(80)90005-5 - DOI - PubMed

LinkOut - more resources