. 2025 Jun:83:103647.
doi: 10.1016/j.redox.2025.103647. Epub 2025 Apr 30.

FTO facilitates colorectal cancer chemoresistance via regulation of NUPR1-dependent iron homeostasis

Affiliations

FTO facilitates colorectal cancer chemoresistance via regulation of NUPR1-dependent iron homeostasis

Changwei Xu et al. Redox Biol. 2025 Jun.

Abstract

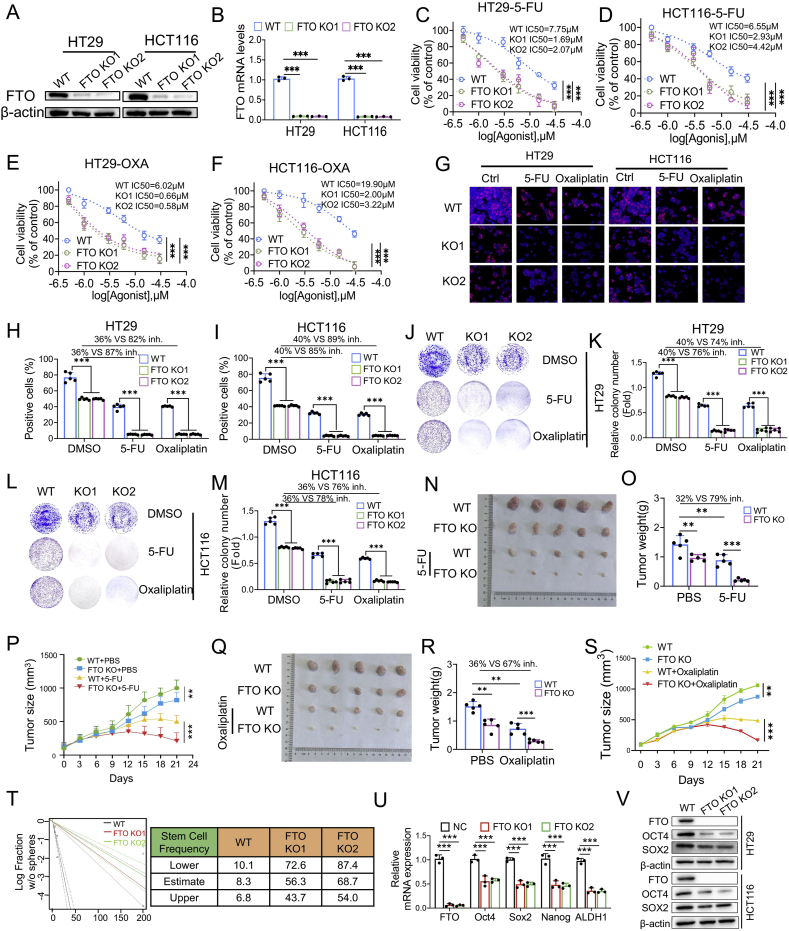
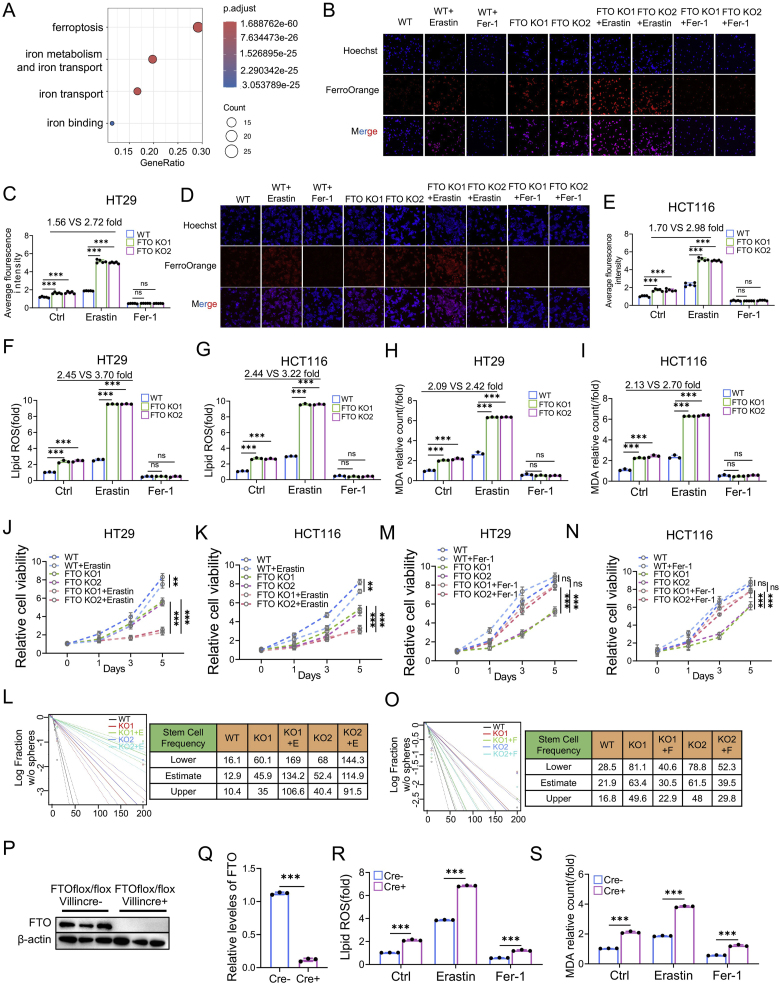
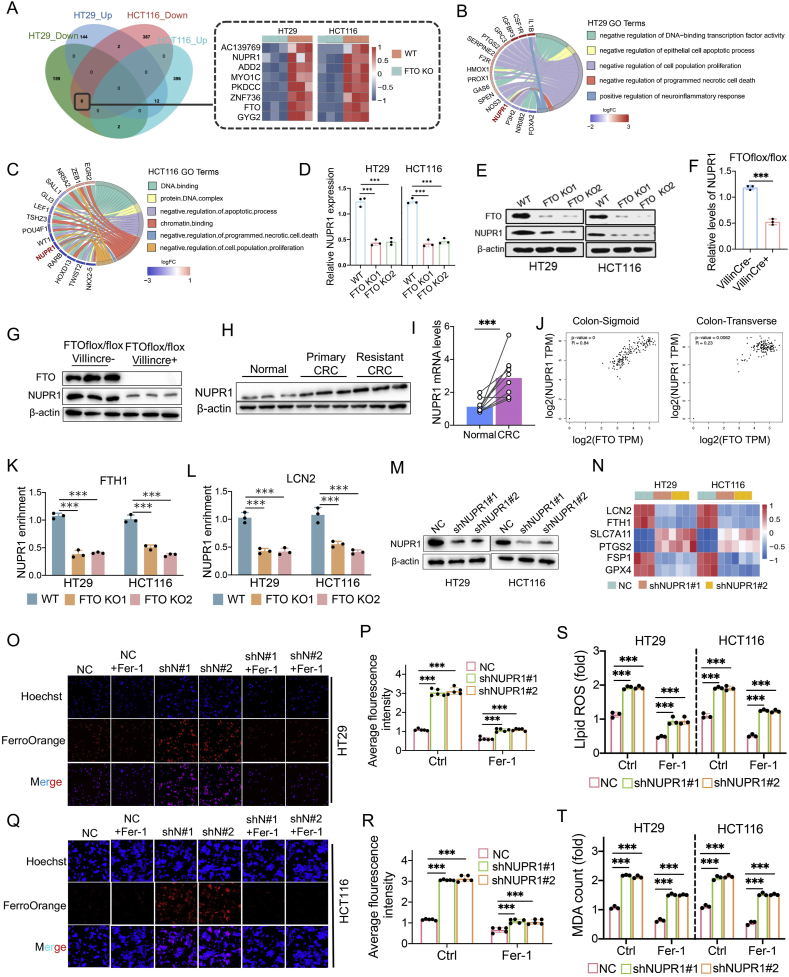
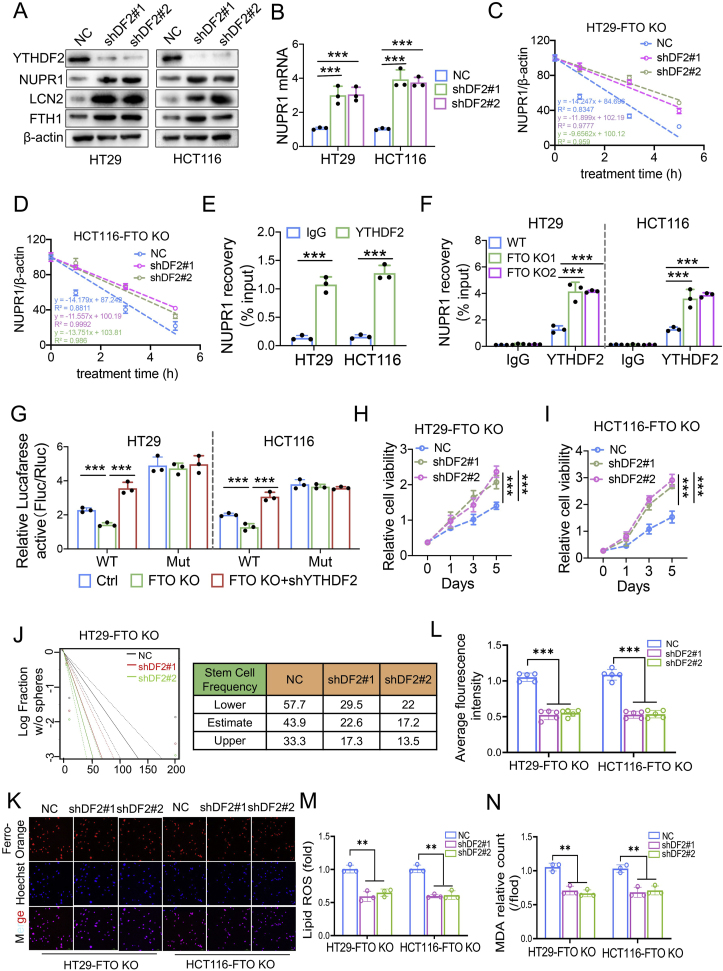
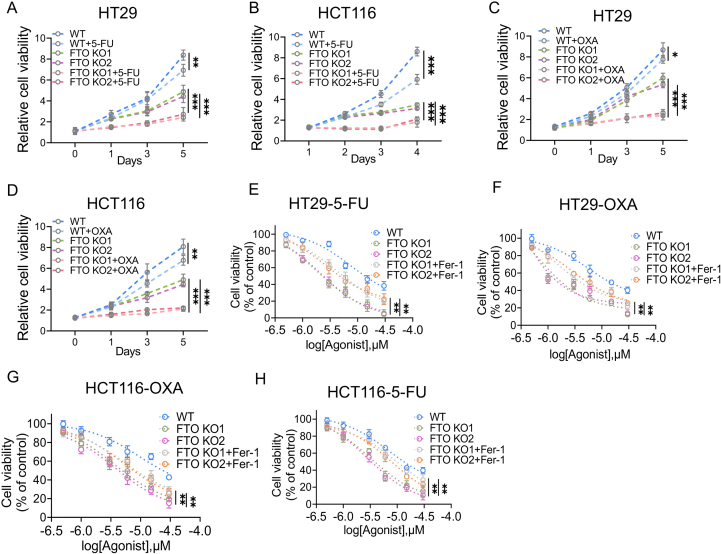
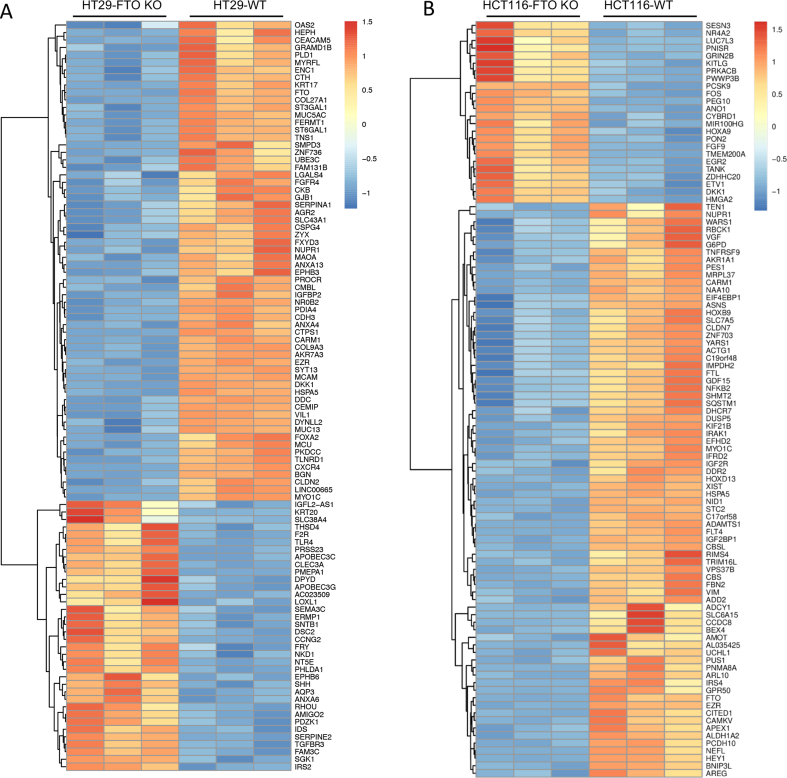
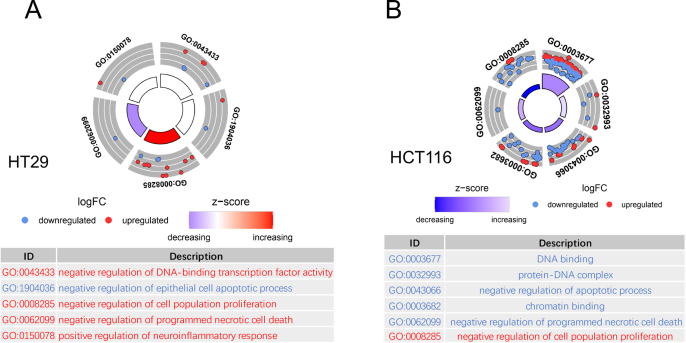
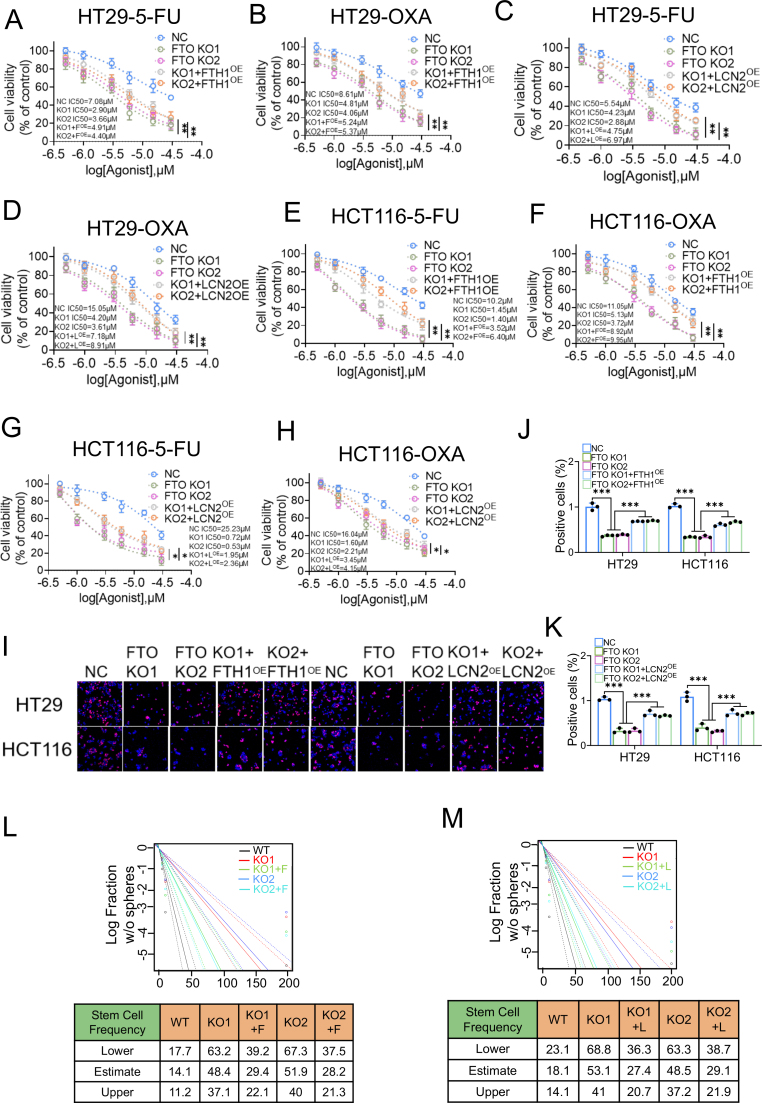
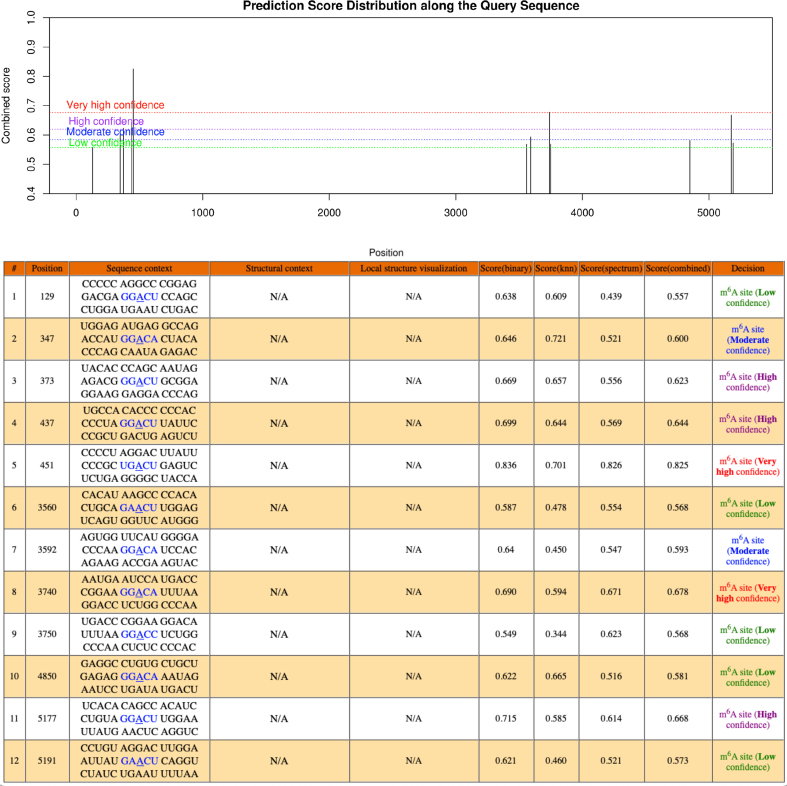
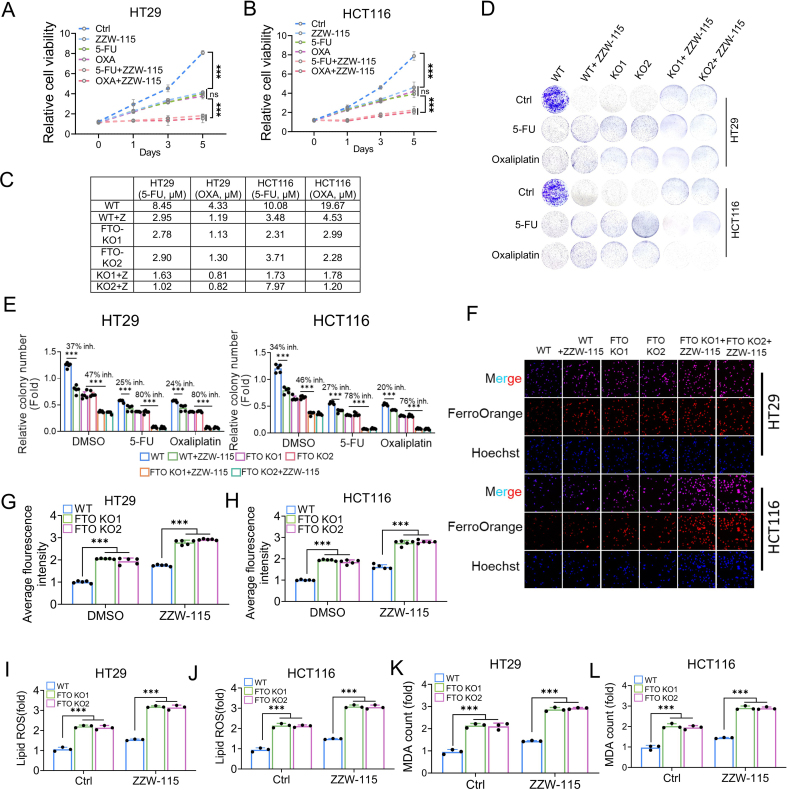
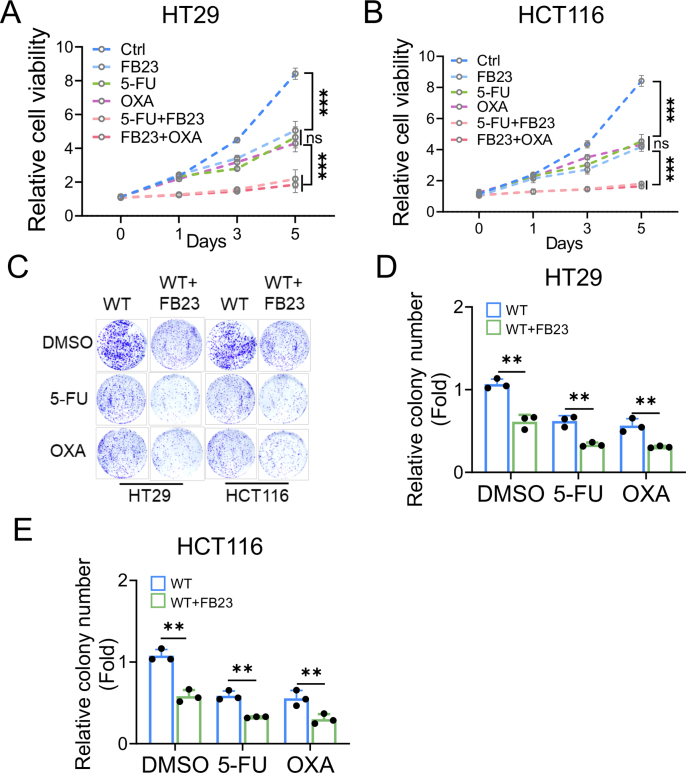
Drug resistance in colorectal cancer (CRC) poses a major challenge for cancer therapy and stands as the primary cause of cancer-related mortality. The N6-methyladenosine (m6A) modification has emerged as a pivotal regulator in cancer biology, yet the precise m6A regulators that propel CRC progression and chemoresistance remain elusive. Our study established a significant correlation between m6A regulatory gene expression profiles and CRC severity. Notably, based on the knockout cellular and mouse model created by CRISPR/Cas9-mediated genome engineering, we identified m6A demethylase FTO emerged as a pivotal orchestrator of CRC chemoresistance through the regulation of NUPR1, a critical transcription factor involved in iron homeostasis via LCN2 and FTH1. Mechanistic study revealed that FTO stabilized NUPR1 mRNA by specifically targeting the +451 m6A site, thereby preventing YTHDF2-mediated degradation of NUPR1 mRNA. Moreover, the simultaneous targeting of FTO and NUPR1 dramatically enhanced the efficacy of chemotherapy in CRC cells. Our findings underscore the potential of modulating the m6A methylome to overcome chemoresistance and highlight the FTO-NUPR1 axis as a critical determinant in CRC pathobiology.

Keywords: Chemoresistance; Colorectal cancer (CRC); Drug resistance; FTO (m6A demethylase); N6-methyladenosine (m6A) modification; NUPR1.


Conflict of interest statement

Declaration of competing interest The authors declare that they have no known competing financial interests or personal relationships that could have appeared to influence the work reported in this paper.

Figures

Image 1
Graphical abstract
Fig. 1
Fig. 1
FTO serves as a robust prognostic indicator for CRC aggressivity and chemoresistance. (A–B) A boxplot (A) and a heatmap (B) depict the expression levels of 18 m6A-modifying genes across 638 CRC patients and 51 normal tissue samples from TCGA dataset. (C–F) Clustering analysis predicated on m6A-modifying genes reveals: (C) The TCGA CRC cohort stratifies into two distinct clusters with k = 2. (D) Principal component analysis (PCA) differentiates the two clusters. (E) Kaplan-Meier survival curves compare overall survival between cluster 1 and cluster 2. (F) A heatmap of the 18 m6A-modifying genes, illustrating the correlation between distinct expression patterns and clinical parameters. (G) The indicated m6A levels in patient-derived colorectal cancer tissues and adjacent normal tissues. (H) Immunohistochemical staining of FTO in adjacent normal and CRC tissues from patients. (I) Quantitative analysis of FTO expression across different stages of human tissues. (J) Western blotting analysis of global FTO protein levels in CRC-derived tissues. (K) Dot-blotting assay for m6A modification levels in total RNAs from CRC tissues. (L) Protein expression levels of m6A regulatory genes in HT29, HT29R, HCT-116, and HCT-116R cell lines. (M) Dot-blotting assay for m6A modification levels in total RNAs from the indicated cell lines.
Fig. 2
Fig. 2
FTO confers CRC cell growth, chemoresistance and stem-like properties. (A–B) Validation of FTO protein (A) and mRNA (B) levels in FTO KO or wild type (WT) HT29 and HCT-116 cells. (C–F) Cell survival curves for FTO KO in HT29 and HCT-116 cells treated with 5-FU or oxaliplatin for 48 h. (G–I) EdU was incorporated for 2 h to evaluate the proliferation in indicated cells (G). The percentage of positive cells was quantified (H–I). (J) FTO KO reduced clonogenic ability of HT29 cells treated with 5-FU or oxaliplatin. (K) Statistical graph of J. (L) FTO KO reduced clonogenic ability of HCT-116 cells treated with 5-FU or oxaliplatin. (M) Statistical graph of L. (N) FTO KO inhibited tumor growth in mice treated with 5-FU. (O–P) Tumor weight (O) and tumor growth curve (P). (Q) FTO KO inhibited tumor growth in mice treated with oxaliplatin. (R–S) Tumor weight (R) and tumor growth curve (S). (T) Sphere formation frequency of HT29-derived stem cells were calculated by extreme limiting dilution assay. (U) The mRNA expressions of OCT4, SOX2, Nanog and ALDH1 detected by qPCR. (V) The indicated protein expressions detected by western blotting. ∗∗P < 0.01, ∗∗∗P < 0.001.
Fig. 3
Fig. 3
FTO dictates iron homeostasis in CRC cells. (A) GO analysis of the up-regulated pathways associated with ferroptosis and iron metabolism after FTO KO in HCT116 cells. (B–C) HT29 intracellular iron fluorescence imaging by FerroOrange probe (B) and quantification (C). (D–E) HCT-116 intracellular iron fluorescence imaging by FerroOrange probe (D) and quantification (E). (F–G) The levels of lipid ROS in HT29 (F) and HCT-116 (G) cells after FTO KO. Cells were treated with vehicle (0.01 % dimethyl sulfoxide), erastin (10 μM), or Fer-1 (5 μM). (H–I) The levels of MDA in HT29 (H) and HCT-116 (I) cells after FTO KO. Cells were treated with vehicle (0.01 % dimethyl sulfoxide), erastin (10 μM), or Fer-1 (5 μM). (J–K) The growth of HT29 (J) or HCT-116 (K) cells was determined with or without erastin (10 μM) treatment. In HT29 and HCT-116 wild-type cells, erastin treatment induced approximately 10 % and 12 % inhibition of cell proliferation, respectively. In contrast, FTO KO cells exhibited markedly higher inhibition rates of 60 % (HT29-FTO KO1) and 53 % (HT29-FTO KO2) or 44 % (HCT-116-FTO KO1) and 41 % (HCT-116-FTO KO2) following erastin treatment. (L) The sphere formation frequency of HT29-derived stem cells with or without erastin treatment. E: erastin. (M − N) The growth of HT29 (M) or HCT-116 (N) cells was determined with or without Fer-1 (5 μM) treatment. (O) The sphere formation frequency of HT29-derived stem cells with or without Fer-1 treatment. F: Fer-1. (P–Q) Western blotting (P) and qPCR (Q) analysis of intestinal epithelial cells in FTO conditional KO mice. (R–S) The levels of lipid ROS (R) and MDA (S) of intestinal epithelial cells in FTO conditional KO mice with or without erastin (30 mg/kg) or Fer-1 (0.8 mg/kg) treatment. ∗∗P < 0.01, ∗∗∗P < 0.001.
Fig. 4
Fig. 4
FTO regulates iron homeostasis through induction of NUPR1. (A) A Venn diagram shows the distribution of unique and common DEGs between the context of FTO KO and WT in HT29 and HCT-116 cells. (B–C) The common differential genes in the GO-enriched pathways were analyzed, and the GO chord graph was drawn for HT29 and HCT-116 cells. (D–E) qPCR (D) and western blotting (E) assays were used to detect NUPR1 expression in FTO KO and WT in HT29 and HCT-116 cells. (F–G) qPCR (F) and western blotting (G) assays were used to detect NUPR1 expression in intestinal epithelial cells from FTO conditional KO mice. (H) Western blotting analysis of NUPR1 protein levels in CRC-derived tissues. (I) qPCR analysis of NUPR1 mRNA levels in CRC-derived tissues. (J) Correlation analysis between FTO and NUPR1 gene expression levels in sigmoid colon (left) and transverse colon (right) tissues. (K–L) DNA abundance in FTH1 (K) and LCN2 (L) promoter regions was evaluated by qPCR after ChIP with NUPR1 antibody or control IgG in HT29 and HCT-116 cells with or FTO KO. (M) Western blotting analysis of NUPR1 knockdown efficiency in HT29 and HCT-116 cells. (N) qPCR analysis was conducted to examine the expression of ferroptosis-related genes in HT29 and HCT-116 cells following NUPR1 knockdown. (O–P) HT29 intracellular iron fluorescence imaging by FerroOrange probe (O) and quantification (P). (Q–R) HCT-116 intracellular iron fluorescence imaging by FerroOrange probe (Q) and quantification (R). (S) The levels of lipid ROS in indicated cells after NUPR1 knockdown. Cells were treated with vehicle (0.01 % dimethyl sulfoxide) or Fer-1 (5 μM). (T) The levels of MDA in indicated cells after NUPR1 knockdown. Cells were treated with vehicle (0.01 % dimethyl sulfoxide) or Fer-1 (5 μM). ∗∗∗P < 0.001.
Fig. 5
Fig. 5
NUPR1-FTH1/LCN2 axis is essential for FTO triggered chemoresistance in CRCs (A) Indicated protein levels were determined by western blotting after NUPR1 overexpression in HT29 and HCT-116 cells with FTO KO. (B–C) The growth of HT29 (B) and HCT-116 (C) cells with FTO KO and NUPR1 overexpression. (D–G) The growth of HT29 and HCT-116 cells with FTO KO and NUPR1 overexpression following 5-FU (D–E) or oxaliplatin (F–G) treatment. (H) Sphere formation frequency of HT29-dereived stem cells by extreme limiting dilution assay analysis. N: NUPR1 overexpression. (I–J) The levels of lipid ROS in indicated cells after NUPR1 overexpression. (K–L) The levels of MDA in indicated cells after NUPR1 overexpression. HT29 (I) and HCT-116(J) cells were treated with vehicle (0.01 % dimethyl sulfoxide), erastin (10 μM) or Fer-1 (5 μM). (M − O) HT29 (M) and HCT-116 (N) intracellular iron fluorescence imaging by FerroOrange probe and quantification (O). (P) The protein levels of FTH1 were assessed in FTH1-overexpressing cells following FTO KO using western blotting. (Q) The levels of lipid ROS in indicated cells after FTH1-overexpressing. (R) Quantification of intracellular iron fluorescence. (S) The protein levels of LCN2 were assessed in LCN2-overexpressing cells following FTO KO using western blotting. (T) The levels of lipid ROS in indicated cells after LCN2-overexpressing. (U) Quantification of intracellular iron fluorescence. ∗∗P < 0.01, ∗∗∗P < 0.001.
Fig. 6
Fig. 6
FTO stabilizes NUPR1 mRNA by reducing m6A methylation levels. (A) m6A modification levels of HT29 and HCT-116 cells with FTO KO. (B–C) Stabilities of NUPR1 mRNA from HT29 (B) and HCT-116 (C) cells after FTO KO with actinomycin D treatment. (D) Stabilities of NUPR1 mRNA from intestinal cells of FTO conditional KO mice with actinomycin D treatment. (E) Analysis of RIP assays detecting NUPR1 mRNA retrieved by a FTO antibody or by IgG around the five high-confidence m6A sites in HT29 and HCT-116 cells. (F) Assessment of RIP assays detecting NUPR1 mRNA +451 site retrieved by a FTO antibody or by IgG in HT29 and HCT-116 cells. (G) Analysis of MeRIP assays detecting NUPR1 mRNA +451 site recovered with m6A antibody in FTO KO HT29 and HCT-116 cells. (H) In HT29 and HCT118 cells with or without FTO KO, luciferase activity of wild-type or mutated NUPR1 reporters were determined. (I) Immunoblotting of FTO was pulled down by streptavidin beads after in vivo expression of WT or mutant S1M tagged NUPR1 mRNA. ∗∗P < 0.01, ∗∗∗P < 0.001.
Fig. 7
Fig. 7
YTHDF2 decays NUPR1 mRNA through recognizing the +451 m6A site. (A) Knockdown of YTHDF2 in HT29 and HCT-116 cells, with subsequent detection of indicated protein expressions using western blotting analysis. (B) Knockdown of YTHDF2 in HT29 and HCT-116 cells with detection of YTHDF2 and NUPR1 mRNA expression using qPCR. (C–D) Stabilities of NUPR1 mRNA from HT29 (C) and HCT-116 (D) cells following YTHDF2 knockdown with actinomycin D treatment. (E) Assessment of RIP assays detecting NUPR1 mRNA +451 site retrieved by a YTHDF2 antibody or by IgG in HT29 and HCT-116 cells. (F) Assessment of RIP assays detecting NUPR1 mRNA +451 site retrieved by a YTHDF2 antibody or by IgG in HT29 and HCT-116 cells with or without FTO KO. (G) In HT29 and HCT118 cells with or without FTO KO or YTHDF2 knockdown, luciferase activity of wild-type or mutated NUPR1 reporters were determined. (H–I) In HT29 and HCT-116 cells with FTO KO, the proliferation following YTHDF2 knockdown was detected using the CCK-8 assay. (J) Sphere formation frequency of FTO KO HT29-derived stem cells with or without YTHDF2 knockdown were calculated with extreme limiting dilution assay analysis. (K–L) Intracellular iron fluorescence imaging by FerroOrange probe (K) and quantification (L) in FTO KO cells after YTHDF2 knockdown. (M − N) The levels of lipid ROS (M) and MDA (N) in FTO KO cells after YTHDF2 knockdown. DF2: YTHDF2. ∗∗∗P < 0.001.
Fig. 8
Fig. 8
Synergetic effect of FTO and NUPR1 antagonist for CRC treatment. (A–C) ZZW-115 inhibited tumor growth in CRCs treated with 5-FU or oxaliplatin. Tumor growth curve (B) and tumor weight (C) were shown. (D–E) Analysis of cell survival in FTO KO HT29 and HCT-116 cells: Exposure to ZZW-115 (HT29 for 5 μM,HCT-116 for 3 μM) followed by 5-FU (D) or oxaliplatin (E) treatment to assess combinatorial therapeutic efficacy. (F–H) ZZW-115 combined with 5-FU inhibits tumor growth after FTO KO. Tumor growth curve (G) and Tumor weight (H) were shown. (I) Sphere formation frequency of FTO KO and WT HT29-derived stem cells with or without ZZW-115 treatment were calculated with extreme limiting dilution assay analysis. Z: ZZW-115. (J–L) FB23 and ZZW-115 combination 5-FU therapy synergistically suppressed tumor growth in murine xenograft models. Tumor growth curve (K) and Tumor weight (L) were shown. ∗P < 0.05,∗∗P < 0.01, ∗∗∗P < 0.001.
figs1
figs1
figs2
figs2
figs3
figs3
figs4
figs4
figs5
figs5
figs6
figs6
figs7
figs7
figs8
figs8
figs9
figs9
figs10
figs10
figs11
figs11
figs12
figs12
figs13
figs13

References

    1. Dekker E., et al. Colorectal cancer. Lancet (London, England) 2019;394:1467–1480. 10207. - PubMed
    1. Siegel R.L., Giaquinto A.N., Jemal A. Cancer statistics. CA Cancer J. Clin. 2024;74(1):12–49. 2024. - PubMed
    1. Pita-Fernández S., et al. Intensive follow-up strategies improve outcomes in nonmetastatic colorectal cancer patients after curative surgery: a systematic review and meta-analysis. Ann. Oncol. : Official Journal of the European Society For Medical Oncology. 2015;26(4):644–656. - PubMed
    1. Johnston P.G., Kaye S. Capecitabine: a novel agent for the treatment of solid tumors. Anti Cancer Drugs. 2001;12(8):639–646. - PubMed
    1. Zaccara S., Ries R.J., Jaffrey S.R. Reading, writing and erasing mRNA methylation. Nat. Rev. Mol. Cell Biol. 2019;20(10):608–624. - PubMed

MeSH terms

LinkOut - more resources