. 2025 May 7:271678X251338952.
doi: 10.1177/0271678X251338952. Online ahead of print.

Neural and vascular contributions to sensory impairments in a human alpha-synuclein transgenic mouse model of Parkinson's disease

Affiliations

Neural and vascular contributions to sensory impairments in a human alpha-synuclein transgenic mouse model of Parkinson's disease

Ruxanda Lungu et al. J Cereb Blood Flow Metab. .

Abstract

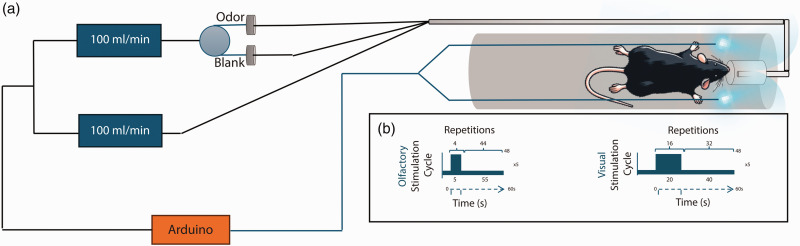
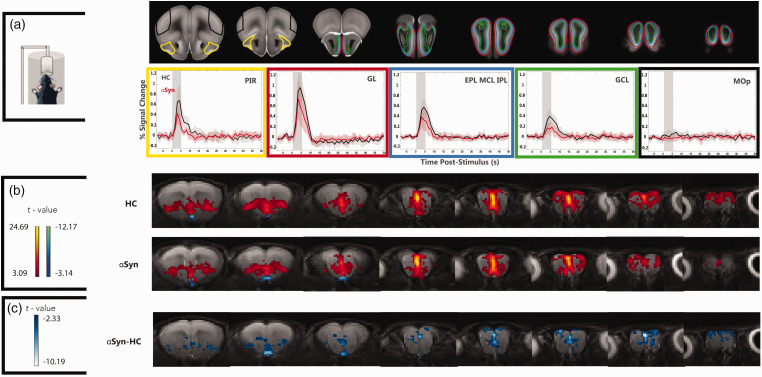
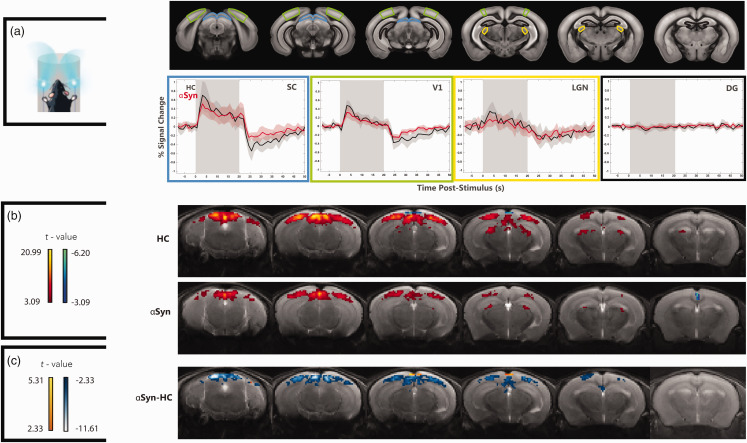
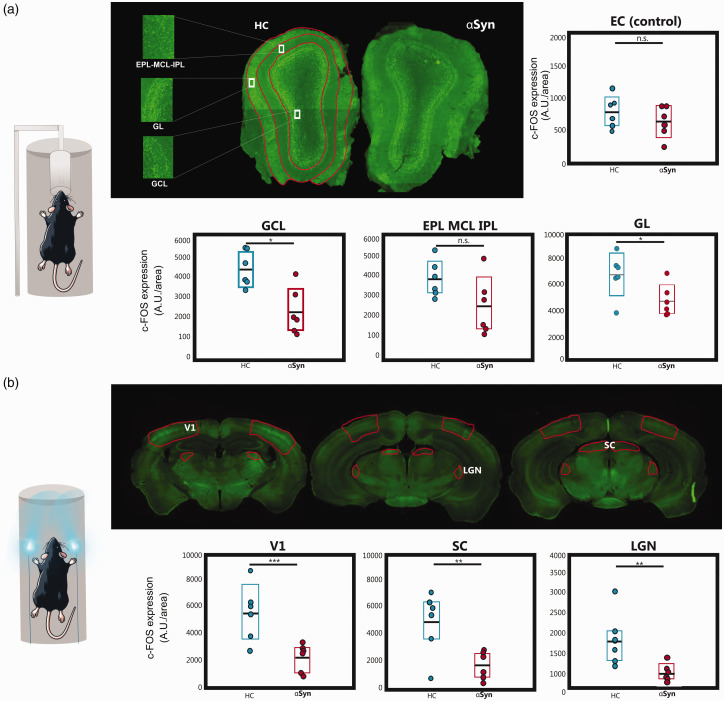
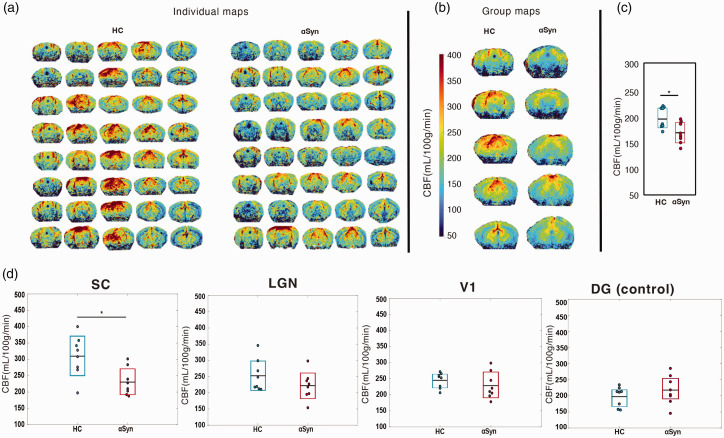
Parkinson's disease (PD) is a complex progressive neurodegenerative disorder involving hallmarks such as α-Synuclein (αSyn) aggregation and dopaminergic dysfunction that affect brain-wide neural activity. Although movement disorders are prominent in PD, sensory impairments also occur relatively early on, mainly in olfactory and, to a lesser extent visual systems. While these deficits have been described mainly at the behavioral and molecular levels, the underlying network-level activity remains poorly understood. Here, we harnessed a human αSyn transgenic mouse model of PD with in vivo functional MRI (fMRI) to map evoked activity in the visual and olfactory pathways, along with pseudo-Continuous Arterial Spin Labeling (pCASL) and c-FOS measurements to disentangle vascular from neuronal effects. Upon stimulation with either odors or flickering lights, we found significant decreases in fMRI responses along both olfactory and visual pathways, in multiple cortical and subcortical sensory areas. Average Cerebral Blood Flow rates were decreased by ∼10% in the αSyn group, while c-FOS levels were reduced by over 50%, suggesting a strong neural driver for the dysfunction, along with more modest vascular contributions. Our study provides insight into brain-level activity in an αSyn-based model, and suggests a novel target for biomarking via quantification of simple sensory evoked responses.

Keywords: ASL; Parkinson’s disease; c-FOS; fMRI; α-Synuclein.


Conflict of interest statement

The author(s) declared the following potential conflicts of interest with respect to the research, authorship, and/or publication of this article: NS serves on the Scientific Advisory Board of Bruker Biospin.

Figures

Figure 1.
Figure 1.
Experimental setup for fMRI experiments. (a) The odor delivery setup uses an olfactometer to deliver odors directly to the mouse nose. Two blue LEDs placed on each side of the head deliver binocular visual stimuli and (b) The fMRI paradigms used for each type of stimulation. The systems are controlled via an Arduino controller and are TTL’ed by the MRI scanner to ensure correct presentation of stimuli.
Figure 2.
Figure 2.
Olfactory fMRI in human α Syn tg mice reveals decreased activation compared to healthy controls. (a) ROI analyses along the olfactory pathway. BOLD activity was detected in all olfactory ROIs (the signals shown were averaged along all epochs and mice) in both groups, while an unrelated area (MOp) showed no activity upon olfactory stimulation, as expected. The vertical gray shaded area is the stimulation period. Red/black lines and shaded areas represent mean signal and 95% CI in the ROIs for α Syn and HC, respectively. Signals from PIR, GL, EPL_MCL_IPL and GCL are lower in the α Syn group (red traces) compared to the control group (black traces) and (b) BOLD-fMRI mapping in the olfactory pathway of α Syn and HC mice. Voxelwise activation maps for each group, obtained from N = 10 HC and N = 10 α Syn mice, reveals strong activation in the HCs along the entire pathway. In the α Syn group, BOLD responses are weaker, and lower overall t-values are observed, especially in more medial aspects of the bulb and (c) quantification of BOLD difference between the groups shows weaker activity along multiple olfactory pathway areas, including PIR, GL, EPL_MCL_IPL and GCL, at the p < 0.01 level.
Figure 3.
Figure 3.
Visual fMRI in α Syn mice reveals decreased activation compared to healthy controls. (a) ROI analyses along the visual pathway. ROI analysis in the visual pathway and a control area, reflecting mean BOLD activity (averaging all epochs in the paradigm) for the two groups. The vertical gray shaded area is the stimulation period. Red/black lines and shaded areas represent mean signal and 95% CI in the ROIs for α Syn and HC obtained from all animals, respectively. (b) BOLD-fMRI group maps (HC vs α Syn) in the visual pathway, averaged across the N = 13 HC mice and N = 12 α Syn mice. In the α Syn group, BOLD responses are weaker, and lower overall t-values are observed in all analyzed areas and (c) Quantification of BOLD difference between the groups shows weaker activity along multiple visual pathway areas, including SC and V1, at the p < 0.01 level.
Figure 4.
Figure 4.
c-FOS levels. (a) Histological slices of the c-FOS levels in the MOB, and the analyzed ROIs (highlighted in red). Good expression levels were observed for both groups. ROIs were chosen anatomically (when needed, encompassing multiple slices for quantification) for N = 6 animals per group. Analysis of c-FOS protein levels in each ROI using a t-test (*p < 0.05, **p < 0.01, and ***p < 0.005). Colored bars indicate the 95% CI and the black horizontal line the mean. Statistically significant reductions in c-FOS levels after olfactory stimulation were observed in GL and GCL but not in the EPL_MCL_IPL and in the control (unrelated) area, the entorhinal cortex (EC). Effect size estimates were d = 1.449 in the GCL, d = 1.265 in the EPL_MCL_IPL and d = 1.3661 in the GL, indicating a very large effect size; and d = 0.623 in the EC (medium effect size) and (b) Same as (a) but for relevant slices of the visual pathway. Statistically significant reductions in c-FOS levels after visual stimulation were observed for the α Syn group compared to its HC littermate in the areas of the visual pathway. Cohen’s d values were: d = 1.975 in the V1; d = 1.665 in the LGN; d = 1.784 in the SC, reflecting very large effect sizes.
Figure 5.
Figure 5.
pCASL CBF maps. (a) Quantitative CBF maps for N = 8 HC and N = 8 α Syn individual animals (5 slices each). (b) Average group maps of the animals shown in (a). (c) CBF quantification. Quantification of brain perfusion of the studied groups. Bars indicate the 95% CI and the black horizontal line the mean. Statistically significant differences were found (t-test, p < 0.05) between groups, with d = 1.409 (very large effect size) and HC animals exhibiting higher CBF compared with the α Syn group and (d) ROI analysis. Statistically significant reduction of CBF was found in the SC (t-test, p < 0.05) but not in the other areas, including in the control ROI. Cohen’s d values were: d = 0.5087 in DG (control); d = 0.4832 in the V1; d = 0.6844 in the LGN; and d = 1.4840 in the SC, reflecting medium to very large effect sizes.

Similar articles

References

    1. Lamptey RNL, Chaulagain B, Trivedi R, et al.. A review of the common neurodegenerative disorders: Current therapeutic approaches and the potential role of nanotherapeutics. IJMS 2022; 23: 1851. - PMC - PubMed
    1. Pang SYY, Ho PWL, Liu HF, et al.. The interplay of aging, genetics and environmental factors in the pathogenesis of Parkinson’s disease. Transl Neurodegener 2019; 8: 23. - PMC - PubMed
    1. Mastenbroek SE, Vogel JW, Collij LE, et al.. Disease progression modelling reveals heterogeneity in trajectories of lewy-type α-synuclein pathology. Nat Commun 2024; 15: 5133. - PMC - PubMed
    1. Yang K, Wu Z, Long J, et al.. White matter changes in Parkinson’s disease. Npj Park Dis 2023; 9: 150. - PMC - PubMed
    1. Melzer TR, Watts R, MacAskill MR, et al.. White matter microstructure deteriorates across cognitive stages in Parkinson disease. Neurology 2013; 80: 1841–1849. - PubMed

LinkOut - more resources