. 2025 Jun;24(6):100983.
doi: 10.1016/j.mcpro.2025.100983. Epub 2025 May 5.

Discovery of Proteoforms Associated With Alzheimer's Disease Through Quantitative Top-Down Proteomics

Affiliations

Discovery of Proteoforms Associated With Alzheimer's Disease Through Quantitative Top-Down Proteomics

James M Fulcher et al. Mol Cell Proteomics. 2025 Jun.

Abstract

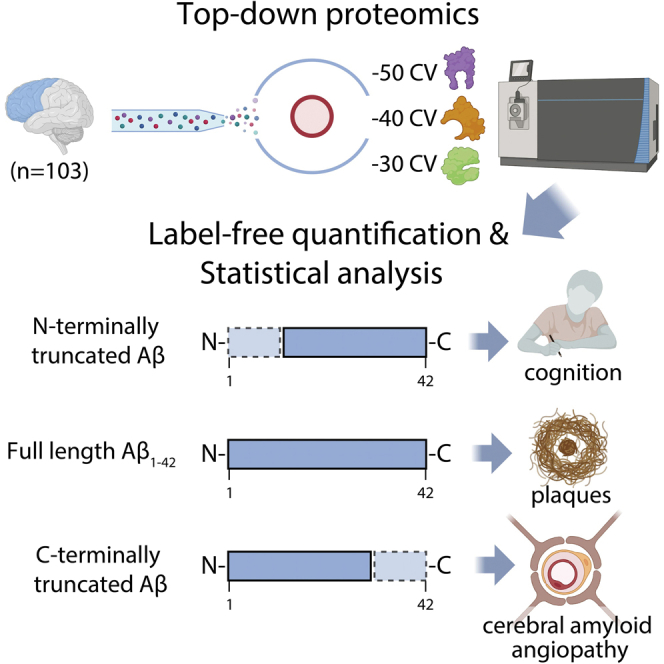
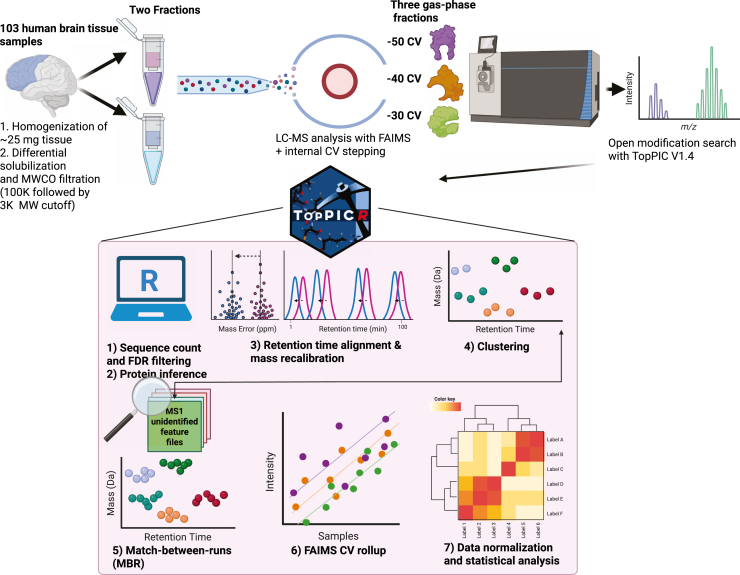
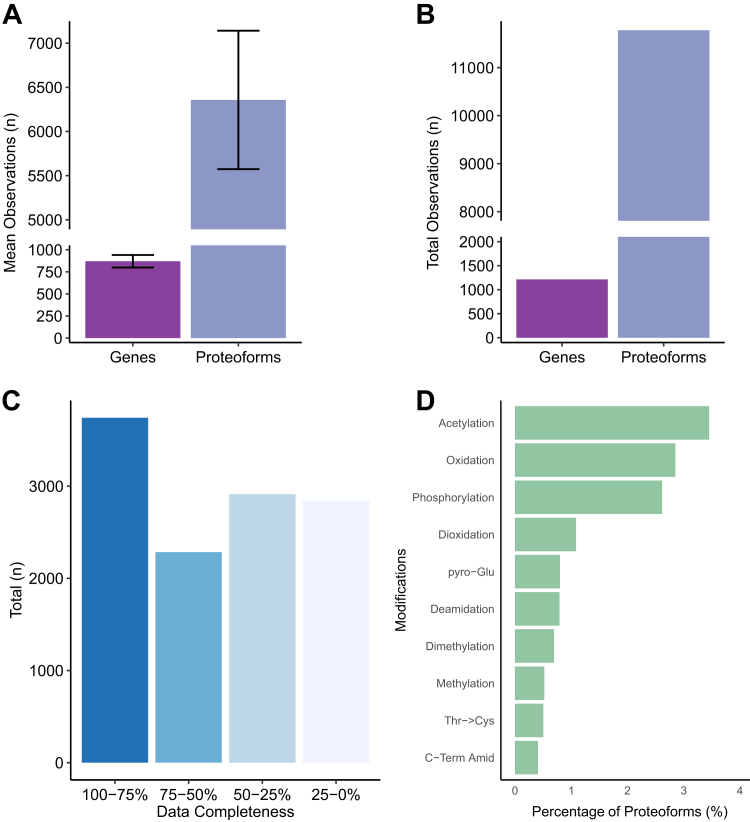
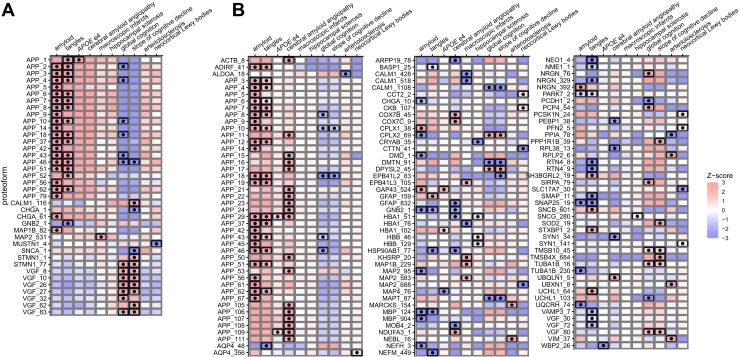
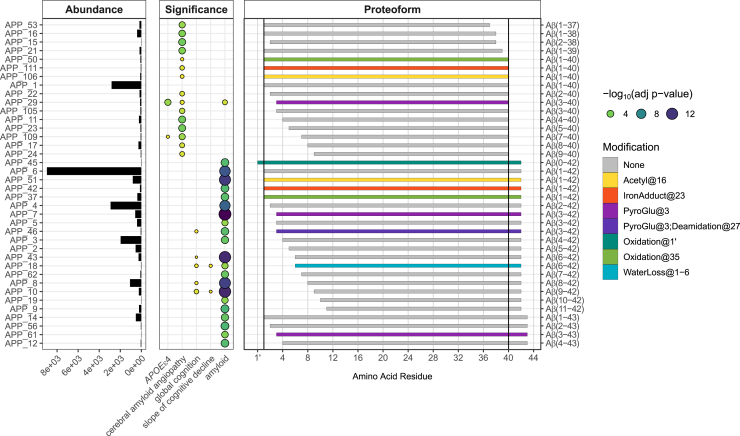
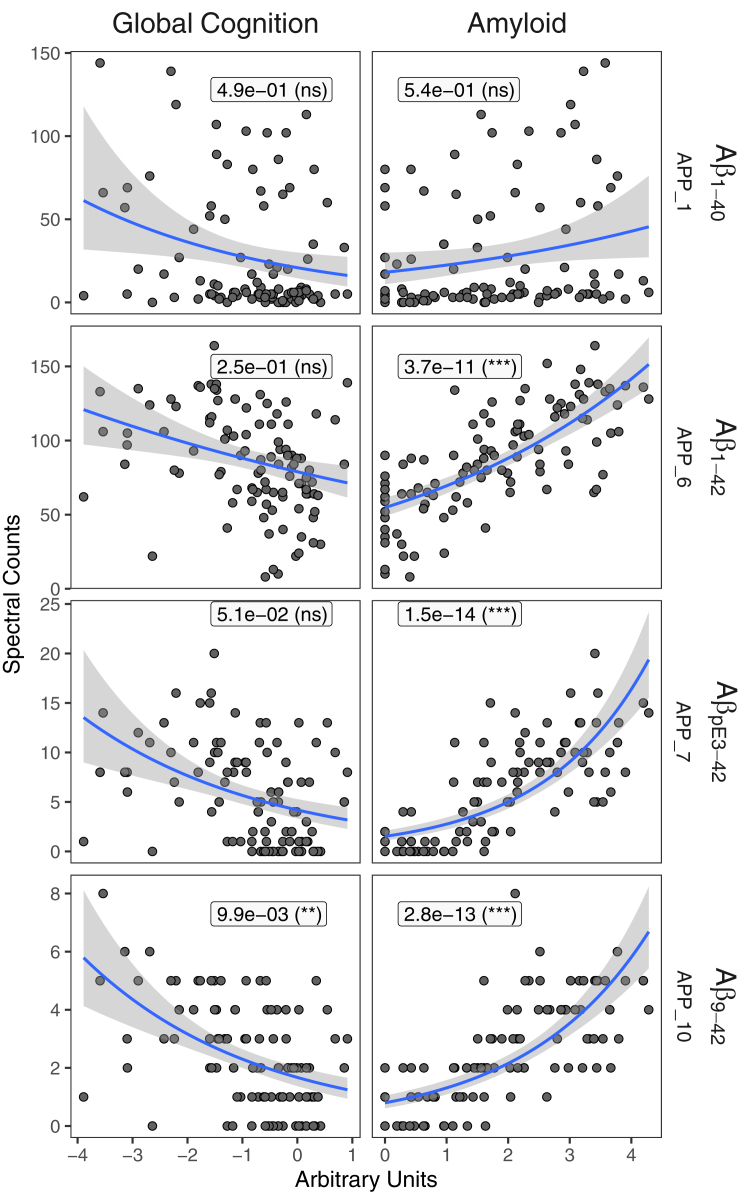
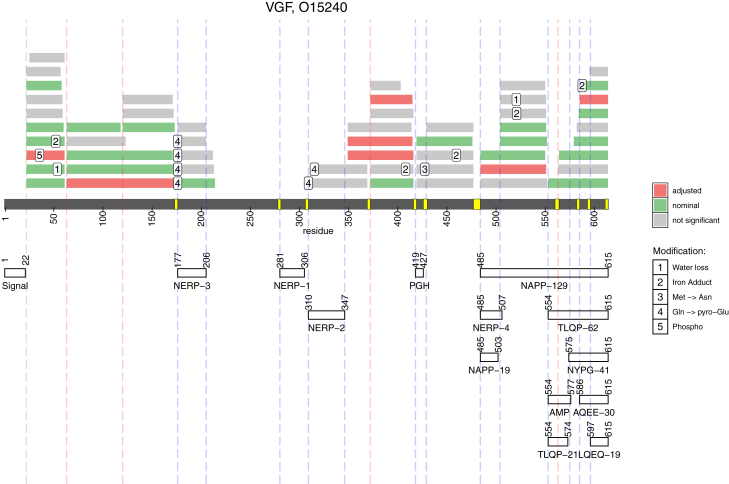
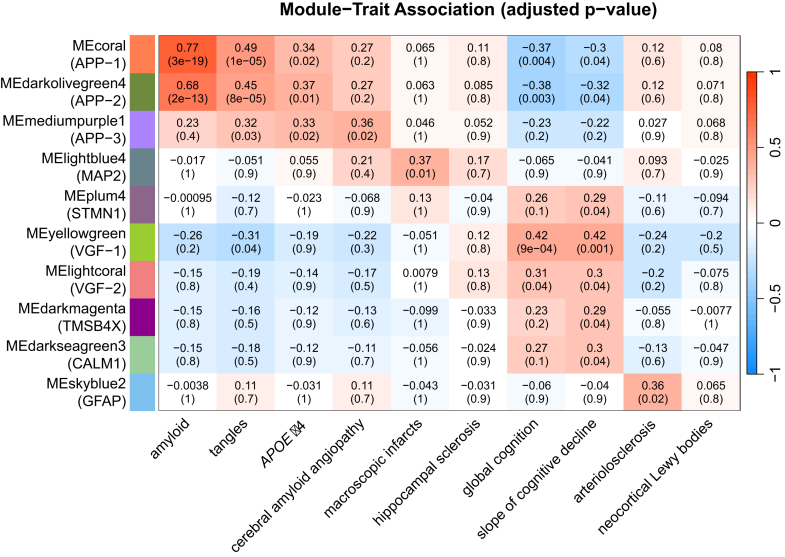
The complex nature of Alzheimer's disease (AD) and its heterogenous clinical presentation has prompted numerous large-scale -omic analyses aimed at providing a global understanding of the pathophysiological processes involved. AD involves isoforms, proteolytic products, and posttranslationally modified proteins such as amyloid beta (Aβ) and microtubule-associated protein tau. Top-down proteomics directly measures these species and thus, offers a comprehensive view of pathologically relevant proteoforms that are difficult to analyze using traditional proteomic techniques. Here, we broadly explored associations between proteoforms and clinicopathological traits of AD by deploying a quantitative top-down proteomics approach across frontal cortex of 103 subjects selected from the ROS and MAP cohorts. The approach identified 1213 proteins and 11,782 proteoforms, of which 154 proteoforms had at least one significant association with a clinicopathological phenotype. One important finding included identifying Aβ C-terminal truncation state as the key property for differential association between amyloid plaques and cerebral amyloid angiopathy. Furthermore, various N-terminally truncated forms of Aβ had noticeably stronger association with amyloid plaques and global cognitive function. Additionally, we discovered six VGF neuropeptides that were positively associated with cognitive function independent of pathological burden. The database of brain cortex proteoforms provides a valuable context for functional characterization of the proteins involved in AD and other late-onset brain pathologies.

Keywords: Alzheimer's disease; amyloid beta; top-down proteomics.


Conflict of interest statement

Conflicts of interests The authors declare that they have no conflicts of interests with the contents of this article.

Figures

None
Graphical abstract
Fig. 1
Fig. 1
Workflow for collecting and analyzing top-down proteomics datasets of 103 human brains. Human brain tissue was processed by differential solubilization, separated into two fractions, and then analyzed by LC-MS with gas-phase fractionation using FAIMS. After database searching with TopPIC, proteoform spectrum match (PrSM) result files are imported into R for downstream analysis with TopPICR. Figure was partially created with BioRender.
Fig. 2
Fig. 2
Overview of the top-down data.A, mean number of unique genes and proteoforms observed from each human subject. Error bars represent ± sd. B, total unique proteoforms and genes found in the entire study. C, percentile bins containing proteoforms with different degrees of data completeness. D, top 10 posttranslational modifications found across the entire study, expressed as a percentage of all proteoforms found with the stated modification.
Fig. 3
Fig. 3
Correlation of TDP proteoforms with the parent protein BUP (SRM and TMT) measurements. Individual points represent proteoforms of a given protein. Plots are shown for proteins that were present in all three sets of data, had high correlation (R > 0.35) between the two BUP datasets, and had more than one proteoform in TDP data. Proteoforms are ordered on the Y-axis according to their average correlation to the BUP datasets. The dashed line reflects the cross-BUP (SRM/TMT) correlation value for a given protein.
Fig. 4
Fig. 4
Statistical associations. Punchcard heatmaps of statistical associations between proteoforms and cognitive/pathological variables using (A) intensity-based measurements and (B) spectral counts. For label-free intensities, associations were modeled using linear regression while spectral counts associations were modeled by a quasi-Poisson generalized linear model. In both modeling approaches, abundances were adjusted using postmortem interval as a covariate. Black dots represent statistically significant associations (Benjamini–Hochberg adjusted p-values <0.05). Proteoforms are labeled with their gene of origin, followed by an arbitrary number assigned based on clustering.
Fig. 5
Fig. 5
Differential association of amyloid beta proteoforms between amyloid plaques and cerebral amyloid angiopathy.Leftmost panel contains bar plots showing the spectral count abundance for each amyloid beta proteoform. Middle panel displays the significance of the association between each amyloid beta proteoform and several clinicopathological or genetic variables, including APOE ε4 status, cerebral amyloid angiopathy pathology, last visit global cognition score, person-specific rate of cognitive decline adjusted by age, sex, and education, and overall amyloid level (amyloid). The degree of significance is indicated by the circle size and color. The rightmost panel maps every amyloid beta proteoform to an APP reference sequence (dark gray bar) and colors them by the type of PTM identified. Amyloid beta proteoforms are sorted by ascending C-terminal amino acid ending position, followed by ascending N-terminal amino acid starting position.
Fig. 6
Fig. 6
Association of selected Aβ proteoform abundances (y axis) with the global cognition level and amyloid plaques load (x axis). Proteoform abundances were quantified using spectral counting and modeled using a quasi-Poisson approach. The estimate of the mean and the corresponding standard error are shown as a blue line and shaded area. For the purpose of visualization, the fitted model does not include the batch effect. The Benjamini–Hochberg adjusted p-values (ns > 0.05, ∗ < 0.05, ∗∗ < 0.01, and ∗∗∗ < 0.001) are shown for the full model that factors in batches and are the same as in Figure 4.
Fig. 7
Fig. 7
Proteolytic cleavage map of VGF.Middle gray bar and residue numbers indicate the full-length VGF protein. Yellow markings along the protein sequences denote the di-basic sites that are the putative cleavage sites for proprotein convertases. Annotation of the known VGF neuropeptides is shown below this residue labeling (white bars). The VGF proteoforms quantified in this study are shown in the upper half and colored according to significance threshold (nominal significance is shown in green, adjusted significance is shown in red, not significant forms are shown in gray). Observed posttranslational modifications are numbered and annotated at their localized amino acid position. Vertical dashed blue lines indicate known cleavage sites while dashed redlines show the previously unknown cleavage sites. The single dashed greenline indicates the cleavage site for the signal peptide.
Fig. 8
Fig. 8
Heatmap of the significant associations of WGCNA modules' eigengenes with selected clinical and pathological variables. The amplitude and directionality of the correlation in color-coded in blue-white-red gradient and is shown in each cell. The adjusted p-values, reflecting the significance of the association, are shown in parentheses.

Similar articles

References

    1. GBD 2016 Dementia Collaborators Global, regional, and national burden of Alzheimer's disease and other dementias, 1990-2016: a systematic analysis for the Global Burden of Disease Study 2016. Lancet Neurol. 2019;18:88–106. - PMC - PubMed
    1. Golde T.E. Alzheimer's disease - the journey of a healthy brain into organ failure. Mol. Neurodegener. 2022;17:18. - PMC - PubMed
    1. DeTure M.A., Dickson D.W. The neuropathological diagnosis of Alzheimer's disease. Mol. Neurodegener. 2019;14:32. - PMC - PubMed
    1. Ferreira D., Nordberg A., Westman E. Biological subtypes of Alzheimer disease: a systematic review and meta-analysis. Neurology. 2020;94:436–448. - PMC - PubMed
    1. Bellenguez C., Küçükali F., Jansen I.E., Kleineidam L., Moreno-Grau S., Amin N., et al. New insights into the genetic etiology of Alzheimer's disease and related dementias. Nat. Genet. 2022;54:412–436. - PMC - PubMed

LinkOut - more resources