. 2025 Jun;155(6):1768-1781.
doi: 10.1016/j.tjnut.2025.04.030. Epub 2025 May 5.

Induction of Fructose Mediated De Novo Lipogenesis Coexists with the Upregulation of Mitochondrial Oxidative Function in Mice Livers

Affiliations

Induction of Fructose Mediated De Novo Lipogenesis Coexists with the Upregulation of Mitochondrial Oxidative Function in Mice Livers

Parama Bhattacharjee et al. J Nutr. 2025 Jun.

Abstract

Background: Dysfunctional mitochondrial metabolism and sustained de novo lipogenesis (DNL) are characteristics of metabolic dysfunction-associated steatotic liver disease (MASLD), a comorbidity of obesity and type 2 diabetes. Fructose, a common sweetener and a potent inducer of lipogenesis, contributes to the etiology of MASLD.

Objectives: Our goal was to determine whether higher rates of DNL, through its biochemical relationships with mitochondria, can contribute to dysfunctional induction of oxidative networks in the liver.

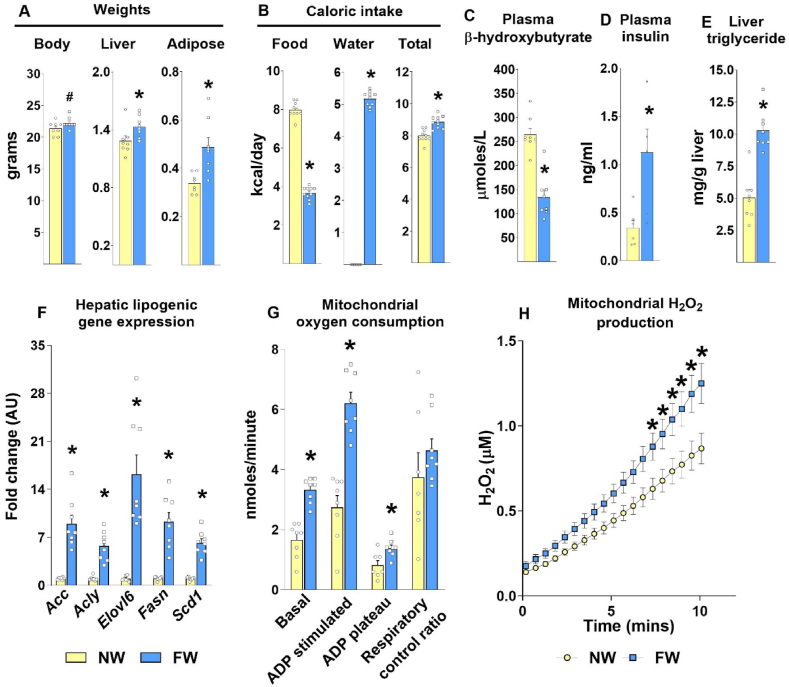
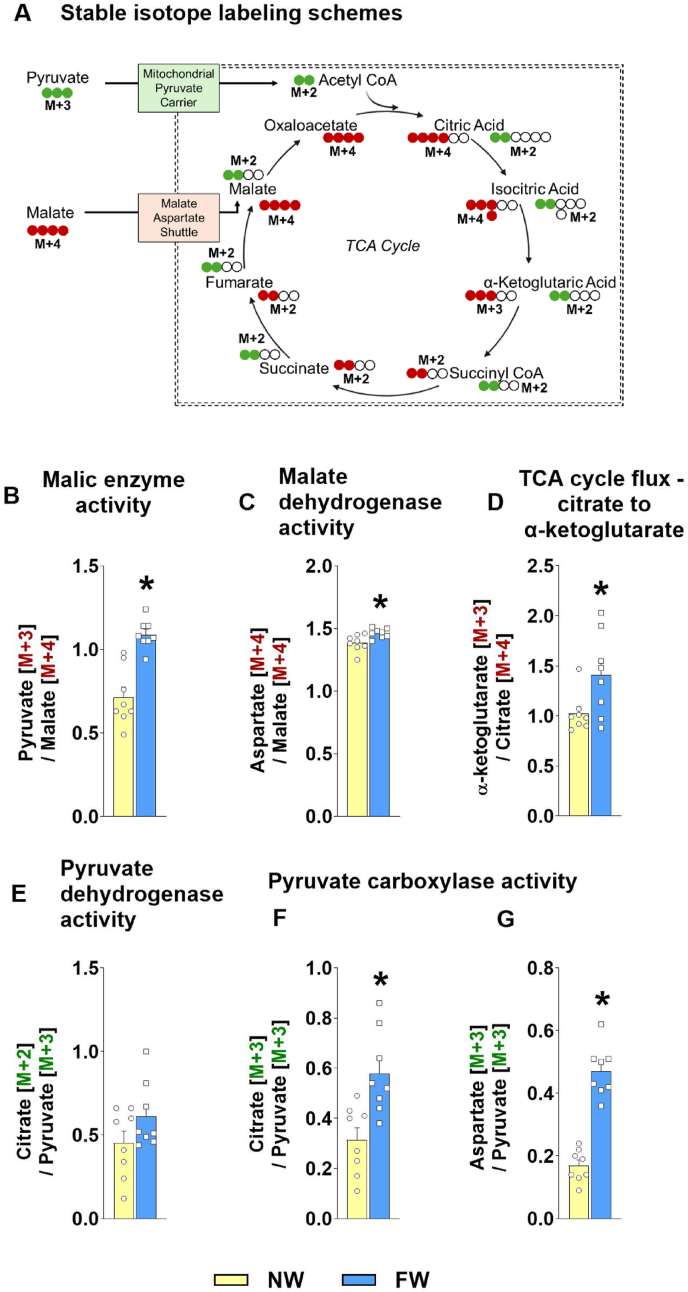
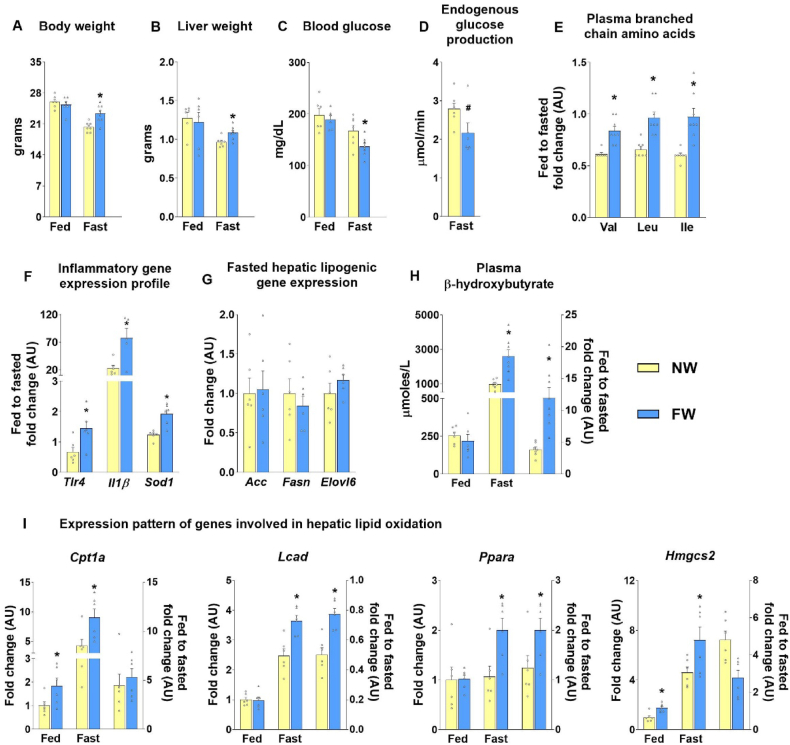
Methods: Male C57BL/6JN mice were given a low-fat (10% fat kcal, 49.9% corn starch kcal), high-fat (HF; 60% fat kcal), or HF/high-fructose diet (HF/HFr; 25% fat kcal, 34.9% fructose kcal) for 24 wk. In a follow-up study, mice on normal feed pellets were provided either 30% fructose in drinking water (FW) to induce hepatic DNL or regular water (NW) for 14 d. Hepatic mitochondria and liver tissue were used to determine oxygen consumption, reactive oxygen species (ROS) generation, tricarboxylic acid (TCA) cycle activity, and gene/protein expression profiles.

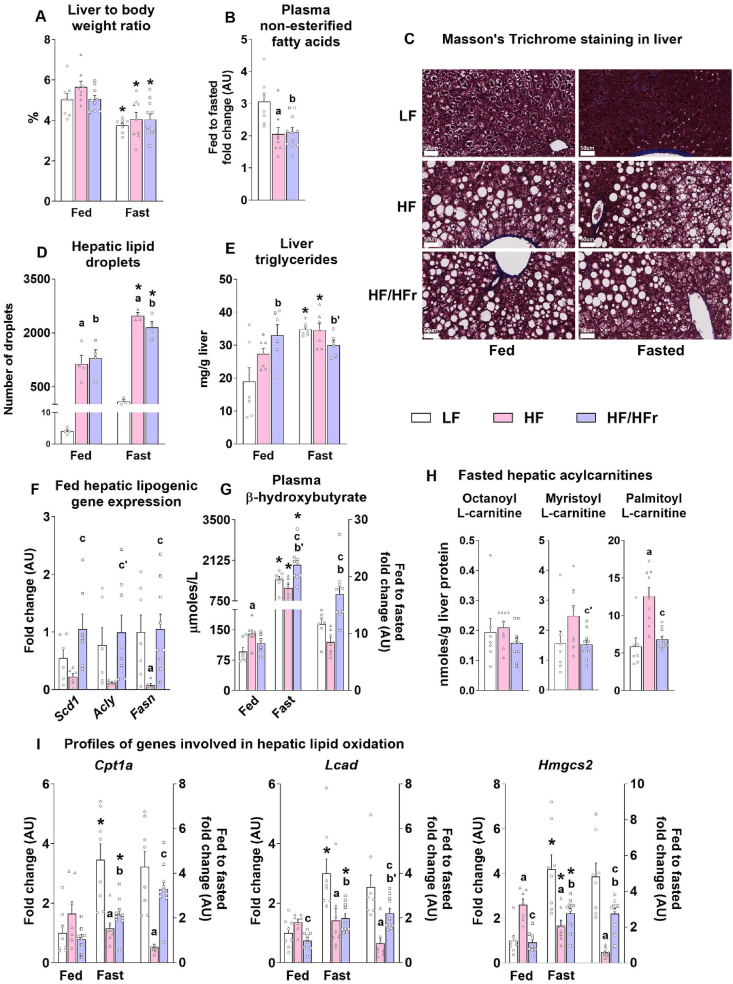
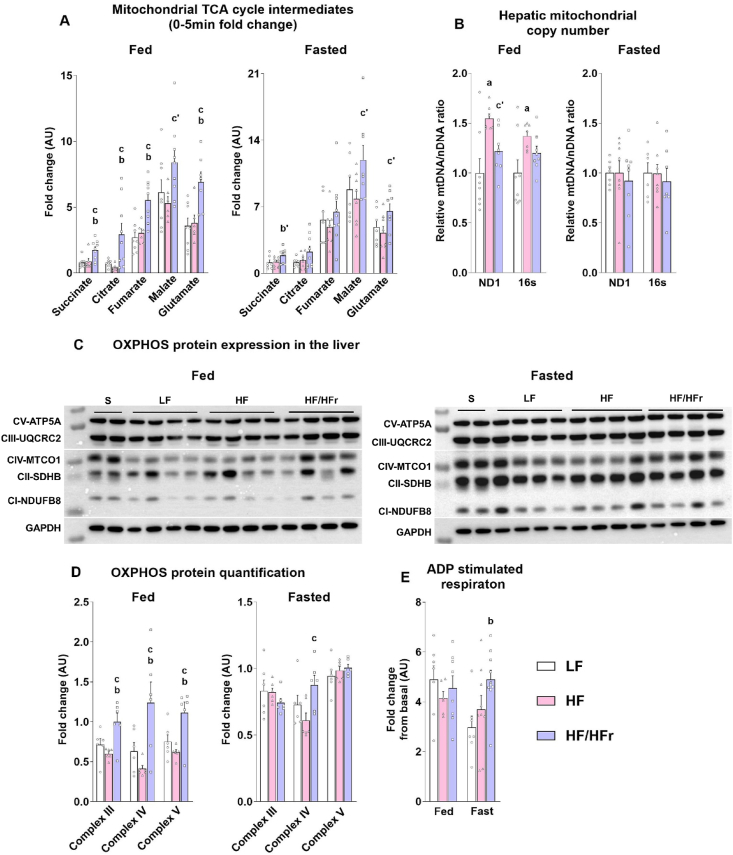
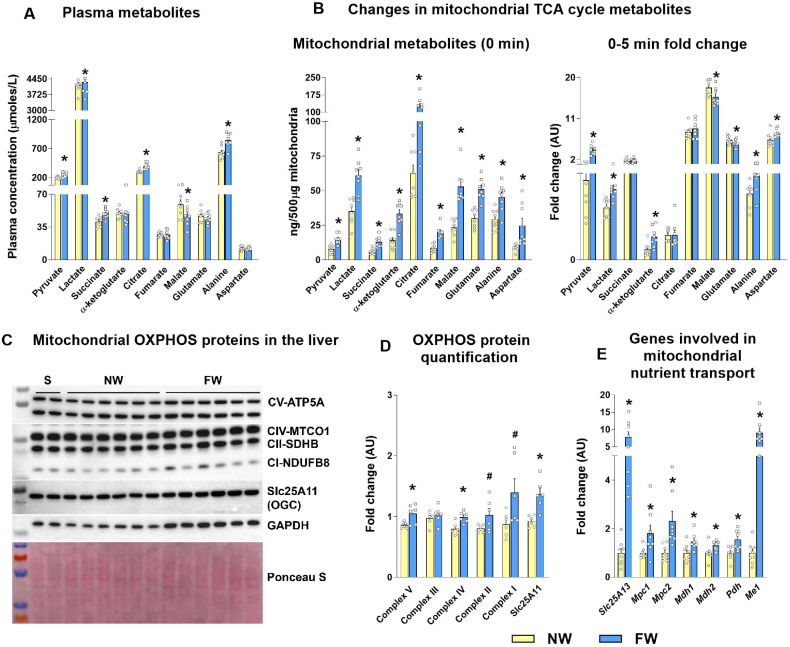
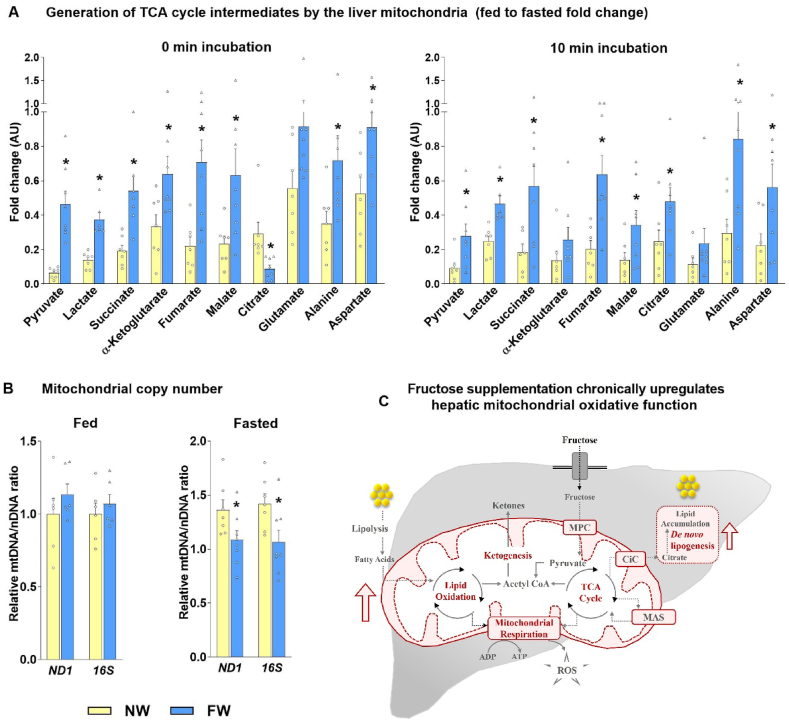
Results: Hepatic steatosis remained similar between HF and HF/HFr fed mice livers. However, lipogenic and lipid oxidation gene expression profiles and the induction of TCA cycle metabolism were all higher (P ≤ 0.05) in HF/HFr livers. Under fed conditions, the upregulation of DNL in FW livers occurred in concert with higher mitochondrial oxygen consumption (basal; 1.7 ± 0.21 compared with 3.3 ± 0.14 nmoles/min, P ≤ 0.05), higher ROS (0.87 ± 0.09 compared with 1.25 ± 0.12 μM, P ≤ 0.05) and higher flux through TCA cycle components P ≤0.05. Furthermore, TCA cycle activity and lipid oxidation remained higher during fasting in the FW livers P ≤ 0.05.

Conclusions: Our results show that fructose administration to mice led to the concurrent induction of mitochondrial oxidative networks and DNL in the liver. Sustained induction of both DNL and mitochondrial oxidative function could accelerate cellular stress and metabolic dysfunction during MASLD.

Keywords: de novo lipogenesis; fructose; ketogenesis; lipid oxidation; liver; mitochondrial metabolism; tricarboxylic acid cycle.


Conflict of interest statement

Conflict of interest The authors report no conflicts of interest.

Figures

FIGURE 1
FIGURE 1
De novo lipogenesis and lipid oxidation were both higher in high-fat/high-fructose-fed mice. (A) Liver-to-body weight ratio in mice reared on LF, HF, or HF/HFr diets for 24-wk. (B) Fed-to-fasted fold change in plasma nonesterified fatty acids. (C) Fed and fasted livers stained with Masson’s Trichrome stain (scale bar 50 μm, n = 4) and (D) the abundance of lipid droplets in the liver sections (n = 4). (E) Liver triglyceride levels after dietary treatments in fed and fasted mice. (F) Fed hepatic lipogenic gene expression (Scd1, Acyl, Fasn) profiles. (G) Circulating levels of β-hydroxybutyrate under fed and fasted conditions. (H) Fasting levels of longer-chain acylcarnitines (octanoyl-, myristoyl-, and palmitoyl-) in the liver. (I) Fed-to-fasted changes in the expression of genes involved in lipid oxidation (Cpt1a, Lcad, Hmgcs2) in the liver. Sample size ranged from 8 to 11/group unless stated otherwise. Following 1-way ANOVA and pairwise mean comparisons, significance at P ≤ 0.05 are represented by a—LF compared with HF; b—LF compared with HF/HFr; c—HF compared with HF/HFr and significance at P ≤ 0.1 are represented by a′—LF compared with HF; b′—LF compared with HF/HFr; c′—HF compared with HF/HFr. Furthermore, ∗ indicates significance at P ≤ 0.05 following an unpaired Student’s t-test between fed and fasted groups. ANOVA, analysis of variance; AU, arbitrary units; Scd1, stearoyl-CoA desaturase; Acly, ATP citrate lyase; Cpt1a, carnitine palmitoyl transferase 1; Lcad, long-chain acyl dehydrogenase; HF, high-fat; HFr high-fructose; Hmgcs2, 3-hydroxy-3-methylglutaryl-CoA synthase 2; LF, low-fat.
FIGURE 2
FIGURE 2
Mitochondrial activity and OXPHOS protein profiles in high-fat/high-fructose fed mice livers. (A) Changes in TCA cycle intermediates (0–5 min fold change) in isolated mitochondria from LF, HF, HF/HFr groups under fed and fasted conditions. (B) Mitochondrial copy number, under fed and fasted conditions, determined from the mtDNA/nDNA ratio by amplification of stable mitochondrial genes, DN1 and 16S, and normalized to hexokinase gene expression. (C) Expression profiles of the OXPHOS proteins across the 3 dietary treatments under fed and fasted conditions and (D) their densitometric analysis. (E) Fed-to-fasted changes in ADP-stimulated oxygen consumption by the hepatic mitochondria following the 3 dietary treatments. Results (n = 8–11/group) were considered significant at P ≤ 0.05 following pairwise mean comparisons (1-way ANOVA), which are represented by the following alphabets a—LF compared with HF; b—LF compared with HF/HFr; c—HF compared with HF/HFr and P ≤ 0.1 is indicated by a′—LF compared with HF; b′—LF compared with HF/HFr; c′—HF compared with HF/HFr. ANOVA, analysis of variance; AU, arbitrary units; HF, high-fat; HFr, high-fructose; LF, low-fat; ND1, NADH dehydrogenase 1; OXPHOS, oxidative phosphorylation; TCA, tricarboxylic acid.
FIGURE 3
FIGURE 3
Fructose in drinking water induced lipogenesis and mitochondrial respiration in the liver of fed-mice. (A) Body weight, liver weight, and adipose tissue weight after 14-d on normal drinking water (NW) or 30% fructose in drinking water (FW). (B) Daily caloric intake from food and water. (C) Plasma ketone (β-hydroxybutyrate) concentration, (D) plasma insulin, and (E) liver triglyceride in fed mice after 14-d of treatments. (F) Changes in the expression pattern of genes involved in lipogenesis (Acc, Acly, Elovl6, Fasn, Scd1) in the liver. (G) Indices of hepatic mitochondrial oxygen consumption rate including basal respiration, ADP-stimulated respiration, plateau after ADP consumption, and respiratory control ratio. (H) Generation of reactive oxygen species by isolated hepatic mitochondria in NW and FW groups. Results (n = 8/group) were considered significant at P ≤ 0.05 following a t-test between NW and FW groups, which is indicated by “∗.” AU, arbitrary units; Acc, acetyl-CoA carboxylase; Acly, ATP citrate lyase; Elovl6; ELOVL fatty acid elongase 6; Fasn, fatty acid synthase; Scd1, stearoyl-CoA desaturase.
FIGURE 4
FIGURE 4
Alterations in mitochondrial oxidative networks associated with fructose in drinking water, under fed conditions. (A) Plasma metabolite levels following fructose (FW) compared with normal drinking water (NW). (B) Metabolite levels in freshly isolated mitochondria under basal conditions (0 min) and after 5 min (0–5 min fold change) of mitochondrial incubations in a respiration buffer. (C) Expression patterns of hepatic mitochondrial proteins in NW compared with FW groups and (D) the densitometric analysis of the protein bands. (E) Expression profiles of genes involved in mitochondrial nutrient transport in the liver between NW and FW groups. Results (n = 8/group) were considered significant at P ≤ 0.05 following a t-test between NW and FW groups, which is indicated by “.” “#” represents P ≤ 0.1 following the t-test between NW and FW groups. AU, arbitrary units; OGC (Slc25A11), 2-oxoglutarate carrier; Slc25A13, solute carrier family 25 member 13; Mpc1, mitochondrial pyruvate carrier 1; Mpc2, mitochondrial pyruvate carrier 2; Mdh1, malate dehydrogenase 1; Mdh2, malate dehydrogenase 2; Pdh, pyruvate dehydrogenase; Me1, malic enzyme 1; S, standard (mixture of pooled samples).
FIGURE 5
FIGURE 5
Stable isotope-based profiling of mitochondrial TCA cycle function. (A) Stable isotope labeling scheme illustrating the incorporation of the 13C from [13C4]malate (M+4) or [13C3]pyruvate (M+3) into the intermediates of the TCA cycle. (B) Pyruvate [M+3] to malate [M+4] malate ratio in isolated mitochondria as an indirect index of malic enzyme activity. (C) Aspartate [M+4] to malate [M+4] ratio as a reflection of flux through malate dehydrogenase (MDH2) and glutamic-oxaloacetic transaminase (GOT2). (D) α-ketoglutarate [M+3] to citrate [M+4] ratio as an index of flux through the initial 3 steps of the TCA cycle. (E) Incorporation of pyruvate [M+3] into citrate [M+2] as an indirect index of pyruvate dehydrogenase activity. (F) Incorporation of pyruvate [M+3] into aspartate [M+3] as a crude index of flux through pyruvate carboxylase and GOT2. Results (n = 8/group) were considered significant at P ≤ 0.05 following a t-test between NW and FW groups, which is indicated by “.” “#” represents P ≤ 0.1 following the t-test between NW and FW groups. TCA, tricarboxylic acid.
FIGURE 6
FIGURE 6
Higher induction of lipid oxidation in the livers of mice reared on fructose drinking water is sustained during fasting. Changes in (A) body weight, (B) liver weight, and (C) blood glucose concentration in NW and FW groups following 14 d of dietary treatments under fed and fasted conditions. (D) Change in endogenous glucose production following overnight fasting. (E) Fed-to-fasted fold change of plasma branched chain amino acid levels (valine, leucine, isoleucine). Expression profile of hepatic genes involved in (F) inflammation (Tlr4, Ilβ), antioxidant defense (Sod1), and (G) lipogenesis (Acc, Fasn, Elovl6). (H) Plasma β-hydroxybutyrate levels under fed and fasted conditions. (I) Expression pattern of genes involved in hepatic lipid oxidation (Cpt1a, Lcad, Pparα) and ketogenesis (Hmgcs2) under fed and fasted conditions. Results (n = 5–8/group) were considered significant at P ≤ 0.05 following a t-test between NW and FW groups, which is indicated by “.” “#” represents P ≤ 0.1 following the t-test between NW and FW groups. AU, arbitrary units; Val, valine; Leu, leucine; Ile, isoleucine; Tlr4, toll-like receptor 4; Il1β, IL 1β; Sod1, superoxide dismutase 1; Acc, acetyl-CoA carboxylase; Elovl6; ELOVL fatty acid elongase 6; Fasn, fatty acid synthase; Cpt1a, carnitine palmitoyltransferase 1A; Lcad, long-chain acyl-CoA dehydrogenase; Ppara, peroxisome proliferator-activated receptor alpha; Hmgcs2, 3-hydroxy-3-methylglutaryl-CoA synthase 2.
FIGURE 7
FIGURE 7
Greater induction of mitochondrial TCA cycle metabolism during a feeding-to-fasting transition in mice reared on fructose in drinking water. (A) Levels of metabolites in freshly isolated mitochondria from the NW and FW livers after 0 and 10 min of respiration, expressed as fed-to-fasted fold change. (B) Mitochondrial copy number under fed and fasted states, determined from the mtDNA/nDNA ratio by amplification of stable mitochondrial genes, DN1 and 16S, and normalized to hexokinase gene expression. (C) Schematic representation of changes in mitochondrial function in the liver after fructose consumption. In summary, fructose consumption not only resulted in the induction of de novo lipogenesis but also resulted in chronic upregulation of lipid oxidation and overall mitochondrial TCA cycle metabolism. Results (n = 8/group) were considered significant at P ≤ 0.05 following a t-test between NW and FW groups, which is indicated by “∗.” AU, arbitrary units; ND1, NADH dehydrogenase 1; 16S, 16S ribosomal RNA; TCA, tricarboxylic acid.

Similar articles

References

    1. Rinella M.E., Lazarus J.V., Ratziu V., Francque S.M., Sanyal A.J., Kanwal F., et al. A multisociety Delphi consensus statement on new fatty liver disease nomenclature. Hepatology. 2023;78(6):1966–1986. doi: 10.1097/HEP.0000000000000520. - DOI - PMC - PubMed
    1. Sunny N.E., Parks E.J., Browning J.D., Burgess S.C. Excessive hepatic mitochondrial TCA cycle and gluconeogenesis in humans with nonalcoholic fatty liver disease. Cell. Metab. 2011;14(6):804–810. doi: 10.1016/j.cmet.2011.11.004. - DOI - PMC - PubMed
    1. Satapati S., Sunny N.E., Kucejova B., Fu X., He T.T., Mendez-Lucas A., et al. Elevated TCA cycle function in the pathology of diet-induced hepatic insulin resistance and fatty liver. J. Lipid. Res. 2012;53(6):1080–1092. doi: 10.1194/jlr.M023382. - DOI - PMC - PubMed
    1. Patterson R.E., Kalavalapalli S., Williams C.M., Nautiyal M., Mathew J.T., Martinez J., et al. Lipotoxicity in steatohepatitis occurs despite an increase in tricarboxylic acid cycle activity. Am. J. Physiol. Endocrinol. Metab. 2016;310(7):E484–E494. doi: 10.1152/ajpendo.00492.2015. - DOI - PMC - PubMed
    1. Koliaki C., Szendroedi J., Kaul K., Jelenik T., Nowotny P., Jankowiak F., et al. Adaptation of hepatic mitochondrial function in humans with non-alcoholic fatty liver is lost in steatohepatitis. Cell. Metab. 2015;21(5):739–746. doi: 10.1016/j.cmet.2015.04.004. - DOI - PubMed

MeSH terms

LinkOut - more resources