. 2025 Aug 14;46(31):3098-3114.
doi: 10.1093/eurheartj/ehaf272.

Spatial transcriptional landscape of human heart failure

Affiliations

Spatial transcriptional landscape of human heart failure

Sang Eun Lee et al. Eur Heart J. .

Abstract

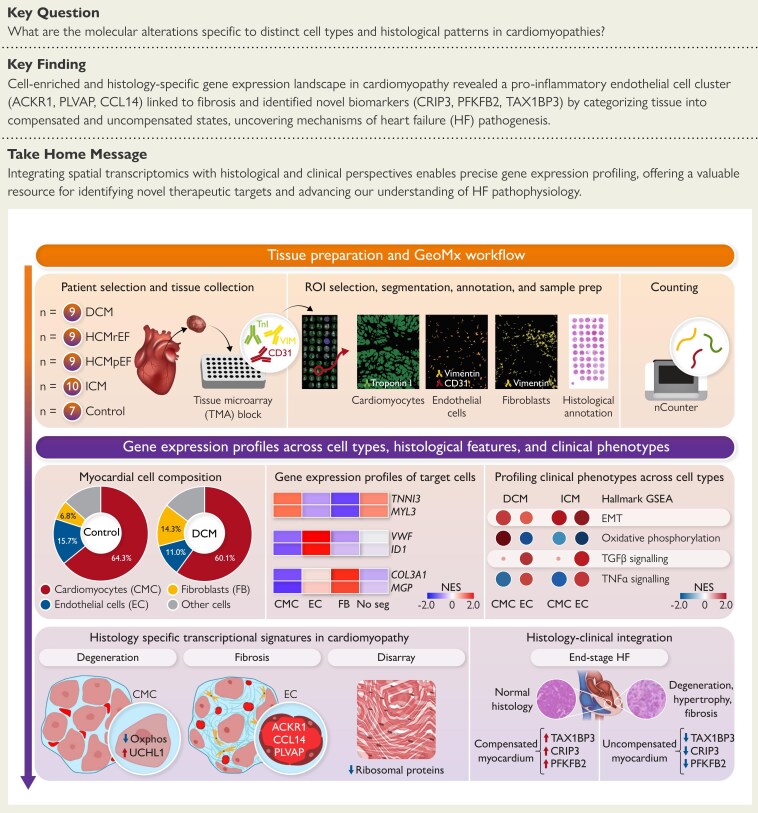
Background and aims: Heart failure (HF) remains a significant clinical challenge due to its diverse aetiologies and complex pathophysiology. The molecular alterations specific to distinct cell types and histological patterns during HF progression are still poorly characterized. This study aimed to explore cell-type- and histology-specific gene expression profiles in cardiomyopathies.

Methods: Ninety tissue cores from 44 participants, encompassing various forms of cardiomyopathy and control samples with diverse histological features, were analysed using the GeoMx Whole Human Transcriptome Atlas. Data on cell types, clinical information, and histological features were integrated to examine gene expression profiles in cardiomyopathy.

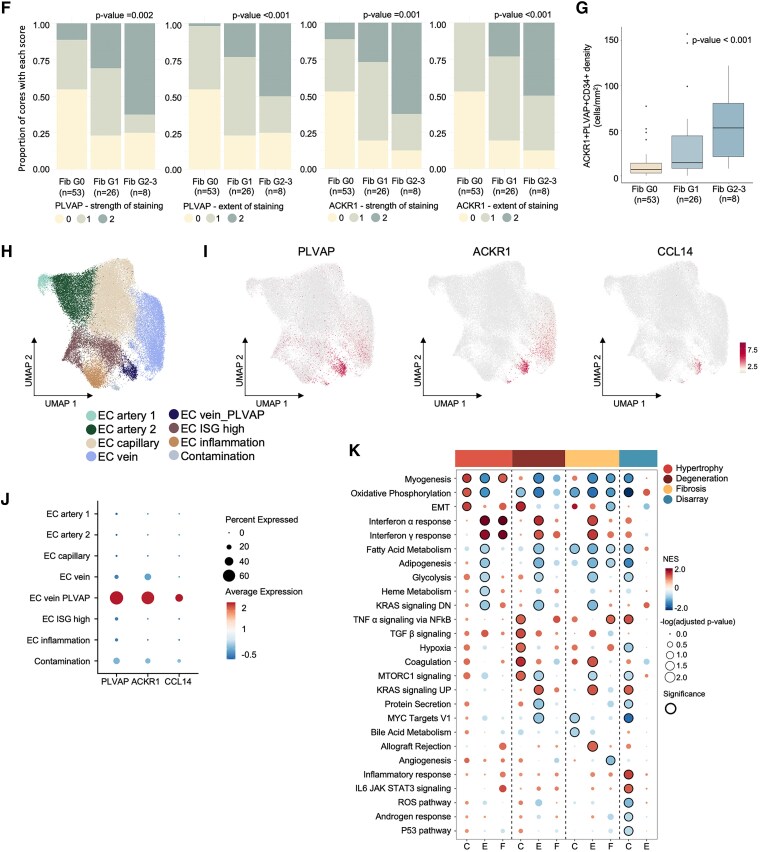
Results: The study characterized the cellular composition of ventricular myocardium and validated the GeoMx platform's efficiency in compartmentalizing specific cell types, demonstrating high accuracy for cardiomyocytes but limitations for endothelial cells and fibroblasts. Differentially expressed genes, including UCHL1 from cardiomyocytes, were associated with degeneration, while CCL14, ACKR1, and PLVAP from endothelial cells were linked to fibrosis. Multiplex immunohistochemistry and integrative analysis of prior sc/snRNA-seq data identified a PLVAP, ACKR1, and CCL14-positive pro-inflammatory endothelial cell subtype linked to fibrosis in HF. Downregulation of ribosomal proteins in cardiomyocytes was associated with myocyte disarray in hypertrophic cardiomyopathy. Additionally, pronounced inflammatory responses were observed in end-stage HF. Combined histological and clinical analysis identified CRIP3, PFKFB2, and TAX1BP3 as novel contributors to HF pathogenesis.

Conclusions: These findings highlight the critical role of cell-enriched and histology-specific transcriptome mapping in understanding the complex pathophysiological landscape of failing hearts, offering molecular insights and potential therapeutic targets for future interventions.

Keywords: Cardiomyocytes; Cardiomyopathy; Degeneration; Endothelial cells; Fibrosis; Heart failure; Inflammation; Myocyte disarray; Spatial transcriptomics.


Figures

Structured Graphical Abstract
Figure 1
Figure 1
Profiling of spatial transcriptomes in human cardiomyopathy (A). Schematic Figures depicting the experimental process: 1. Patient selection and tissue preparation: Selection of patients, tissue harvest, selecting cores based on histology, preparation of tissue microarray (TMA) blocks, and slicing the TMA blocks for experiments. 2. Marker staining and probe hybridization: Staining of markers for target cells (antibodies against Troponin I (TnI), CD31, and Vimentin (VIM)) and probe hybridization. 3. Region of interest (ROI) selection and segmentation: An example of selecting ROIs based on paired H&E staining, and segmentation of areas of interest (AOIs) of target cells based on immunofluorescence staining. The boxes indicate the ROIs. 4. Counting: Execution of the GeoMx Digital Spatial Profiling experiment to yield count data. 5. Quality Control and Data Analysis: From quality control to downstream analysis. (B) Bar graphs showing the normalized counts per million of transcripts for each gene in AOIs classified by cardiomyocytes (CMC), endothelial cells (EC), fibroblasts (FB), and non-segmented ROIs (No_Seg). Total sample number is 178. Detailed number of AOIs per cell-type or non-segmented ROI is described in Table 2. DCM, dilated cardiomyopathy; ICM, ischaemic cardiomyopathy; HCMpEF, hypertrophic cardiomyopathy with preserved ejection fraction; HCMrEF, hypertrophic cardiomyopathy with reduced ejection fraction)
Figure 2
Figure 2
Overview of gene expression profiles according to cell types (A). Three-dimensional principal component analysis (PCA) plot showing the distribution of segments across the first three principal components (PC1, PC2, and PC3), annotated by cell types. (B) Uniform manifold approximation and projection (UMAP) representation of each segment (area of interest, AOI) and non-segmented ROI, coloured by cell types. (C) Heatmap illustrating the correlation between log count per million from our data and averaged expression values from single-nucleus RNA sequencing (snRNA-seq) data of heart tissue by Koenig et al., for differentially expressed genes (DEGs) identified in the snRNA-seq analysis. (D) Bar plot showing the proportion of cell types in each segment, calculated by spatial deconvolution (E). Donut plot depicting the average proportion of cell types in different types of segments, calculated by spatial deconvolution. (F, G). Heatmap demonstrating expressions of curated marker genes from the literature (F) and the top four genes with the highest log fold change (logFC) from DEGs comparing each segment to the others in each segment and non-segmented ROI (G). The colour represents the z-score. (H) Dot plots representing the normalized enrichment score (NES) of gene ontology biological processes (GOBP) for each cell type. Dot size indicates the -log10 (adjusted P-value, Benjamini–Hochberg FDR), and the colour reflects the NES score from gene set enrichment analysis (GSEA). The total number of samples is 157, with CMC: 83, EC: 45, FB: 13, and No_Seg: 16, excluding 8 small ROIs and 13 outliers on the PCA plot. CMC, cardiomyocytes; EC, endothelial cells; FB, fibroblasts; No_Seg, non-segmented ROIs. The number of samples from Koenig’s data is 38, and the total number of nuclei included in this analysis is 203 333
Figure 3
Figure 3
Cell type-dependent regulation of gene expression profiles in cardiomyopathies (A). Bar plots depicting the number of differentially expressed genes (DEGs) for each pairwise comparison among cardiomyopathies and control, categorized by cell type (cardiomyocytes on the left, endothelial cells on the right). For each comparison, bars on the left indicate genes significantly up-regulated in the first group, and bars on the right indicate genes significantly up-regulated in the second group. The colour of each bar corresponds to a specific clinical phenotype (see legend), and the height represents the total count of significantly up-regulated genes. (B) Heatmap showing the top and bottom 20 DEGs between each cardiomyopathy and control, clustered by cell type and disease presence (the sample numbers are in parentheses). (C) Dot plots depicting Hallmark gene set enrichment for differential expression between each cardiomyopathy vs control in cardiomyocytes (C) and endothelial cells (E). The size of the dots indicates the -log10 (adjusted P-value, Benjamini–Hochberg FDR), and the colour reflects the NES score from gene set enrichment analysis (GSEA). (D-E). Volcano plot displaying the log fold change (logFC) and two-sided P-value from the differential expression analysis between HCMrEF and HCMpEF in cardiomyocyte segments (D) and in endothelial cell segments (E). (F, G). Bar plot depicting Hallmark gene set enrichment for differential expression between HCMrEF and HCMpEF in cardiomyocyte segments (F) and endothelial cell segments (G). The x-axis indicates the NES from GSEA. Green and blue bars represent gene sets activated in HCMrEF and HCMpEF, respectively, with a Benjamini–Hochberg FDR P-value < .05. Pathways with a Benjamini–Hochberg FDR > 0.05 are coloured in grey. DCM, dilated cardiomyopathy; ICM, ischaemic cardiomyopathy; HCMpEF, hypertrophic cardiomyopathy with preserved ejection fraction; HCMrEF, hypertrophic cardiomyopathy with reduced ejection fraction. The number of samples used in the DEG analysis for cardiomyocytes are as follows: control (7), DCM (13–14), ICM (16), HCMrEF (11–13), and HCMpEF (18). For endothelial cells, the numbers are as follows: control (6), DCM (8–10), ICM (7), HCMrEF (6–8), and HCMpEF (10). The number of samples varies in the same group due to the outlier selection process for each comparison, and the detailed number of samples used in each comparison is described in Supplementary data online, Table S19)
Figure 4
Figure 4
Spatial gene expression landscape differences by histology (A). Examples of H&E staining showing typical histological features in cardiomyopathy, including control, hypertrophy, degeneration, fibrosis, HCM without disarray, and HCM with disarray. (B) Bar plot depicting the number of differentially expressed genes (DEGs) from the comparison between grades 0 and 1 vs grades 2 and 3 of each histology (grade 0 vs 1–2 in disarray) in cardiomyocyte, endothelial, and fibroblast segments. The height of each bar represents the number of positive DEGs for each condition. (C) Scatter plots displaying the log fold change (logFC) in either cardiomyocyte segmentation (x-axis) or endothelial segmentation (y-axis) from the DEGs between grade 0 and 1 vs grade 2 and 3 of each histology (grade 0 vs 1–2 in disarray). The size of dots indicates the two-sided P-value, categorized into three groups based on thresholds of 0.05 and 0.01. Dot colours represent the direction of changes: red indicates genes up-regulated in CMC, blue indicates genes down-regulated in CMC, orange indicates genes up-regulated in EC, and green indicates genes down-regulated in EC. (D) Examples of immunohistochemistry staining of tissue microarray (TMA) blocks with ACKR1, and PLVAP. (E) Examples of multiplex immunohistochemistry staining of TMA blocks with CD34, ACKR1, PLVAP, and nuclei marker DAPI. (F) Bar graphs of PLVAP and ACKR1 staining scores (staining strength and extent respectively) according to fibrosis grades. P-values are from χ2 test and total number of cores included in analysis is 87. The sample numbers are indicated in parentheses. (G) Boxplot representing density of cells co-expressing CD34, ACKR1, and PLVAP, stratified by fibrosis grade. Statistical analyses were performed using a one-way ANOVA test. The sample numbers are indicated in parentheses. (H) Uniform manifold approximation and projection (UMAP) representation of sub-clustered endothelial cells from single-cell/single-nucleus RNA sequencing data of heart tissue by Koenig et al. (I) UMAP plots showing the normalized expression of fibrosis-associated genes (PLVAP, ACKR1, and CCL14) in endothelial cells. (J) Dot plot demonstrating the specific expression of PLVAP, ACKR1, and CCL14 in the EC vein PLVAP subcluster. (K) Dot plots depicting Hallmark gene set enrichment for differential expression between grade 0 and 1 vs grade 2 and 3 of each histology (grade 0 vs 1–2 in disarray) in cardiomyocytes (C), endothelial cells (E) and fibroblast (F) segments. The size of the dots indicates the -log10 (adjusted P-value, Benjamini–Hochberg FDR), and the colour reflects the normalized enrichment score (NES) from gene set enrichment analysis (GSEA). H&E, Hematoxylin and Eosin; ROI, regions of interest; CMC, cardiomyocytes; EC, endothelial cells; PLVAP, plasmalemma vesicle-associated protein; ACKR1, atypical chemokine receptor 1; ANOVA, analysis of variance. The number of samples used in the comparisons of DEGs for cardiomyocytes is: hypertrophy (62 vs 6), degeneration (40 vs 20), fibrosis (60 vs 8), and disarray (8 vs 9). For endothelial cells: hypertrophy (35 vs 4), degeneration (27 vs 12), fibrosis (32 vs 7), and disarray (5 vs 4). For fibroblasts: hypertrophy (9 vs 2), degeneration (5 vs 6), and fibrosis (6 vs 5). Detailed numbers of samples used in each comparison are described in Supplementary data online, Table S19. The number of samples from Koenig’s data is 45 and the total number of cells/nuclei included is 49 382
Figure 4
Figure 4
Spatial gene expression landscape differences by histology (A). Examples of H&E staining showing typical histological features in cardiomyopathy, including control, hypertrophy, degeneration, fibrosis, HCM without disarray, and HCM with disarray. (B) Bar plot depicting the number of differentially expressed genes (DEGs) from the comparison between grades 0 and 1 vs grades 2 and 3 of each histology (grade 0 vs 1–2 in disarray) in cardiomyocyte, endothelial, and fibroblast segments. The height of each bar represents the number of positive DEGs for each condition. (C) Scatter plots displaying the log fold change (logFC) in either cardiomyocyte segmentation (x-axis) or endothelial segmentation (y-axis) from the DEGs between grade 0 and 1 vs grade 2 and 3 of each histology (grade 0 vs 1–2 in disarray). The size of dots indicates the two-sided P-value, categorized into three groups based on thresholds of 0.05 and 0.01. Dot colours represent the direction of changes: red indicates genes up-regulated in CMC, blue indicates genes down-regulated in CMC, orange indicates genes up-regulated in EC, and green indicates genes down-regulated in EC. (D) Examples of immunohistochemistry staining of tissue microarray (TMA) blocks with ACKR1, and PLVAP. (E) Examples of multiplex immunohistochemistry staining of TMA blocks with CD34, ACKR1, PLVAP, and nuclei marker DAPI. (F) Bar graphs of PLVAP and ACKR1 staining scores (staining strength and extent respectively) according to fibrosis grades. P-values are from χ2 test and total number of cores included in analysis is 87. The sample numbers are indicated in parentheses. (G) Boxplot representing density of cells co-expressing CD34, ACKR1, and PLVAP, stratified by fibrosis grade. Statistical analyses were performed using a one-way ANOVA test. The sample numbers are indicated in parentheses. (H) Uniform manifold approximation and projection (UMAP) representation of sub-clustered endothelial cells from single-cell/single-nucleus RNA sequencing data of heart tissue by Koenig et al. (I) UMAP plots showing the normalized expression of fibrosis-associated genes (PLVAP, ACKR1, and CCL14) in endothelial cells. (J) Dot plot demonstrating the specific expression of PLVAP, ACKR1, and CCL14 in the EC vein PLVAP subcluster. (K) Dot plots depicting Hallmark gene set enrichment for differential expression between grade 0 and 1 vs grade 2 and 3 of each histology (grade 0 vs 1–2 in disarray) in cardiomyocytes (C), endothelial cells (E) and fibroblast (F) segments. The size of the dots indicates the -log10 (adjusted P-value, Benjamini–Hochberg FDR), and the colour reflects the normalized enrichment score (NES) from gene set enrichment analysis (GSEA). H&E, Hematoxylin and Eosin; ROI, regions of interest; CMC, cardiomyocytes; EC, endothelial cells; PLVAP, plasmalemma vesicle-associated protein; ACKR1, atypical chemokine receptor 1; ANOVA, analysis of variance. The number of samples used in the comparisons of DEGs for cardiomyocytes is: hypertrophy (62 vs 6), degeneration (40 vs 20), fibrosis (60 vs 8), and disarray (8 vs 9). For endothelial cells: hypertrophy (35 vs 4), degeneration (27 vs 12), fibrosis (32 vs 7), and disarray (5 vs 4). For fibroblasts: hypertrophy (9 vs 2), degeneration (5 vs 6), and fibrosis (6 vs 5). Detailed numbers of samples used in each comparison are described in Supplementary data online, Table S19. The number of samples from Koenig’s data is 45 and the total number of cells/nuclei included is 49 382
Figure 5
Figure 5
Transcriptional landscape of cardiomyopathy progression integrating clinical and histologic features (A). An example of the region of interest with normal (left) and abnormal histology (right) from the same patient. (B) Schematic Figure illustrating four groups for comparison: tissues with normal histology from control group (Control_Clin, green), tissues with normal histology from cardiomyopathy patients (Control_His, orange), tissues with abnormal histology from non-end-stage HF patients (Diseased_NES, purple), and end-stage HF (Diseased_ES, pink). (C) Bar graphs depicting the expression levels of NPPA and NPPB in each group. (D) Volcano plots displaying the log fold change (logFC) (x-axis) and two-sided P-value (y-axis) from the differential expression analysis in the comparison across different groups of cardiomyocyte segmentation. The colour of the dots corresponds to the groups defined in (B), indicating genes that are significantly increased in each group. (E) Dot plots depicting the Hallmark gene set for differential expression across the groups of cardiomyocyte segmentation. The size of the dots indicates the -log10 (adjusted P-value, Benjamini–Hochberg FDR), and the colour reflects the NES score from gene set enrichment analysis (GSEA). (The number of samples in each group for cardiomyocytes is as follows: Control_Clin (7), Control_His (9), Diseased_ES (38), and Diseased_NES (15))

Similar articles

References

    1. Heidenreich PA, Bozkurt B, Aguilar D, Allen LA, Byun JJ, Colvin MM, et al. 2022 AHA/ACC/HFSA guideline for the management of heart failure: a report of the American College of Cardiology/American Heart Association Joint Committee on Clinical Practice Guidelines. Circulation 2022;145:E895–E1032. 10.1161/CIR.0000000000001063 - DOI - PubMed
    1. Burnett H, Earley A, Voors AA, Senni M, McMurray JJV, Deschaseaux C, et al. Thirty years of evidence on the efficacy of drug treatments for chronic heart failure with reduced ejection fraction: a network meta-analysis. Circ Heart Fail 2017;10:e003529. 10.1161/CIRCHEARTFAILURE.116.003529/-/DC1 - DOI - PMC - PubMed
    1. Lippi G, Sanchis-Gomar F. Global epidemiology and future trends of heart failure. AME Med J 2020;5:15. 10.21037/AMJ.2020.03.03 - DOI
    1. Tsao CW, Aday AW, Almarzooq ZI, Alonso A, Beaton AZ, Bittencourt MS, et al. Heart disease and stroke statistics—2022 update: a report from the American Heart Association. Circulation 2022;145:e153–639. 10.1161/CIR.0000000000001052 - DOI - PubMed
    1. Emmons-Bell S, Johnson C, Roth G. Prevalence, incidence and survival of heart failure: a systematic review. Heart 2022;108:1351–60. 10.1136/heartjnl-2021-320131 - DOI - PMC - PubMed