. 2025 Jul:117:105734.
doi: 10.1016/j.ebiom.2025.105734. Epub 2025 May 6.

Pharmacological inhibition of tyrosine protein-kinase 2 reduces islet inflammation and delays type 1 diabetes onset in mice

Affiliations

Pharmacological inhibition of tyrosine protein-kinase 2 reduces islet inflammation and delays type 1 diabetes onset in mice

Farooq Syed et al. EBioMedicine. 2025 Jul.

Abstract

Background: Tyrosine protein-kinase 2 (TYK2) mediates inflammatory signalling through multiple cytokines, including interferon-α (IFNα), interleukin (IL)-12, and IL-23. TYK2 missense mutations protect against type 1 diabetes (T1D), and inhibition of TYK2 shows promise in other autoimmune conditions.

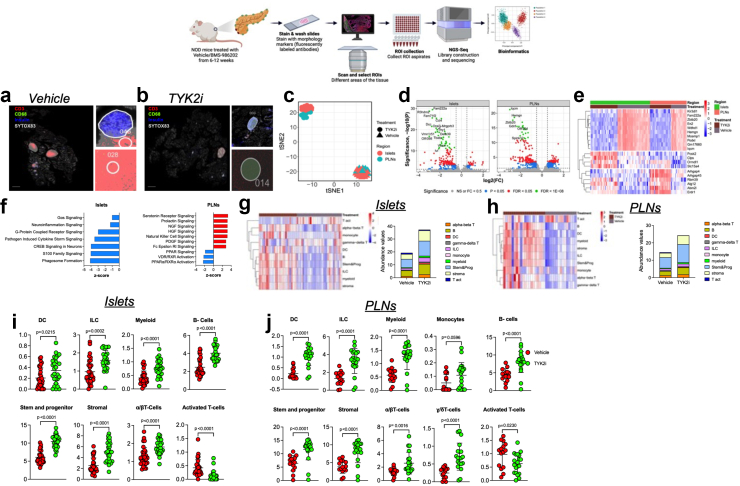
Methods: We evaluated the effects of specific TYK2 inhibitors (TYK2is) in pre-clinical models of T1D, including human β cells, cadaveric islets, iPSC-derived islets, and mouse models.

Findings: In vitro studies showed that TYK2is prevented IFNα-induced β cell HLA class I up-regulation, endoplasmic reticulum stress, and chemokine production. In co-culture studies, pre-treatment of β cells with TYK2i prevented IFNα-induced antigenic peptide presentation and alloreactive and autoreactive T cell degranulation. In vivo administration of BMS-986202 in two mouse models of T1D (RIP-LCMV-GP and NOD mice) reduced systemic and tissue-localised inflammation, prevented β cell death, and delayed T1D onset. Transcriptional phenotyping of pancreatic islets, pancreatic lymph nodes, and spleen highlighted a role for TYK2 inhibition in modulating signalling pathways associated with inflammation, translational control, stress signalling, secretory function, immunity, and diabetes. Additionally, TYK2i treatment changed the composition of innate and adaptive immune cell populations in the blood and disease target tissues.

Interpretation: These findings indicate that TYK2i has beneficial effects on both the immune and endocrine compartments in models of T1D, thus supporting a path forward for testing TYK2is in human T1D.

Funding: This work was supported by the National Institutes of Health (NIH), Veteran Affairs (VA), Breakthrough T1D, and gifts from the Sigma Beta Sorority, the Ball Brothers Foundation, and the George and Frances Ball Foundation.

Keywords: Interferon-α; Islets of langerhans; T cell; Type 1 diabetes; Tyrosine protein-kinase 2 (TYK2); β cell.


Conflict of interest statement

Declaration of interests CEM has received grants from Lilly Pharmaceuticals and Astellas Pharmaceuticals (not related to this manuscript). CEM has served on advisory boards related to T1D research clinical trial initiatives: Isla Technologies, Neurodon, and DiogenX. CEM has patent (16/291,668) Extracellular Vesicle Ribonucleic Acid (RNA) Cargo as a Biomarker of Hyperglycaemia and Type 1 Diabetes and CEM and FS have a provisional patent (63/285,765) Biomarker for Type 1 Diabetes (PDIA1 as a biomarker of β cell stress). DLE serves on the advisory board of InSphero, related to the preparation of islet microtissues. EMV received grant from Fonds de la Recherche. JSK has received grants from NIDDK—U24DK104162, R21DK127285 and grants from (Breakthrough T1D–5-SRA-2018-557-Q-R) and Helmsley Charitable Trust–2018 PG-T1D053 and G-2108-04793). JSK received support to attend NIDDK study section, as well as to attend the NIDDK sponsored AI meeting October 2024. SAW is employed by Eli Lilly and owns stocks in the company and was supported by the company to attend a conference. SAW is a board member of Breakthrough T1D. FS received honoria and a travel award to present current work at ADA conference. These activities have not dealt directly with topics covered in this manuscript.

Figures

Fig. 1
Fig. 1
TYK2 inhibitors repress IFNα signalling and inflammatory gene expression and reduce β cell immunogenicity. Dispersed human islet cells were allowed to rest in culture for two days before pre-treatment for 2 h with the indicated concentrations (expressed in mM) of TYK2i BMS-986165. Treatment was continued with BMS-986165 in the absence or presence of IFNα (2000 U/mL), IFNα (2000 U/mL) + TNFα (1000 U/ml), or IFNα (2000 U/mL) + IL-1β (50 U/mL) for 24 h. (a–f) Western blotting of protein lysates was performed to detect phospho-STAT1/2. Data were normalised to the levels of β-actin and expressed relative to treatment with IFNα alone. (g) Apoptotic cells were identified by Hoechst 33342 and propidium iodide staining. (h–l) Total RNA was extracted and mRNA levels of (h) DDIT3 (CHOP), (i) ATF3, (j) CXCL10, (k) MX1, and (l) HLA-ABC were analysed by RT-qPCR. (m) Schematic representation of the experimental workflow on EndoC-βH1/HLA-A2 cells co-cultured either with HLA-A2 alloreactive or autoreactive CD8+ T cell clones directed against insulin defective ribosomal product and/or preproinsulin specific T cells. (n) RT-qPCR analysis showing B2M expression in EndoC-BH1/HLA-A2 cells upon IFNα treatment (2000 U/mL) in the presence or absence of 1 uM BMS-986165. (o) Surface expression of HLA-ABC and (p) HLA-A2 in EndoC-βH1/HLA-A2 cells prior to co-culture. Cells were exposed to IFNɑ in the presence or absence of BMS-986165 for 24 h. T cell activation assay (MIP-1β release) after co-culture with (q) A2 alloreactive T cells, (r) autoreactive T cells directed against insulin defective ribosomal product, or (s) preproinsulin specific T cells. For RT-qPCR analysis, expression data were normalised by the geometric mean of GAPDH and ACTB expression levels and expressed relative to cells exposed to IFNα alone. Statistical analyses for human islet studies (n = 3–7) were conducted using one-way ANOVA with multiple comparisons between treatment groups. Co-culture experiments were performed with independent biological replicates (n = 3). An unpaired t-test (with or without Welch's correction) was applied to evaluate the expression of surface proteins (panels n, o, and p), while one-way ANOVA with multiple comparisons was used to analyse differences between treatment conditions (all remaining panels excluding a, d, and m). All data are presented as the mean with 95% confidence intervals (CI).
Fig. 2
Fig. 2
TYK2 inhibition reduces the onset of diabetes in the RIP-LCMV-GP mouse model of T1D. (a) Male RIP-LCMV-GP mice were inoculated at 8 weeks of age with LCMV stock (0.5 × 10⁵ PFU I.P., Armstrong strain), and blood glucose levels were measured pre-inoculation (Pre) and on days 1, 4, 7, 11, and 14 post-inoculation. Mice were pre-treated with either vehicle or TYK2i BMS-986202 (30 mg/kg/day) for 2 days prior to inoculation, and treatment continued until the study end on day 14. n = 18 mice/group. Vehicle- and TYK2i-treated groups are shown in grey and red symbols or bars, respectively. (b) Kaplan–Meier diabetes incidence plot for vehicle- and TYK2i-treated groups. (c) Blood glucose levels of vehicle- and TYK2i-treated mice. All blood glucose data are presented as mean with 95% CI, with individual data points represented: significant differences determined by Log-rank (Mantel–Cox) test.
Fig. 3
Fig. 3
TYK2i treatment preserves pancreatic β cells and inhibits the expression of IFNα-induced mRNAs in RIP-LCMV-GP mice. Pancreas tissue was harvested from vehicle- and TYK2i-treated RIP-LCMV-GP mice on days 3, 7, and 14 post-inoculation. Single-molecule fluorescence in situ hybridisation (smFISH) detecting Cd274, Mx1, Cxcl10, and Stat1 was performed in combination with co-staining of insulin protein and DAPI for nuclear labelling. mRNA expression in individual insulin-positive β cells was quantified following an established pipeline (details are provided in Methods). (a–c) Histogram showing the cellular insulin intensity from the pancreatic tissue sections of vehicle (red plot lines) and TYK2i-treated mice (grey plot lines) on days 3, 7, and 14. (de) Representative smFISH images of Cd274, Mx1, Cxcl10, and Stat1 in mouse pancreatic islets on day 3 (d), 7 (g), and 14 (j). Islet regions are delineated, and the merged smFISH images are shown along with a designated square region of expanded magnification (far right images). (e, h, k) Quantitation of mRNA copy number in a single β cell of a pancreatic islet on days 3, 7, and 14. (f, i, l) Spatial analysis of RNA localisation between nuclear and cytoplasmic subcellular compartments. Individual β cell measurements of RNA copies and RNA localisation data are expressed as mean ± SD with an indication of significant differences, n = 5–7 mice were studied per condition and 4–10 islets were randomly selected from each section; statistical significance was determined by a Mann–Whitney U test.
Fig. 4
Fig. 4
TYK2 inhibition reshapes innate and adaptive immunity in blood, spleen, and PLN of RIP-LCMV-GP mice. Peripheral blood mononuclear cells (PBMCs), splenocytes, and immune cells from PLN were isolated and labelled with CD11b+MHCII+CD11c+ (dendritic cells, DCs), CD11b+MHCII+F4/80+ (macrophages), CD11b+CD49+ (mature NK cells), and CD11b+CD49- (immature NK cells). Immune cell characterisation was performed using flow cytometry. (ac) Percentage of DCs, macrophages, mature NK cells, and immature NK cells from 3, 7, and 14-days post-inoculation from vehicle (grey) and TYK2i-treated (red) RIP-LCMV-GP mice. (d–f) Percentage of CD4+FoxP3+CD25+ Tregs, CD4+PD1+ T cells, and CD8+PD1+ T cells from 3, 7, and 14-days post-inoculation from vehicle (grey) and TYK2i-treated (red) RIP-LCMV-GP mice. Data are presented as mean with 95% CI, and individual data points are included, n = 3–5 mice per condition; Statistical significance was determined by a Mann–Whitney U test.
Fig. 5
Fig. 5
TYK2 inhibition mitigates diabetes onset and IFNɑ responses in female NOD mice. (a) Six-week-old female NOD mice were treated with vehicle or TYK2i (BMS986202, 30 mg/kg) by oral gavage once daily for six weeks and monitored for diabetes onset (n = 34 vehicle/32 TYK2i). A separate cohort of NOD mice (n = 9 per study condition) was sacrificed at the end of TYK2i dosing (12 weeks of age) for tissue analysis. Blood glucose levels were measured weekly from 6 weeks until diabetes conversion (14 weeks) and biweekly until the end of the study time point. Diabetes was defined as blood glucose levels of ≥250 mg/dL in two consecutive measurements. (b–c) Representative images of insulin immunohistochemistry and insulitis scoring (mean with 95% CI). The stacked bars represent the percentage of different grades of immune cell infiltration across vehicle- and TYK2i-treated NOD mice. (d) Kaplan–Meier diabetes incidence plot. (e) Blood glucose levels. Vehicle-treated mice are indicated in grey bars and TYK2i-treated mice are represented by red bars. (f) Quantification of insulin expression in pancreatic β cells. (g) Representative images of smFISH for Cd274, Cxcl10, Stat1, and Mx1. Islet regions are delineated, and the merged smFISH images are included along with a designated square region of expanded magnification (far right images). (h) Quantitation of mRNA copy numbers of Cd274, Cxcl10, Stat1, and Mx1 in β cells. (i) Spatial analysis of RNA localisation between nuclear and cytoplasmic cellular compartments. For diabetes incidence studies, statistical analysis was performed by Log-rank (Mantel–Cox) test for the Kaplan–Meier plot. Wilcoxon rank sum tests were used to determine the effect of TYK2 inhibition on immune cell infiltration presented as an insulitis score. For smFISH, individual β cell measurements of RNA copy are presented, RNA localisation data are expressed as mean ± SD, and the Mann–Whitney U test was used to determine statistical differences.
Fig. 6
Fig. 6
TYK2 inhibition alters spatial transcriptome profiles in islets, PLN, and spleen of RIP-LCMV-GP mice. Tissues were harvested from vehicle- and TYK2i-treated RIP-LCMV-GP mice on days 3 and 7 post-inoculation. (a–b) Representative images of the islets, PLN, and spleen stained for CD3 (red), CD68 (green), insulin (blue), and Sytox83 (grey) nuclear staining. (c) tSNE scatter plot of sample clustering between vehicle- and TYK2i-treated mice at days 3 and 7 post-inoculation in the islets, PLN, and spleen. (d–e) Volcano plots of differentially expressed genes between vehicle- and TYK2i-treated mice at (d) day 3 and (e) day 7 post-inoculation. (f–g) Top 10 differentially expressed genes from each selected ROI of vehicle- and TYK2i-treated mice at (f) day 3 and (g) day 7 post-inoculation. (h–m) Ingenuity pathway analysis showing upregulated (red bar) and downregulated (blue bar) pathways in islets, PLN, and spleen at (h–j) day 3 and (k–m) day 7 post-inoculation. (n–s) Deconvolution analysis of immune cells showing the abundance of different immune cell populations from islets, PLN, and spleen at (n–p) day 3 and (q–s) day 7 post-inoculation. n = 3–4 mice per group. The data in i and j are presented as mean ± SD. A Mann–Whitney U test was used to identify statistical differences.
Fig. 7
Fig. 7
Spatial whole transcriptome analysis reveals diminished inflammatory gene expression in TYK2i-treated islets and PLN of NOD mice. Islets and PLNs were harvested from vehicle- and TYK2i-treated NOD mice at 12 weeks of age. (a–b) Representative images of islets and PLN stained for CD3 (red), CD68 (green), insulin (blue), and Sytox83 (grey; nuclear staining). (c) tSNE scatter plot showing clustering of samples from islets and PLN between vehicle- and TYK2i-treated 12-week-old female NOD mice. (d) Volcano plots showing differentially expressed genes from islets and PLN between vehicle- and TYK2i-treated mice. (e) Top 10 differentially expressed genes from each selected ROI in islets and PLN of mice treated with vehicle or TYK2i. (f) Ingenuity pathway analysis showing upregulated (red bars) and downregulated (blue bars) pathways in islets and PLN of NOD mice. (g–j) Deconvolution analysis of immune cells showing the abundance of different immune cell populations from (g) islets and (h) PLN from NOD mice treated with vehicle or TYK2i; abundance of immune cell populations showing significant differences between vehicle- and TYK2i-treated NOD mice from (i) islets and (j) PLN. n = 3–4 mice/group. Dotplot showing the proportion of cell types present in each ROI identified by spatial deconvolution. A Mann–Whitney U test was used to compare the statistical significance between vehicle- and TYK2i-treated groups.
Fig. 8
Fig. 8
Spatial proteomics uncover immune cell dynamics in TYK2i-treated RIP-LCMV-GP and NOD mouse models. Tissues were harvested from vehicle- and TYK2i-treated RIP-LCMV-GP mice on day 7 post-inoculation. (a) Schematic representation of GeoMx-DSP proteomics experimental workflow from RIP-LCMV-GP mice. (b) Representative images of islets, PLN, and spleen labelled for CD3 (red), PTPRC (yellow), insulin (blue), and Sytox83 (grey). (c–e) Heatmap showing the overall expression of immune cell typing and immune cell activation makers from selected ROIs in (c) islets, (d) PLN, and (e) spleen. (f–h) Markers that show a significant difference between vehicle- and TYK2i-treated mice in (f) islets, (g) PLN, and (h) spleen. (i) Schematic representation of GeoMx-DSP proteomics experimental workflow for tissues from NOD mice. (j) Representative images of islets and PLN labelled for CD3 (red), PTPRC (yellow), insulin (blue), and Sytox83 (grey). (k–l) Heatmap showing the overall expression of immune cell typing and immune cell activation markers from selected ROIs in (k) islets and (l) PLN. (m, n) Markers that showed significant differences between vehicle- and TYK2i-treated mice from (m) islets and (n) PLN; n = 4 mice/group for RIP-LCMV-GP mice and n = 3–4 for NOD mice per group. Data were normalised to the geometric mean of the IgG negative control, and the significantly differently expressed proteins were presented as Log2 of signal-to-noise ratio (SNR). Differences between groups were determined by Mann–Whitney U tests, and the data are presented as mean ± SD.

Update of

References

    1. Ivashkiv L.B., Donlin L.T. Regulation of type I interferon responses. Nat Rev Immunol. 2014;14(1):36–49. - PMC - PubMed
    1. Platanias L.C. Mechanisms of type-I- and type-II-interferon-mediated signalling. Nat Rev Immunol. 2005;5(5):375–386. - PubMed
    1. Nyaga D.M., Vickers M.H., Jefferies C., Perry J.K., O'Sullivan J.M. Type 1 diabetes mellitus-associated genetic variants contribute to overlapping immune regulatory networks. Front Genet. 2018;9 https://www.frontiersin.org/articles/10.3389/fgene.2018.00535 [cited 2023 Aug 12]. Available from: - DOI - PMC - PubMed
    1. Tao J.H., Zou Y.F., Feng X.L., et al. Meta-analysis of TYK2 gene polymorphisms association with susceptibility to autoimmune and inflammatory diseases. Mol Biol Rep. 2011;38(7):4663–4672. - PubMed
    1. Wallace C., Smyth D.J., Maisuria-Armer M., Walker N.M., Todd J.A., Clayton D.G. The imprinted DLK1-MEG3 gene region on chromosome 14q32.2 alters susceptibility to type 1 diabetes. Nat Genet. 2010;42(1):68–71. - PMC - PubMed

MeSH terms