. 2025 May 7;16(1):4234.
doi: 10.1038/s41467-025-59505-8.

MS CETSA deep functional proteomics uncovers DNA repair programs leading to gemcitabine resistance

Affiliations

MS CETSA deep functional proteomics uncovers DNA repair programs leading to gemcitabine resistance

Ying Yu Liang et al. Nat Commun. .

Abstract

Mechanisms for resistance to cytotoxic cancer drugs are dependent on dynamic changes in the biochemistry of cellular pathways, information which is hard to obtain at the systems level. Here we use a deep functional proteomics implementation of the Cellular Thermal Shift Assay to reveal a range of induced biochemical responses to gemcitabine in resistant and sensitive diffuse large B cell lymphoma cell lines. Initial responses in both, gemcitabine resistant and sensitive cells, reflect known targeted effects by gemcitabine on ribonucleotide reductase and DNA damage responses. However, later responses diverge dramatically where sensitive cells show induction of characteristic CETSA signals for early apoptosis, while resistant cells reveal biochemical modulations reflecting transition through a distinct DNA-damage signaling state, including opening of cell cycle checkpoints and induction of translesion DNA synthesis programs, allowing bypass of damaged DNA-adducts. The results also show the induction of a protein ensemble, labeled the Auxiliary DNA Damage Repair, likely supporting DNA replication at damaged sites that can be attenuated in resistant cells by an ATR inhibitor, thus re-establishing gemcitabine sensitivity and demonstrating ATR as a key signaling node of this response.


Conflict of interest statement

Competing interests: P.N. is the inventor of patents related to the CETSA method and is a cofounder and board member of Pelago Biosciences AB. The remaining authors declare no competing interests.

Figures

Fig. 1
Fig. 1. Gemcitabine drug target-engagement in sensitive and resistant cells.
A Structure and thus far known MoA of gemcitabine. B IMPRINTS CETSA experimental workflow. Created in BioRender. Tam, W. (2025) https://BioRender.com/dufluq1. C Interpretation of IMPRINTS CETSA profiles. D IMPRINTS CETSA profiles of RRM1 in two sensitive, OCI-LY3 (orange) and OCI-LY19 (red), and two resistant, HT (dark green) and SUDHL4 (light green), cell lines after 1 h, 3 h, 5 h or 8 h of gemcitabine treatment. Data are presented as mean log2 fold change compared to the reference ±SEM from biological replicates (n = 3). Source data are provided as a Source Data file. E 3 h Isothermal Dose Response (ITDR) of RRM1 in OCI-LY19 (red) and SUDHL4 (green) cells with different doses of gemcitabine and at 52 °C CETSA heating. Data are presented as mean fold change compared to the reference from technical replicates (n = 2). Source data are provided as a Source Data file.
Fig. 2
Fig. 2. Gemcitabine-induced stalled replication fork.
Hypothetical model indicating proteins at the stalled replication fork after gemcitabine-induced DNA damage, and respective IMRPINTS profiles of RPA1, RPA2, RPA3, CHEK1 and DNMT1 in sensitive OCI-LY3 (orange) and OCI-LY19 (red), as well as resistant HT (dark green) and SUDHL4 cells (light green) after 1 h, 3 h, 5 h or 8 h of gemcitabine treatment. Data are presented as mean log2 fold change compared to the reference ±SEM from biological replicates (n = 3). Source data are provided as a Source Data file. Created in BioRender. Tam, W. (2025) https://BioRender.com/6fy4aw8.
Fig. 3
Fig. 3. CETSA responses in gemcitabine sensitive versus resistant cells.
A Venn diagram showing overlap of the hits from sensitive OCI-LY19 (top) and resistant SUDHL4 cells (bottom) with the previously identified CCAE (Core CETSA Apoptosis Ensemble) proteins. B STRING plot showing the overlapping proteins from A with IMPRINTS CETSA profiles for OCI-LY19 (red hues) and SUDHL4 (green hues) after 1 h, 3 h, 5 h and 8 h gemcitabine treatment. Data are presented as mean log2 fold change compared to the reference from biological replicates (n = 3). Source data are provided as a Source Data file. C IMPRINTS profiles of PARP1, MATR3, LMNB1 and DDX21 showing peptides before and after known caspase cleavage sites in sensitive OCI-LY19 cells (red hues) and resistant SUDHL4 cells (green hues) after 1 h, 3 h, 5 h and 8 h gemcitabine treatment. Data are presented as mean log2 fold change compared to the reference ±SEM from biological replicates (n = 3). Source data are provided as a Source Data file. D IMPRINTS profiles of CCNA2, CCNB1, CCNB2 and CDK1 for OCI-LY19 (red hues) and SUDHL4 (green hues) after 1 h, 3 h, 5 h and 8 h gemcitabine treatment. Data are presented as mean log2 fold change compared to the reference ±SEM from biological replicates (n = 3). Source data are provided as a Source Data file. E Progression of cell cycle and distribution of cells in different cell cycle phases in the sensitive OCI-LY19 and resistant SUDHL4 cells after 8 h and 24 h with and without gemcitabine treatment. A two-way ANOVA was performed, and data are presented as relative percentage of cells in each cycle phase ±SEM from biological replicates (n = 4) with p-values denoting significant changes in G1 phase (blue). Source data are provided as a Source Data file.
Fig. 4
Fig. 4. Translesion synthesis in gemcitabine resistant cells.
A Nodes indicating translesion synthesis pathway as a GO term and IMPRINTS profiles of the involved proteins in OCI-LY19 (red hues) and SUDHL4 (green hues) after 1 h, 3 h, 5 h and 8 h gemcitabine treatment. Data are presented as mean log2 fold change compared to the reference ±SEM from biological replicates (n = 3). Source data are provided as a Source Data file. B Representative western blot of PCNA and mono-ubiquitinated PCNA (top) and quantification of ubPCNA/PCNA ratio (bottom) in the sensitive OCI-LY19 (red) and resistant SUDHL4 (green) cells after 6 h of gemcitabine (or vehicle) treatment. A two-way ANOVA was performed comparing vehicle versus gemcitabine treatment, and data are presented as mean ubPCNA to total PCNA ratio ±SEM from biological replicates (n = 3). Source data are provided as a Source Data file. C ZIP Synergy score of gemcitabine and rev7/3-in-1 concentrations in SUDHL4 cells at 48 h. D Hypothetical model of gemcitabine induced translesion synthesis polymerase switch. Created in BioRender. Tam, W. (2025) https://BioRender.com/0i85r9z.
Fig. 5
Fig. 5. ADDR response in gemcitabine resistant cells.
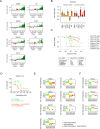
A IMPRINTS profiles of ADDR protein ensemble in OCI-LY19 (red hues) and SUDHL4 (green hues) after 1 h, 3 h, 5 h and 8 h gemcitabine treatment. Data are presented as mean log2 fold change compared to the reference ±SEM from biological replicates (n = 3). Source data are provided as a Source Data file. B Quantification of ADDR proteins in SUDHL4 cells after 6 h treatment with cladribine (orange) and cytarabine (red). Data are presented as mean log2 fold change compared to the reference ±SEM from biological replicates (n = 3). Source data are provided as a Source Data file. C Relative viability and IC50 values of OCI-LY19 (dotted lines) and SUDHL4 (continuous lines) cells after 48 h treatment with increasing concentrations of gemcitabine (green), cisplatin (light blue), cytarabine (red) or cladribine (orange). Data are presented as mean relative viability compared to the reference ±SEM from biological replicates (n = 3). Source data are provided as a Source Data file. D Relative viability of SUDHL4 cells treated for 72 h with increasing concentrations of gemcitabine, either alone (green) or in combination with 1 µM AZD6738 (red). Data are presented as mean relative viability compared to the reference ±SEM from biological replicates (n = 9). Source data are provided as a Source Data file. E IMPRINTS profiles of ADDR protein ensemble in gemcitabine resistant SUDHL4 cells after 6 h of treatment of gemcitabine alone, AZD6738 alone or in combination. Data are presented as mean log2 fold change compared to the reference ±SEM from biological replicates (n = 3). Source data are provided as a Source Data file. F IMPRINTS profiles of POLD1, POLD2, POLD4 in gemcitabine resistant SUDHL4 cells after 6 h of treatment of gemcitabine alone, AZD6738 alone or in combination. Data are presented as mean log2 fold change compared to the reference ±SEM from biological replicates (n = 3). Source data are provided as a Source Data file.
Fig. 6
Fig. 6. Stratification of clinical samples into sensitive and resistant type using MS-CETSA.
A Experimental design for MS-CETSA treatment of patient samples from DLBCL patients. Patient samples were treated with different doses of gemcitabine ex vivo for 5 h. The treated samples were CETSA heated and subjected to mass spectrometry. Created in BioRender. Tam, W. (2025) https://BioRender.com/4myrn1e. B MS-CETSA ITDR profiles of selected CCAE proteins in patient samples (top panel) and sensitive OCI-LY19 (bottom panel) cells. Data are presented as mean log2 fold change compared to the reference from technical replicates (n = 2). Source data are provided as a Source Data file.
Fig. 7
Fig. 7. Gemcitabine-induced cellular responses.
Schematic summary of gemcitabine-induced cellular responses in sensitive (red nodes) versus resistant (green nodes), or both (orange nodes) cells. Dotted line indicates signaling pathway yet to be established in detail. Created in BioRender. Tam, W. (2025) https://BioRender.com/jgju7ac.

Similar articles

References

    1. Doyle, L. A. ustin et al. A multidrug resistance transporter from human MCF-7 breast cancer cells. Proc. Natl Acad. Sci. USA95, 15665–15670 (1998). - PMC - PubMed
    1. Bardenheuer, W. et al. Resistance to cytarabine and gemcitabine and in vitro selection of transduced cells after retroviral expression of cytidine deaminase in human hematopoietic progenitor cells. Leukemia19, 2281–2288 (2005). - PubMed
    1. Pommier, Y., Sordet, O., Antony, S., Hayward, R. L. & Kohn, K. W. Apoptosis defects and chemotherapy resistance: molecular interaction maps and networks. Oncogene23, 2934–2949 (2004). - PubMed
    1. Kobayashi, S. et al. EGFR Mutation and Resistance of Non–Small-Cell Lung Cancer to Gefitinib. N. Engl. J. Med.352, 786–792 (2005). - PubMed
    1. Engelman, J. A. et al. MET amplification leads to gefitinib resistance in lung cancer by activating ERBB3 signaling. Science316, 1039–1043 (2007). - PubMed

MeSH terms

LinkOut - more resources