. 2025 May 7;16(1):4228.
doi: 10.1038/s41467-025-59341-w.

Mature tertiary lymphoid structures evoke intra-tumoral T and B cell responses via progenitor exhausted CD4+ T cells in head and neck cancer

Affiliations

Mature tertiary lymphoid structures evoke intra-tumoral T and B cell responses via progenitor exhausted CD4+ T cells in head and neck cancer

Hao Li et al. Nat Commun. .

Abstract

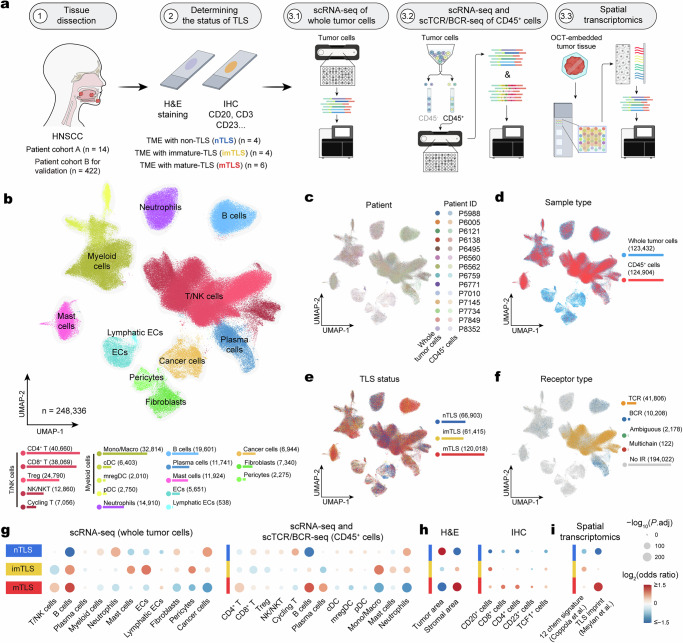
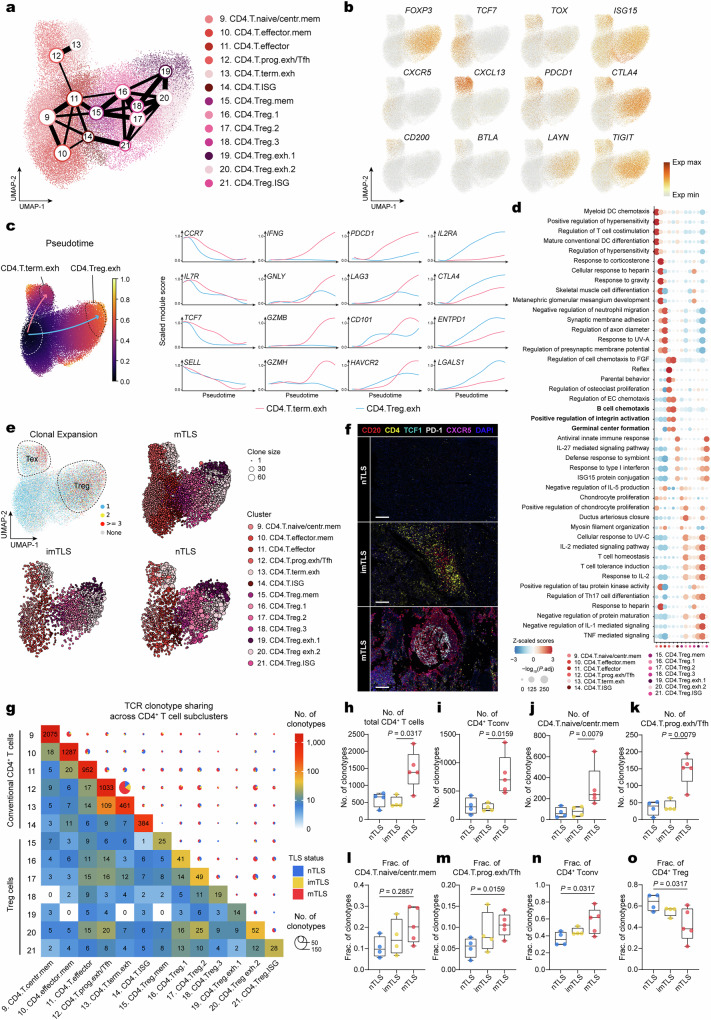
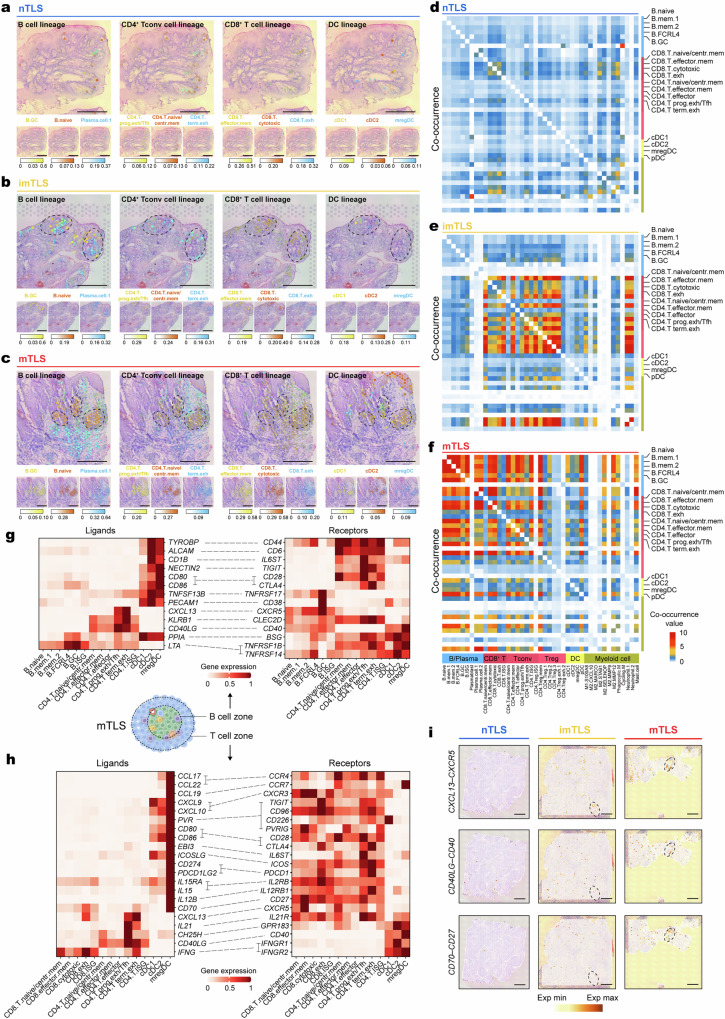
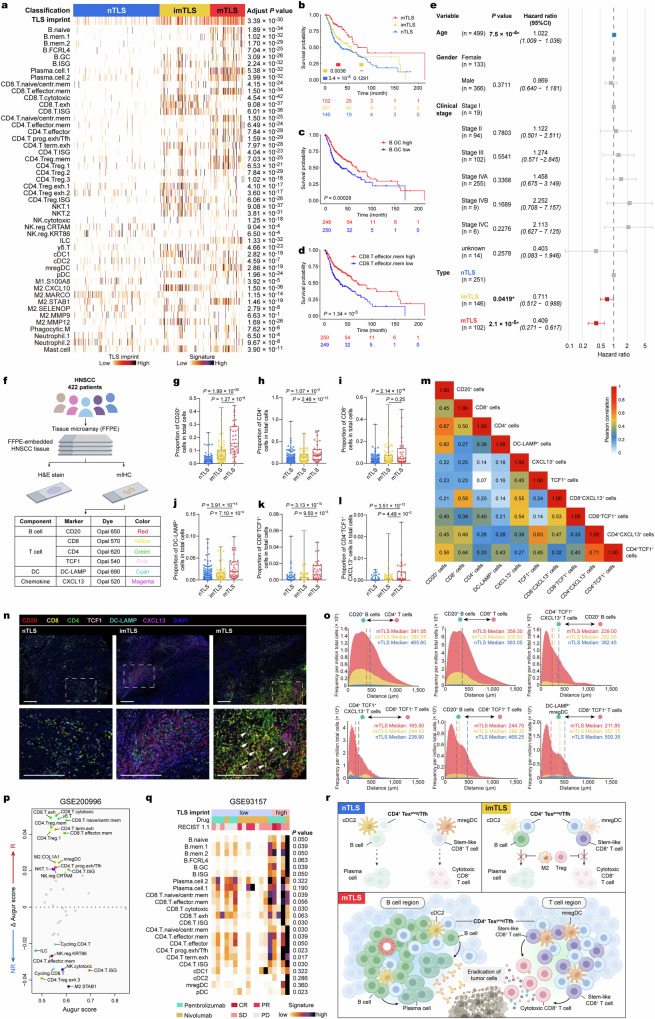
Tumor tertiary lymphoid structures (TLS), especially mature TLS (mTLS), have been associated with better prognosis and improved responses to immune checkpoint blockade (ICB), but the underlying mechanisms remain incompletely understood. Here, by performing single-cell RNA, antigen receptor sequencing and spatial transcriptomics on tumor tissue from head and neck squamous cell carcinoma (HNSCC) patients with different statuses of TLS, we observe that mTLS are enriched with stem-like T cells, and B cells at various maturation stages. Notably, progenitor exhausted CD4+ T cells, with features resembling follicular helper T cells, support these responses, by activating B cells to produce plasma cells in the germinal center, and interacting with DC-LAMP+ dendritic cells to support CD8+ T cell activation. Conversely, non-mTLS tumors do not promote local anti-tumor immunity which is abundant of immunosuppressive cells or a lack of stem-like B and T cells. Furthermore, patients with mTLS manifest improved overall survival and response to ICB compared to those with non-mTLS. Overall, our study provides insights into mechanisms underlying mTLS-mediated intra-tumoral immunity events against cancer.


Conflict of interest statement

Competing interests: The authors declare no competing interests.

Figures

Fig. 1
Fig. 1. TLS-associated immune landscape in HNSCC.
a Workflow shows the collection and processing of fresh samples of primary oral cavity HNSCC tumors for scRNA-seq, scTCR/BCR-seq, and spatial transcriptomics repertoire analysis. The collection of fresh tumor samples from HNSCC patients (n = 14 independent samples) was used to identify the status of TLS by IHC staining and classified into nTLS (n = 4 independent samples), imTLS (n = 4 independent samples), and mTLS (n = 6 independent samples). Subsequently, the fresh tumor sample was divided into three parts and subjected to different processes, including: (1) scRNA-seq of whole tumor cells; (2) MACS targeting CD45+ cells in tumor, followed by paired scRNA-seq and scTCR/BCR-seq; and (3) spatial transcriptomic sequencing for the tumor sample. b UMAP plot of 248,336 cells profiled by all scRNA-seq, colored by cell types. The 11 broad cellular lineages contain ECs, lymphatic ECs, stromal cells (pericytes, fibroblasts), lymphoid cells (T/NK cells, B cells, plasma cells), myeloid cells, neutrophils, and cancer cells. Below the UMAP plot, the number of identified cells for each cell type is included. c UMAP plot colored by patients (n = 14 independent samples) from whole tumor cells or sorted CD45+ cells profiled by scRNA-seq. d UMAP plot colored by origin of the cells and the number of cells, either from whole tumor cells (n = 123,432) or sorted CD45+ cells (n = 124,904). e UMAP plot colored by nTLS (66,903), imTLS (61,415), and mTLS (120,018)—three different TLS statuses profiled by scRNA-seq. f UMAP plot colored by TCR/BCR information profiled by scTCR/BCR-seq. The cell types for scRNA-seq of whole tumor cells and the composition difference of CD45+ cells (g), H&E and IHC of tumor slides (h), and spatial transcriptomics of tumor tissue (i) in nTLS, imTLS, and mTLS statuses. The analysis was conducted using a generalized linear model (GLM) with a binomial distribution and a logit link function. Estimated marginal means and contrasts were computed with P values indicating the statistical significance of the observed differences. The P values were adjusted using the Bonferroni correction method. A color gradient, transitioning from red (indicating enrichment) to blue (signifying depletion), encodes the log2-transformed odds ratios, while the sizes of the depicted points are governed by the Bonferroni-adjusted −log10(P values), accentuating the statistical significance of observed variations. TLS tertiary lymphoid structures, OCT optimal cutting temperature, H&E hematoxylin and eosin, IHC immunohistochemistry, ECs endothelial cells.
Fig. 2
Fig. 2. TLS-associated heterogeneity of T and NK cell states in HNSCC.
a UMAP plot of T/NK cell subclusters identified from scRNA-seq. Subclusters are numbered and colored by identity: CD8+ T cells (clusters 1–5), cycling T/NK cells (clusters 6–8), CD4+ T cells (clusters 9–14), Treg cells (clusters 15–21), NK cells (clusters 22–26), γδT cells (cluster 27), and ILCs (cluster 28). b Left, GLM-based dot plot showing TLS status-specific enrichment of T/NK cell subclusters. The analysis was conducted using a GLM with a binomial distribution and a logit link function. Estimated marginal means and contrasts were computed with P values indicating the statistical significance of the observed differences. The P values were adjusted using the Bonferroni correction method. A color gradient, transitioning from red (representing enrichment) to blue (representing depletion), encodes the log2-transformed odds ratios, while the sizes of the depicted points are governed by the Bonferroni-adjusted −log10(P values), highlighting the statistical significance of observed variations. Middle, heatmap of average T cell state scores across T/NK cell subclusters. Right, heatmap of signaling pathway activity scores across T/NK cell subclusters. c Pairwise comparisons of kernel density estimates in UMAP space. The color gradient from red to blue indicates decreasing enrichment of T/NK cells and plasma cells in different TLS statuses. d Images of a mIHC-stained different subclusters of CD8+ T cells in HNSCC tumor with different TLS status. Regions with a high density of memory (CCR7+CD8+), stem-like (TCF1+CD8+), cytotoxic (Granzyme B+CD8+), and exhausted (PD-1+CD8+) CD8+ T cells. nTLS and imTLS were repeated four times independently with similar results, mTLS were repeated six times independently with similar results. Scale bars = 100 μm. e PAGA analysis of CD8+ T cells. Each color represents a subcluster of CD8+ T cell. f UMAP plot colored by pseudotime across subclusters of CD8+ T cells. Scaled module scores within these subclusters of CD8+ T cells with respect to pseudotime and stem-like, functional, and exhausted markers. g UMAP plot embedding for CD8+ T cell subclusters, colored by clone size (upper left) and UMAP embedding for CD8+ T cell clusters in different TLS status, colored by cluster, indicating the different clone size by dot size. h Boxplot showed the number of clonotypes of CD8+ T cells in different statuses of TLS (n = 4 independent samples nTLS, n = 4 independent samples imTLS, n = 5 independent samples mTLS, one-tailed Mann–Whitney U-test; for box plots: box center line, median; box limits, upper and lower quartiles; box whiskers, maximum and minimum values). i Clone size in each CD8+ T cell subclusters separated by TLS status (two-tailed Mann–Whitney U-test). j Heatmap and pie chart showing the number of clonotypes shared between neighboring functional clusters of CD8+ T cells in different statuses of TLS. For the heatmap, the color represents the number of shared clonotypes. For the pie chart, the color represents the status of TLS, and the size represents the number of shared clonotypes. k Dot plot showing the overlaps of shared clonotypes between stem-like and functional CD8+ T cells, sized by number of clonotypes and colored by TLS status. l Boxplot showing the number of functional clonotypes shared with stem-like CD8+ T cells in different status of TLS (n = 4 independent samples nTLS, n = 4 independent samples imTLS, n = 5 independent samples mTLS, one-tailed Mann–Whitney U-test; for box plots: box center line, median; box limits, upper and lower quartiles; box whiskers, maximum and minimum values). m Boxplot showing the proportion of shared stem-like and functional features in expanded clonotypes across different statuses of TLS (n = 4 independent samples nTLS, n = 4 independent samples imTLS, n = 5 independent samples mTLS, one-tailed Mann–Whitney U-test; for box plots: box center line, median; box limits, upper and lower quartiles; box whiskers, maximum and minimum values). Tconv conventional T cell, NK natural killer, mIHC multiplex IHC, ISG interferon-stimulated gene, ILC innate lymphoid cell, Tfh T follicular helper cell, Treg regulatory T cell.
Fig. 3
Fig. 3. TLS-associated heterogeneity of CD4+ T cell states in HNSCC.
a PAGA analysis of CD4+ T cells. Each color represents a subcluster of CD4+ T cells. b UMAP plots showing normalized expression profiles of cell-type-specific markers in CD4+ T cell subclusters. c Left, UMAP plot showing pseudotime trajectories of CD4+ T cell clusters, revealing two potential differentiation trajectories: exhaustion and Treg. Right, scaled module scores within these subclusters of CD4+ T cells with respect to two pseudotime trajectories and stem-like, functional, exhausted, and immunosuppressive markers. d Dot plot showing the analysis of enrichment for the four most significant Gene Ontology (GO) Biological Process terms across CD4+ T cell subclusters. A color gradient, transitioning from red (representing enrichment) to blue (representing depletion), encodes the Z-score normalized enrichment score, while the sizes of the depicted points are governed by the Benjamini–Hochberg-adjusted −log10(P values), highlighting the statistical significance of observed variations. Benjamini–Hochberg-adjusted P values were obtained by a two-tailed Wilcoxon rank-sum test. e UMAP plot embedding for CD4+ T cell subclusters, colored by clone size (upper left) and UMAP embedding for CD4+ T cell subclusters in different TLS status, colored by subcluster, indicating the different clone size by dot size. f Images of a mIHC-stained different subcluster of CD4+ T cells in HNSCC tumor with TLS status. Regions with a high density of central memory (CXCR5+CD4+) CD4+ T cells and progenitor exhausted (TCF1+PD-1+CD4+) CD4+ T cells. nTLS and imTLS were repeated four times independently with similar results, mTLS were repeated six times independently with similar results. Scale bars = 100 μm. g Heatmap and pie chart showing the number of clonotypes shared between neighboring functional clusters of CD4+ T cells in different statuses of TLS. For the heatmap, the color represents the number of shared clonotypes. For the pie chart, the color represents the status of TLS, and the size represents the number of shared clonotypes. hk Box plots showing the number of clonotypes of total CD4+ T cell, CD4+ Tconv cell, naive/central memory CD4+ T cell, and progenitor exhausted CD4+ T cell in different TLS status (n = 4 independent samples nTLS, n = 4 independent samples imTLS, n = 5 independent samples mTLS, one-tailed Mann–Whitney U-test; for box plots: box center line, median; box limits, upper and lower quartiles; box whiskers, maximum and minimum values). lo Boxplot showing fraction clonotypes of naive/central memory CD4+ T cell, progenitor exhausted CD4+ T cell, CD4+ Tconv cell (clusters 9–13) and Treg (clusters 15–20) in total CD4+ T cell clonotypes across different TLS status (n = 4 independent samples nTLS, n = 4 independent samples imTLS, n = 5 independent samples mTLS, one-tailed Mann–Whitney U-test; for box plots: box center line, median; box limits, upper and lower quartiles; box whiskers, maximum and minimum values). Tconv conventional T cell, Treg regulatory T cell, Tfh T follicular helper cell.
Fig. 4
Fig. 4. TLS-associated heterogeneity of B cell states in HNSCC.
a UMAP plot of B cell subclusters identified from scRNA-seq. Subclusters are numbered and colored by identity: B cells (clusters 1–6) and plasma cells (clusters 7–9). b Left, GLM-based dot plot showing TLS status-specific enrichment of B cell subclusters. The analysis was conducted using a GLM with a binomial distribution and a logit link function. Estimated marginal means and contrasts were computed with P values indicating the statistical significance of the observed differences. The P values were adjusted using the Bonferroni correction method. A color gradient, transitioning from red (representing enrichment) to blue (representing depletion), encodes the log2-transformed odds ratios, while the sizes of the depicted points are governed by the Bonferroni-adjusted −log10(P values), highlighting the statistical significance of observed variations. Middle, heatmap of signaling pathway activity scores across B cell and plasma cell subclusters. Right, heatmap of normalized expression of genes associated with immunoglobulin heavy chain constant region, which correlate with types of Ig across B cell subclusters. c Pairwise comparisons of kernel density estimates in UMAP space. The color gradient from red to blue indicates decreasing enrichment of B cells and plasma cells in different TLS statuses. d UMAP plots showing normalized expression profiles of cell-type-specific markers in B cell subclusters. e Ranking of GO Biological Process terms in subclusters of B cells. A color gradient, transitioning from red (representing enrichment) to blue (representing depletion), encodes the Benjamini–Hochberg-adjusted −log10(P values), highlighting the statistical significance of observed variations. Benjamini–Hochberg-adjusted P values were obtained by a two-tailed Wilcoxon rank-sum test. f PAGA analysis of B cells and plasma cells. Each color represents a subcluster of B cells or plasma cells. g Left, Schematic illustrates that as B cells differentiate from naive B cells to GC B cells, the maturation progressively increased, and the GC reaction time was extended. Right, scaled module scores within these subclusters of B cells with respect to two pseudotime trajectories and genes associated with activation, class switch recombination machinery and class switch recombination interactors. h Volcano plot showing differentially expressed genes (DEGs) of total B cells between non-mTLS (imTLS/nTLS) and mTLS statuses (red dots: Benjamini–Hochberg-adjusted P < 0.05 and log2(fold change) > 10, gray dots: adjusted P > 0.05, blue dots: adjusted P < 0.05 and log2(fold change) < −10). Benjamini–Hochberg-adjusted P values were obtained by a two-tailed Wilcoxon rank-sum test. i UMAP plot embedding for subclusters of B cells and plasma cells, colored by clone size (upper left) and UMAP embedding for subclusters of B cells and plasma cells in different TLS status, colored by subcluster, indicating the different clone size by dot size. A color gradient, transitioning from red (representing enrichment) to blue (representing depletion), encodes the Z-score normalized enrichment score, while the sizes of the depicted points are governed by the Benjamini–Hochberg-adjusted −log10(P values), highlighting the statistical significance of observed variations. Benjamini–Hochberg-adjusted P values were obtained by a two-tailed Wilcoxon rank-sum test. j Heatmap and pie chart showing the number of clonotypes shared between neighboring functional subclusters of B cells and plasma cells in different statuses of TLS. For the heatmap, the color represents the number of shared clonotypes. For the pie chart, the color represents the status of TLS, and the size represents the number of shared clonotypes. kn Boxplot showing number of clonotypes of total B cells, plasmablasts, plasma cells, and FCRL4+ B cells in different TLS status (n = 4 independent samples nTLS, n = 4 independent samples imTLS, n = 5 independent samples mTLS, one-tailed Mann–Whitney U-test; for box plots: box center line, median; box limits, upper and lower quartiles; box whiskers, maximum and minimum values). Ig immunoglobulin, MHC major histocompatibility complex, Th2 T helper 2 cell, GC germinal center.
Fig. 5
Fig. 5. TLS-associated heterogeneity of myeloid cell states in HNSCC.
a UMAP plot of myeloid cell subclusters identified from scRNA-seq. Subclusters are numbered and colored by identity: DCs (clusters 1–4), macrophages (clusters 5–13) and neutrophils (clusters 14 and 15), and mast cells (cluster 16). b Left, GLM-based dot plot showing TLS status-specific enrichment of myeloid cell subclusters. The analysis was conducted using a GLM with a binomial distribution and a logit link function. Estimated marginal means and contrasts were computed with P values indicating the statistical significance of the observed differences. The P values were adjusted using the Bonferroni correction method. A color gradient, transitioning from red (representing enrichment) to blue (representing depletion), encodes the log2-transformed odds ratios, while the sizes of the depicted points are governed by the Bonferroni-adjusted −log10(P values), highlighting the statistical significance of observed variations. Middle, heatmap of signaling pathway activity scores across myeloid cell subclusters. Right, heatmap of normalized expression of genes associated with MHC across myeloid cell subclusters. c Pairwise comparisons of kernel density estimates in UMAP space. The color gradient from red to blue indicates decreasing enrichment of myeloid cells in different TLS statuses. d UMAP plots showing normalized expression profiles of cell-type-specific markers in myeloid cell subclusters. e Dot plot showing the analysis of enrichment for the four most significant GO Biological Process terms across myeloid cell subclusters. A color gradient, transitioning from orange (representing enrichment) to purple (representing depletion), encodes the Z-score normalized enrichment score, while the sizes of the depicted points are governed by the Benjamini–Hochberg-adjusted −log10(P values), highlighting the statistical significance of observed variations. Benjamini–Hochberg-adjusted P values were obtained by a two-tailed Wilcoxon rank-sum test. Ig immunoglobulin, MHC major histocompatibility complex, DC dendritic cell, cDC conventional DC, mregDC mature DC enriched in immunoregulatory molecules, pDC plasmacytoid DC.
Fig. 6
Fig. 6. Spatial distribution of intra-tumoral TLS throughout different TLS status of HNSCC.
ac Spatial mapping of granulosa cell types from the scRNA-seq to spatial transcriptomics of nTLS, imTLS, and mTLS HNSCC using Cell2location. Spatial mapping of lineage of B cell, CD4+ and CD8+ T cell, and DC from the human scRNA-seq dataset to a respective spatial transcriptomics slide of HNSCC with nTLS (a), imTLS (b), and mTLS (c) statuses with cell2location. Estimated abundance for cell types (color intensity) to each Visium spot (color) shown over the H&E images. Scale bars = 1 mm. df heatmap of co-occurrence of B cells, CD4+ T cells, CD8+ T cells, and DCs across different TLS status. g Ligand–receptor pair expression analysis across B cells, CD4+ Tconv cells, DC, and B cell subclusters in B cell zone of mTLS, showing average gene expression by scRNA-seq h Ligand–receptor pair expression analysis across CD8+ T cell, CD4+ Tconv cell, and DC subclusters in T cell zone of mTLS, showing average gene expression by scRNA-seq. i spatial distributed expression of the CXCL13–CXCR5, CD40L (encoded by CD40LG)–CD40, and CD70–CD27 signaling axis in different TLS status. The color gradient indicates the gene expression (red, high expression; white, low expression). Scale bars = 1 mm.
Fig. 7
Fig. 7. mTLS is associated with better survival and response to ICB therapy in HNSCC.
a Heatmap plot showing TLS status in HNSCC (TCGA-HNSC) database (n = 500 independent samples) identified by the different immune cell types. A color gradient, transitioning from purple (representing enrichment) to white (representing depletion). The Benjamini–Hochberg adjusted P values obtained from two-sided Kruskal–Wallis tests. b Overall survival of patients with HNSCC by TLS status (n = 499 independent samples). Overall survival of patients with HNSCC by GC B cells (c) and CD8+ effector memory T cells (d) was analyzed using log-rank test results, which indicated statistical significance. e Multivariate Cox proportional regression outcome, with clinical variables. For every variable included in the analysis, the reference level is the first one. A gray bar symbolizes a P value > 0.05; and blue and red bars symbolize P value < 0.05 positively and negatively, respectively. Error bars represent the 95% confidence interval. f Scheme of mIHC for HNSCC tissue. gl Proportion of CD20+, CD4+, CD8+, DC-LAMP+, CD8+TCF1+, and CD4+TCF1+CXCL13+ cells in total cells of HNSCC tissue with different TLS status, respectively (n = 303 independent samples nTLS, n = 83 independent samples imTLS, n = 36 independent samples mTLS, two-tailed Mann–Whitney U-test, for box plots: box center line, median; box limits, upper and lower quartiles; box whiskers, maximum and minimum values). m Heatmap showing the Pearson correlation among cell subcluster abundances. The color gradient indicates the P value of Pearson correlation (red, high expression; white, low expression). n Images of an mIHC-stained HNSCC tissue with different statuses of TLS showing co-localization of B cell (CD20), T cell (CD4, CD8, and TCF1), mregDC (DC-LAMP), and chemokine (CXCL13) in HNSCC across. nTLS were repeated 303 times independently with similar results, imTLS were repeated 83 times independently with similar results, mTLS were repeated 36 times independently with similar results. Scale bars = 200 μm. o The Distance between each type of cell in each core of the TMAs, with cores grouped by TLS status. Vertical dotted lines indicate the median distance. p Relationship between differential prioritization ∆Augur score for parenting between response and no response, and Augur score for HNSCC patients treated with ICB therapy. The scRNA-seq data of pre-treatment tumor samples from six patients with HNSCC undergoing ICB therapy GSE200996 were used for Augur analysis. Each dot represents a cell type in the TME of HNSCC. Gray symbolizes a ∆Augur score of <0.02; and the colored dot symbolizes positively and negatively a ∆Augur score’s absolute value of >0.02, respectively. q Heatmap plot showing the response to anti-PD-1 therapy and abundance of different immune cell types. GSE93157 was used for this analysis. The Benjamini–Hochberg adjusted P values obtained from a two-tailed Mann–Whitney U-test. r Sketch map showing the TME of HNSCC with nTLS, imTLS, and mTLS. nTLS are unable to generate local anti-tumor immunity due to a lack of stem-like T cells and B cells. Meanwhile, imTLS, which is also enriched with B cells, cannot produce in situ anti-tumor immunity due to obstruction by immunosuppressive cells, including Tregs and M2 macrophages. mTLS enriched with stem-like CD4+ and CD8+ T cells and the presence of B cells at different maturation stages, supporting the generation of T and B cell responses. CD4+ Texprog/Tfh collaborated with cDC2 and mregDCs play a crucial role in regulating B cell and T cell response within mTLS. CR complete response, PR partial response, SD stable disease, PD progressive disease.

References

    1. Morad, G. et al. Hallmarks of response, resistance, and toxicity to immune checkpoint blockade. Cell184, 5309–5337 (2021). - PMC - PubMed
    1. Cramer, J. D. et al. The changing therapeutic landscape of head and neck cancer. Nat. Rev. Clin. Oncol.16, 669–683 (2019). - PubMed
    1. Li, A. Q. & Fang, J. H. Anti-angiogenic therapy enhances cancer immunotherapy: mechanism and clinical application. Interdiscip. Med.2, e20230025 (2024).
    1. Cabrita, R. et al. Tertiary lymphoid structures improve immunotherapy and survival in melanoma. Nature577, 561–565 (2020). - PubMed
    1. Helmink, B. A. et al. B cells and tertiary lymphoid structures promote immunotherapy response. Nature577, 549–555 (2020). - PMC - PubMed

MeSH terms

Substances