. 2025 May 7;16(1):4233.
doi: 10.1038/s41467-025-59156-9.

Genomic landscape of diffuse glioma revealed by whole genome sequencing

Affiliations

Genomic landscape of diffuse glioma revealed by whole genome sequencing

Ben Kinnersley et al. Nat Commun. .

Abstract

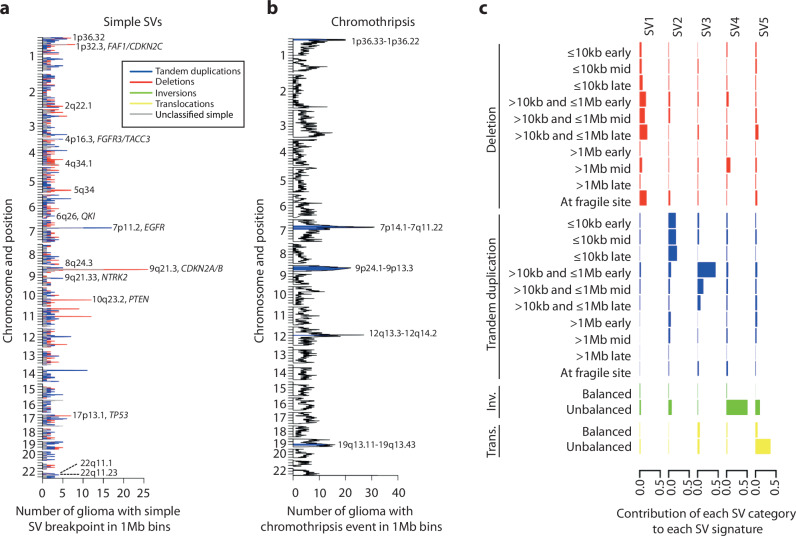
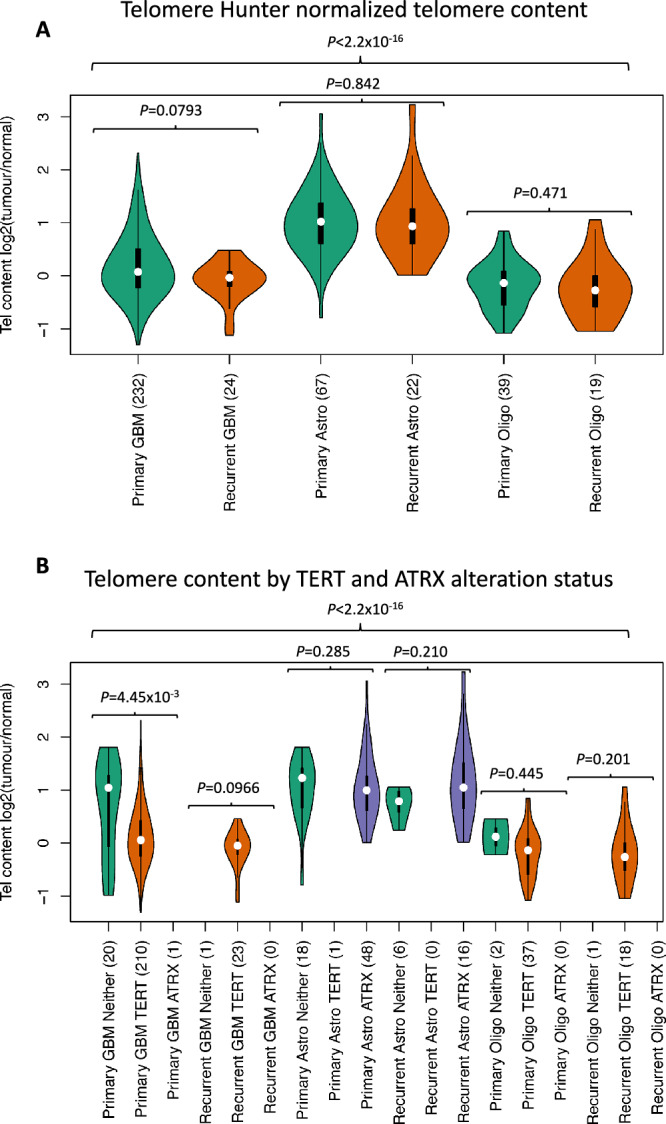
Diffuse gliomas are the commonest malignant primary brain tumour in adults. Herein, we present analysis of the genomic landscape of adult glioma, by whole genome sequencing of 403 tumours (256 glioblastoma, 89 astrocytoma, 58 oligodendroglioma; 338 primary, 65 recurrence). We identify an extended catalogue of recurrent coding and non-coding genetic mutations that represents a source for future studies and provides a high-resolution map of structural variants, copy number changes and global genome features including telomere length, mutational signatures and extrachromosomal DNA. Finally, we relate these to clinical outcome. As well as identifying drug targets for treatment of glioma our findings offer the prospect of improving treatment allocation with established targeted therapies.


Conflict of interest statement

Competing interests: The authors declare no competing interests.

Figures

Fig. 1
Fig. 1. Study overview.
Overview of clinical features (WHO grade 2−4, primary vs recurrent tumour—top row; gender and age distribution—second row) stratified by tumour subtype. Left column (green) depicts oligodendroglioma (n = 58), middle column (blue) depicts astrocytoma (n = 89) and right column (red) depicts glioblastoma (n = 256). Schematic representation of tumour location for each glioma subtype by lobe (frontal, temporal, parietal, occipital, insula, other location) in the third row. Survival is shown as overall survival and progression free survival classified by tumour grade for oligodendroglioma and astrocytoma (overall survival—coloured solid line, progression free survival—black dashed line). Overall survival and progression free survival for glioblastoma is shown by MGMT methylation status (methylated—coloured solid line, unmethylated—coloured dashed line, unknown—black line). Kaplan-Meier curves are plotted with significance between groupings estimated using the log-rank test. P-values are two-sided and unadjusted. Last row demonstrates molecular markers stratified by tumour subtype (wild type—pink, mutant—green, unknown—grey).
Fig. 2
Fig. 2. Summary of molecular alterations across glioma subtypes.
From top to bottom: clonal and subclonal nonsynonymous mutation counts (log10); proportions of single base substitution (SBS) mutational signatures; glioma subtype; tumour type; tumour grade; whole-genome duplication (WGD) status; MGMT promoter methylation status; normalised log2(tumour/normal) telomere content; alteration status of common glioma driver genes; gain or loss of heterozygosity (LOH) status of chromosome arms commonly gained or lost in glioma. Homdel, homozygous deletion.
Fig. 3
Fig. 3. Patterns of structural variation.
a Significant hotspots of simple structural variants (SVs) identified in all unique glioma samples (n = 400). Non-fragile SV hotspots identified at a false discovery rate (FDR) of 5% are annotated with the cytoband and any candidate genes. Fragile site SVs have not been plotted. Coloured lines represent the number of tumours with a SV break point of each type in 1 Mb genome regions. b Frequency of chromothripsis events, with regions enriched for chromothripsis at a 5% FDR greater than 5 Mb are coloured blue. c 5 SV signatures extracted from glioma samples with ≥10 simple SVs. Bars represent each SV category’s contribution to each SV signature. Inv.: inversions; Trans.: translocations.
Fig. 4
Fig. 4. Prognostic insights depicted per tumour subtype.
Genetic alterations found in Oligodendrogliomas (green), Astrocytomas (blue) and Glioblastoma (red) that are associated with a favourable (middle row) or unfavourable prognosis (bottom row). Additional molecular findings associated with adjuvant therapy, EGFR vIII mutation and MGMT status are shown at the bottom.
Fig. 5
Fig. 5. Mutational signatures across subtypes.
Plotted are overall proportions of SBS96, DBS78 and ID83 signature activities detected across each glioma subtype.
Fig. 6
Fig. 6. Driver mutations attributed to SBS96 and ID83 mutational signatures.
Oncogenic driver mutations were attributed to signature probabilities based on mutational contexts (Supplementary Methods).
Fig. 7
Fig. 7. Driver mutation clonality by subtype.
A Primary GBM (n = 232); B recurrent GBM (n = 24); C primary astrocytoma (n = 67); D recurrent astrocytoma (n = 22); E primary oligodendroglioma (n = 39); F recurrent oligodendroglioma (n = 19). Total n = 403.
Fig. 8
Fig. 8. Telomere content by subtype and telomere maintenance mechanism.
A Telomere Hunter normalized telomere content by glioma subtype; B Telomere Hunter normalized telomere content by TERT and ATRX alteration status. Unadjusted two-sided P-values estimated from Kruskal-Wallis test between indicated tumour subsets with sample numbers indicated in brackets. In the box plots, the centre line represents the median, and the box bounds represents the inter-quartile range. Total n = 403.
Fig. 9
Fig. 9. Tumour neoantigens and immune evasion mechanisms by subtype.
A Presence of immune evasion mechanisms by tumour subtype (Yes indicating tumours with at least one immune evasion mechanism, otherwise No); B Clonal neoantigen mutations across glioma subtypes and presence of immune evasion mechanism. Unadjusted two-sided P-values estimated from Kruskal-Wallis test between indicated tumour subsets with sample numbers indicated in brackets. In the box plots, the centre line represents the median, and the box bounds represents the inter-quartile range. Total n = 403.
Fig. 10
Fig. 10. Per-gene actionable events catalogued by OncoKB.
Level 1: FDA-recognised biomarker predictive of response to an FDA-approved drug in this indication; Level 2: Standard care biomarker predictive of a response to an FDA-approved drug in this indication; Level 3A: Compelling clinical evidence supports the biomarker as being predictive of response to a drug in this indication; Level 3B: Standard care or investigational biomarker predictive of response to an FDA-approved or investigational drug in another indication; Level 4: Compelling biological evidence supports the biomarker as being predictive of response to a drug. A Primary GBM; B recurrent GBM; C primary astrocytoma; D recurrent astrocytoma; E primary oligodendroglioma; F recurrent oligodendroglioma.

Similar articles

References

    1. Crocetti, E. et al. Epidemiology of glial and non-glial brain tumours in Europe. Eur. J. Cancer48, 1532–1542 (2012). - PubMed
    1. Bondy, M. L. et al. Brain tumor epidemiology: consensus from the Brain Tumor Epidemiology Consortium. Cancer113, 1953–1968 (2008). - PMC - PubMed
    1. Koshy, M. et al. Improved survival time trends for glioblastoma using the SEER 17 population-based registries. J. Neurooncol.107, 207–212 (2012). - PMC - PubMed
    1. Brennan, C. W. et al. The somatic genomic landscape of glioblastoma. Cell155, 462–477 (2013). - PMC - PubMed
    1. Eckel-Passow, J. E. et al. Glioma groups based on 1p/19q, IDH, and TERT promoter mutations in tumors. N. Engl. J. Med.372, 2499–2508 (2015). - PMC - PubMed