. 2025 May 7;16(1):4225.
doi: 10.1038/s41467-025-59706-1.

Dietary amino acids regulate Salmonella colonization via microbiota-dependent mechanisms in the mouse gut

Affiliations

Dietary amino acids regulate Salmonella colonization via microbiota-dependent mechanisms in the mouse gut

Joseph M Pickard et al. Nat Commun. .

Abstract

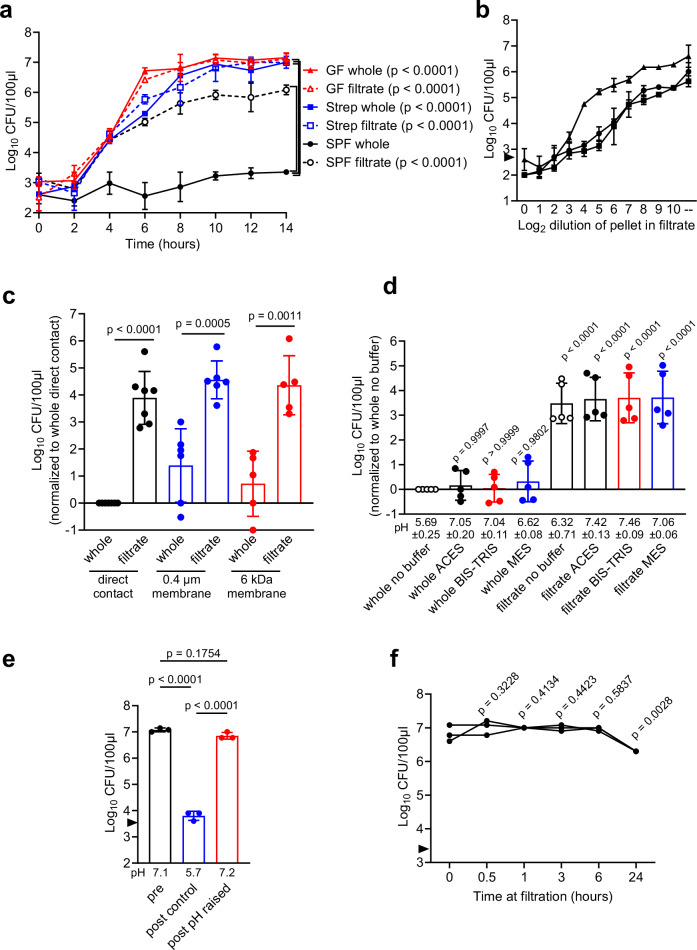
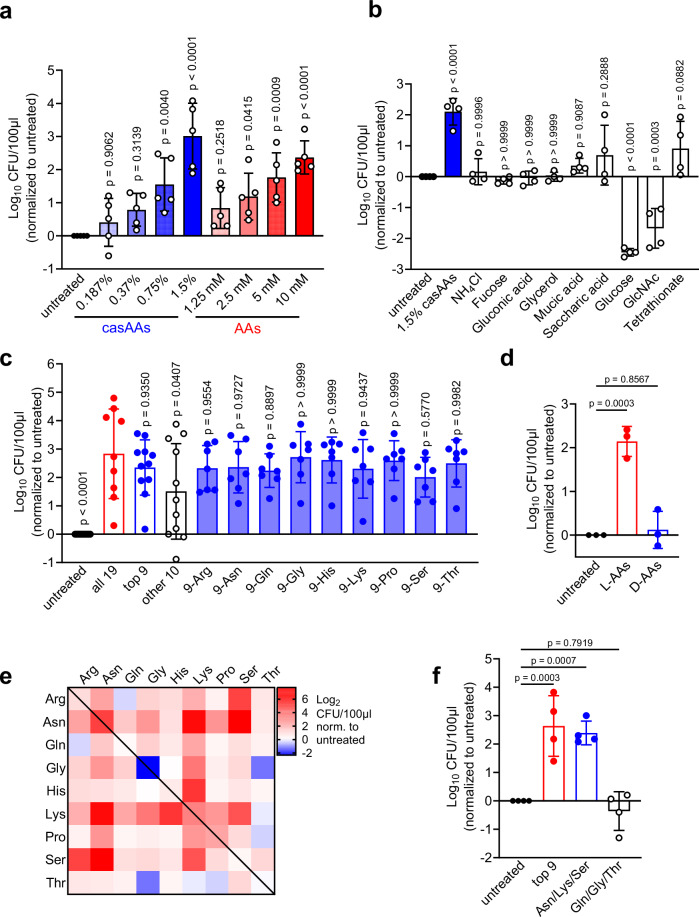
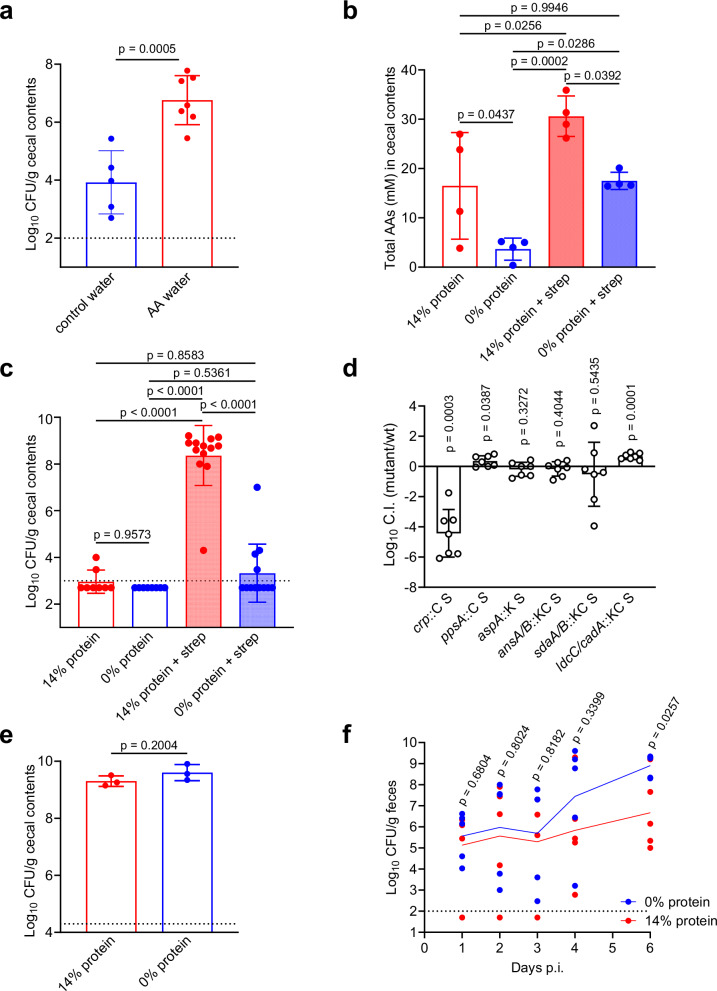
The gut microbiota confers host protection against pathogen colonization early after infection. Several mechanisms underlying the protection have been described, but the contributions of nutrient competition versus direct inhibition are controversial. Using an ex vivo model of Salmonella growth in the mouse cecum with its indigenous microbes, we find that nutrient limitation and typical inhibitory factors alone cannot prevent pathogen growth. However, the addition of certain amino acids markedly reverses the microbiota's ability to suppress pathogen growth. Enhanced Salmonella colonization after antibiotic treatment is ablated by exclusion of dietary protein, which requires the presence of the microbiota. Thus, dietary protein and amino acids are important regulators of colonization resistance.


Conflict of interest statement

Competing interests: The authors declare no competing interests.

Figures

Fig. 1
Fig. 1. S. Tm growth is inhibited in ex vivo cecum by live bacteria via small soluble factors but not nutrient depletion.
a Cecal contents were homogenized and left whole or 0.45 µm filtered (filtrate), inoculated with S. Tm, incubated and sampled to determine S. Tm loads. Technical triplicates from n = 1 mouse of each treatment, representative of 2 experiments. b Cecal contents were homogenized and centrifuged. Supernatant was 0.45 µm filtered, and an aliquot of the pellet was resuspended and serially diluted in filtrate. CFUs were measured at 16 h (arrowhead = input). Technical replicates from n = 3 mice. c Cecal contents were homogenized, left whole or 0.45 µm filtered, and mixed directly with S. Tm or separated from S. Tm (in filtrate) by the indicated membranes. CFUs were measured as above. Material from n = 7 (direct contact), n = 6 (0.4 µm membrane), n = 5 (6 kDa membrane) mice or unique pools of mice. d Buffers were added to cecal contents and left whole or filtered. pH was measured at the end of the 16 h incubation with S. Tm, and CFUs measured as above. n = 5 mice. e Cecal contents were homogenized and 0.45 µm filtered (pre) or incubated 16 h anaerobically and then filtered (post). Post-incubation filtrate was pH adjusted with NaOH or NaCl as control, and pH was measured. S. Tm (arrowhead = input) was grown for 16 h in the filtrates. Technical triplicates from n = 1 mouse cecum, representative of 3 experiments. f Cecal homogenates in pH 7.6 BIS-TRIS buffer were incubated anaerobically at 37 °C, and an aliquot was removed and filtered at the indicated times. The filtrate was used to grow S. Tm (arrowhead = input) for 16 h. n = 3 mice. Results in (c and d) combined from multiple experiments. All dots or bars (except f) show mean ± SD. P values are the result of one-way ANOVA with Šídák’s (a – 14 h timepoint vs. SPF whole), Dunnett’s (d – vs. whole no buffer, f – vs. time 0) or Tukey’s multiple comparisons test (e) or unpaired two-tailed t-test (c). Source data are provided as a Source Data file.
Fig. 2
Fig. 2. Selected amino acids can rescue S. Tm growth.
a Hydrolyzed casein (casAAs) or all 20 L-AAs at the indicated final concentration of each (except Trp/Tyr at 10x less) were added to whole cecal homogenate with S. Tm and incubated 16 h, and CFUs counted by dilution plating. n = 5 mice. b Sugars and other chemicals were added to cecal homogenate at 10 mM (except casAAs at 1.5% w/v), S. Tm was added, and growth was measured as above. n = 4 mice. c Mixtures of all 19 L-AAs (-Cys), top 9, other 10, or the top 9, leaving out one at a time, were added to cecal homogenates at 10 mM each (except Trp/Tyr at 1 mM). Material from n = 9 (all 19), n = 11 (top 9), n = 10 (other 10), n = 7 (leaving out one) mice. d L or D enantiomers of the top 9 AAs except Gly and Ser were added to cecal homogenate at 10 mM each. n = 3 mice. e Heat map showing S. Tm growth relative to untreated cecal homogenate when pairs of AAs were added at 50 mM each (except Asn at 25 mM). Single AAs (along diagonal line) are at 100 mM. Log2 transformed mean, normalized to untreated, n = 3 mice. f The indicated AAs were added at 10 mM (top 9) or 30 mM (trios) each. n = 4 mice. Results combined from multiple experiments except (b, d and e), which are representative of 2 experiments. Bars are mean ± SD of final CFUs normalized to untreated control. P values are the result of one-way ANOVA with Dunnett’s multiple comparisons test versus untreated (except c – vs. all 19). Source data are provided as a Source Data file.
Fig. 3
Fig. 3. Genetic and functional analysis of AA usage ex vivo.
a Initial hits from the MGD screen (see Supplementary Fig. 3a) were tested in the same conditions, and competitive index (C.I.) was calculated by dividing mutant/wt CFUs in each well. n = 5 mice, mean ± SD. Only mutants with a p < 0.05 by one-sample two-tailed t-test versus C.I. of 0 are shown. Arrows indicate the suspected or confirmed (bold) single-gene cause of the defect. Mutants with growth defects in minimal medium (see Supplementary Fig. 4) are indicated with filled circles. b Cecal homogenates were prepared from n = 4 mice and left whole or filtered. Filtrates with or without S. Tm and whole homogenates were incubated anaerobically at 37 °C. At 12 h, all samples were centrifuged, supernatants filtered, and AAs quantitated by targeted capillary electrophoresis time-of-flight mass spectrometry (CE-TOFMS). Levels in the sterile control filtrate incubation were subtracted from each sample and mean ± SD are shown. P values are the result of one-sample two-tailed t-test versus 0. c Cecal homogenates were left whole, diluted 32x in their own filtrate, filtered, or had 9 AAs or Asn/Lys/Ser added (as in Fig. 2f). Then the indicated mutants were grown in competition with the wt parent strain and CFUs at 16 h counted to calculate the C.I. Cecal contents from n = 9 mice, combined from multiple experiments. Bars are mean ± SD. P values are the result of one-sample two-tailed t-test versus 0. See also Supplementary Fig. 3d. Source data are provided as a Source Data file.
Fig. 4
Fig. 4. Dietary amino acids modulate S. Tm colonization.
a SPF mice were given a mixture of 7 L-AAs (Arg, Asn, Gln, Lys, Pro, Ser, Thr) at 200 mM each in their drinking water or normal water one day prior to infection, infected with wt 14028S strepr S. Tm, and cecal CFUs quantitated at one day post-infection. Mean ± SD, n = 5 (control water) and n = 7 (AA water) mice, two-tailed t-test. b AAs were measured in cecal content supernatants from untreated or streptomycin-treated SPF mice on diets for one day, by CE-TOFMS. n = 4 mice, mean ± SD, one-way ANOVA with Tukey’s multiple comparisons. c SPF mice were treated with streptomycin and placed on 14% or 0% protein diets one day prior to infection, infected with wt 14028S strepr S. Tm, and cecal CFUs quantitated one day post-infection. n = 8 (14% protein), n = 8 (0% protein), n = 13 (14% protein + strep), n = 13 (0% protein + strep), mean ± SD, combined from 3 experiments, one-way ANOVA with Tukey’s multiple comparisons. d Streptomycin pre-treated mice on normal chow diet were infected with equal numbers of the indicated mutant strains and wt 14028S strepr parent strain. Cecal contents were plated 24 h later, and C.I. was determined by dividing mutant/wt CFUs. n = 7, combined from multiple experiments. Bars show mean ± SD, one-sample two-tailed t-test versus the neutral C.I. of 0. e GF C57Bl/6 mice were placed on diets one day prior to infection, infected with wt 14028S strepr, and cecal CFUs quantitated one day post-infection. n = 3 mice, mean ± SD, two-tailed t-test. f SPF CBA/J mice were placed on diets one day before infection with wt 14028S strepr S. Tm, and feces plated to determine loads. n = 5 mice, line is mean, unpaired two-tailed t-test. Dotted lines are the limit of detection. Source data are provided as a Source Data file.

Similar articles

References

    1. Backhed, F., Ley, R. E., Sonnenburg, J. L., Peterson, D. A. & Gordon, J. I. Host-bacterial mutualism in the human intestine. Science307, 1915–1920 (2005). - PubMed
    1. Pickard, J. M. & Nunez, G. Pathogen colonization resistance in the gut and its manipulation for improved health. Am. J. Pathol.189, 1300–1310 (2019). - PMC - PubMed
    1. Caballero-Flores, G., Pickard, J. M. & Nunez, G. Microbiota-mediated colonization resistance: mechanisms and regulation. Nat. Rev. Microbiol. 10.1038/s41579-022-00833-7 (2022). - PMC - PubMed
    1. Freter, R., Brickner, H., Botney, M., Cleven, D. & Aranki, A. Mechanisms that control bacterial populations in continuous-flow culture models of mouse large intestinal flora. Infect. Immun.39, 676–685 (1983). - PMC - PubMed
    1. Turnbaugh, P. J., Bäckhed, F., Fulton, L. & Gordon, J. I. Diet-induced obesity is linked to marked but reversible alterations in the mouse distal gut microbiome. Cell Host Microbe3, 213–223 (2008). - PMC - PubMed

MeSH terms