. 2025 May 7;15(1):15949.
doi: 10.1038/s41598-025-98259-7.

Heatwave duration, intensity and timing as drivers of performance in larvae of a marine invertebrate

Affiliations

Heatwave duration, intensity and timing as drivers of performance in larvae of a marine invertebrate

Margot Deschamps et al. Sci Rep. .

Abstract

In marine ecosystems, crustaceans face an alarming threat from the increasing frequency and intensity of marine heatwaves as their early planktonic stages are particularly temperature sensitive. While the impact of heatwaves on adult crustaceans is well-studied, their effects on larvae remain underexplored. This study focuses on heatwave effects on larvae of the European shore crab, Carcinus maenas. Through a factorial experiment, larvae were exposed to different heatwaves of varying onset timings, durations, and intensities. Survival, development duration, and dry mass decreased under intense heatwaves, with more severe effects observed when heatwaves occurred later in development, highlighting a stage-specific sensitivity to heatwave. We also identified a "region of existence" beyond which larval performance was compromised compared to baseline temperatures. This region defines the heatwave components considered "extreme" for the organism, as well as those inducing neutral or positive effects on performance. Additionally, we distinguished heatwave effects (characterised by their components) from those attributed to the average temperature experienced during the experiments. Our findings demonstrated that larval performance was lower during intense heatwaves compared to the performance expected under a constant average temperature. These findings emphasize the importance of considering heatwave timing relative to the life cycle for predicting marine population responses to climate change.

Keywords: Carcinus maenas; Global warming; Larval performance; Marine heatwaves.


Conflict of interest statement

Declarations. Competing interests: The authors declare no competing interests. Ethical approval: The research presented in this paper complies with the German and international laws (guidelines from the directives 2010/63/EU of the European parliament and of the Council of 22nd September 2010) on the protection of animals used for scientific purposes.

Figures

Fig. 1
Fig. 1
Heatwave components diagram. Intensity, timing and duration represent the maximum intensity (°C), the time of the start and the duration (days) of the event, respectively.
Fig. 2
Fig. 2
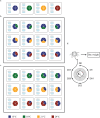
Experimental design for warm event simulations. Larvae were reared in groups of 10 individuals each in three replicate beakers representing each combination of the above mention factorial design. Pie charts symbolise the complete zoeal life cycle of C. maenas, with each sector corresponding to 5 days of development. (a) Four controls were carried out wherein larvae were maintained at constant temperatures (15, 18, 21 & 24 °C) throughout their larval cycle until metamorphosis. (b) Warm pulses experiment. Larvae were kept at the baseline temperature (15 °C) and exposed for 10 days to higher temperatures (18, 21 & 24 °C) starting on days 0, 5, 10 and 15. (c) Warm presses experiment. Larvae were reared at the baseline temperature (15 °C) and then kept at higher temperatures (18, 21 & 24 °C) starting on days 0, 5, 10 and 15 until they reached megalopa. Note that days 0 for the warm press experiment are the same treatment as the control. (d) Larval cycle of C. maenas. Zoea were reared until they reached megalopa. At metamorphosis (within 24 h of moulting to megalopa), individual megalopa were sampled for further analysis of dry mass.
Fig. 3
Fig. 3
Workflow for predicting larval performance values (survival, development duration, and growth traits) under the average temperature experienced during warm event experiments. (a) The average temperature experienced by the larvae if the temperature was constant throughout the experiment was calculated for each replicate across the different warm event conditions. (b) Expected trait values were obtained by fitting models with the control temperatures (15 °C filled blue diamond, 18 °C filled green circle, 21 °C filled yellow rectangle and 24 °C filled red triangle) as fixed effects and the individual females (♀) as a random effect. (c) The expected trait values (filled inverted triangle) under the average temperature were compared with the observed values during warm events (×) by fitting LMMs. The fixed factor, expected/observed was included in the model, in interaction with temperature and timing. The ♀ was used as a random factor.
Fig. 4
Fig. 4
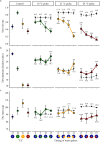
Survival rate, development duration, and dry mass after exposure to warm pulses. Comparison between observed (18 °C: filled green circle ; 21 °C: filled yellow rectangle ; 24 °C: filled red triangle warm pulses) and expected (filled inverted triangle) values under average temperature experienced throughout the experiment. (a) Survival rate to megalopa, (b) development duration from hatching to megalopa and (c) megalopa dry mass reared at control constant (left panel) or under warm pulse (right panels). Temperatures: 15 °C filled blue diamond, 18 °C filled green circle, 21 °C filled yellow rectangle and 24 °C filled red triangle. Each point represents the mean value ± standard error for each treatment per female (n = 4). Values above or below the black dotted line represent the average constant temperature experienced (°C) during the warm pulses. Asterisks indicate significant differences between expected and observed values for each treatment. p < 0.05*, p < 0.01**, p < 0.001***. Pie charts indicate control and warm pulse treatments.
Fig. 5
Fig. 5
Difference in larval performance between the baseline constant temperature and warm pulse conditions. Differences in (a) larval survival and (b) fitness. Fitness is calculated as the total megalopa production (mg). Colour gradient represents the difference between response at the baseline temperature: 15 °C, and after exposure to warm pulses. Differences < 0 indicate positive effects of the warm pulses (i.e., the region below the “0” isoline). Differences > 0 indicate negative effects of warm pulses (i.e., the region extending beyond the “0” isoline). Differences ≈ 0 indicate no effects. Note the difference in the gradient scale limits.
Fig. 6
Fig. 6
Survival rate, development duration, and dry mass after exposure to warm presses. Comparison between observed (18 °C: filled green circle; 21 °C: filled yellow rectangle ; and 24 °C: filled red triangle warm press) and expected (filled inverted triangle) values under average temperature experienced throughout the experiment. (a) Survival rate to megalopa, (b) development duration from hatching to megalopa and (c) megalopa dry mass reared at control constant (left panel) or under warm press (right panels). Temperatures: 15 °C filled blue diamond, 18 °C filled green circle, 21 °C filled yellow rectangle and 24 °C filled red triangle). Each point represents the mean value ± standard error for each treatment per female (n = 4). Values above or below the black dotted line represent the average constant temperature experienced (°C) during the warm presses. Asterisks indicate significant differences between expected and observed values for each treatment. p < 0.05*, p < 0.01**, p < 0.001***. Note that each timing 0 is equivalent to the controls (i.e., larvae reared at constant temperatures: 18, 21, and 24 °C from hatching until metamorphosis; left panel). Pie charts indicate control and warm press treatments.
Fig. 7
Fig. 7
Difference in larval performance between the baseline constant temperature and warm presses condition. Differences in (a) larval survival and (b) fitness. Fitness is calculated as the total megalopa production (mg). Colour gradient represents the difference between response at the baseline temperature: 15 °C, and after exposure to warm presses. Differences < 0 indicate positive effects of the warm presses (i.e., the region below the “0” isoline). Differences > 0 indicate negative effects of the warm presses (i.e., the region extending beyond the “0” isoline). Differences ≈ 0 indicate no effects. Note the difference in the gradient scale limits.
Fig. 8
Fig. 8
Difference between the observed survival during warm pulses and presses and the expectation for the average temperature experienced throughout the experiment (color gradient). Intensity (left axis) is shown as °C (+ 3 for 18 °C, + 6 for 21 °C, and + 9 for 24 °C). The black line represents the threshold of statistical significance (p = 0.05).

References

    1. Rama, H. O. et al. Climate Change 2022: Impacts, Adaptation and Vulnerability Working Group II Contribution to the Sixth Assessment Report of the Intergovernmental Panel on Climate Change. 10.1017/9781009325844 (2022).
    1. Meehl, G. A., Tebaldi, C. M. & Intense More frequent, and longer lasting heat waves in the 21st century. Science305, 994–997 (2004). - PubMed
    1. Perkins, S. E., Alexander, L. V. & Nairn, J. R. Increasing frequency, intensity and duration of observed global heatwaves and warm spells. Geophys. Res. Lett.39, 2012GL053361 (2012).
    1. Frölicher, T. L. & Fischer, E. M. Gruber, N. Marine heatwaves under global warming. Nature560, 360–364 (2018). - PubMed
    1. Oliver, E. C. J. et al. Longer and more frequent marine heatwaves over the past century. Nat. Commun.9, 1324 (2018). - PMC - PubMed

LinkOut - more resources