. 2025 Jul;643(8071):572-581.
doi: 10.1038/s41586-025-08971-7. Epub 2025 May 7.

Native nucleosomes intrinsically encode genome organization principles

Affiliations

Native nucleosomes intrinsically encode genome organization principles

Sangwoo Park et al. Nature. 2025 Jul.

Abstract

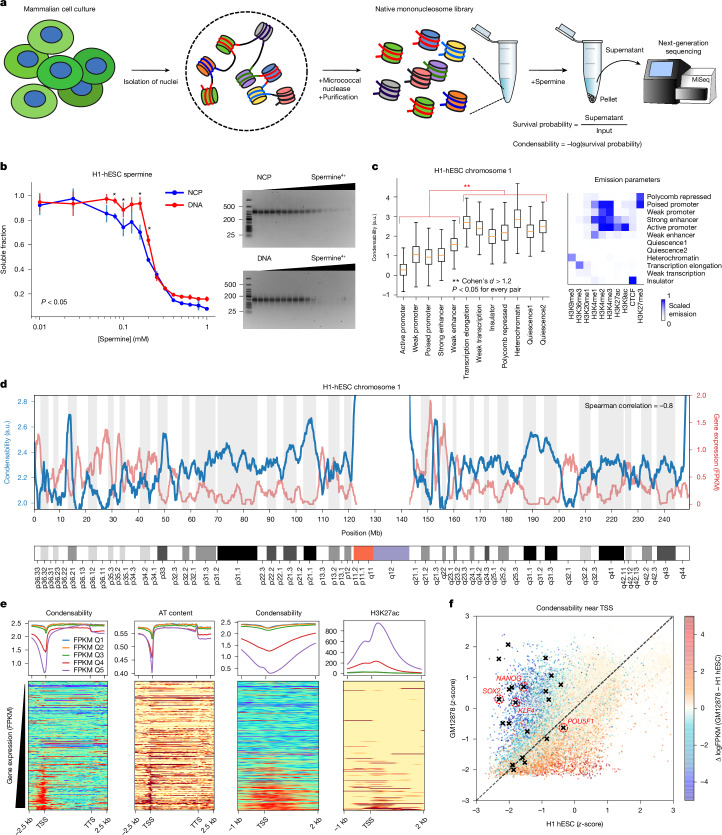
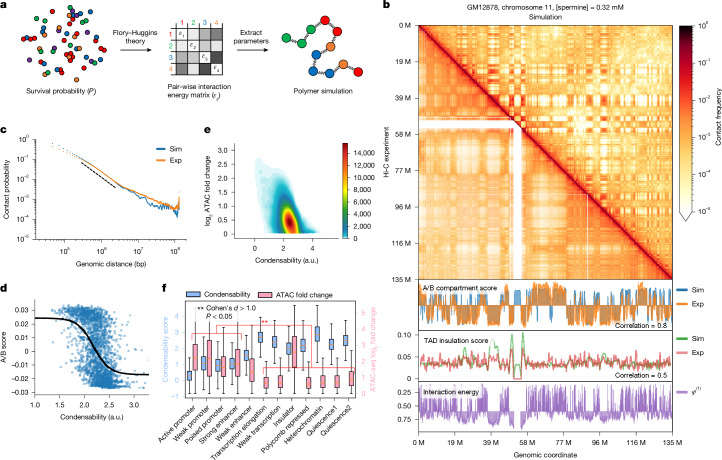
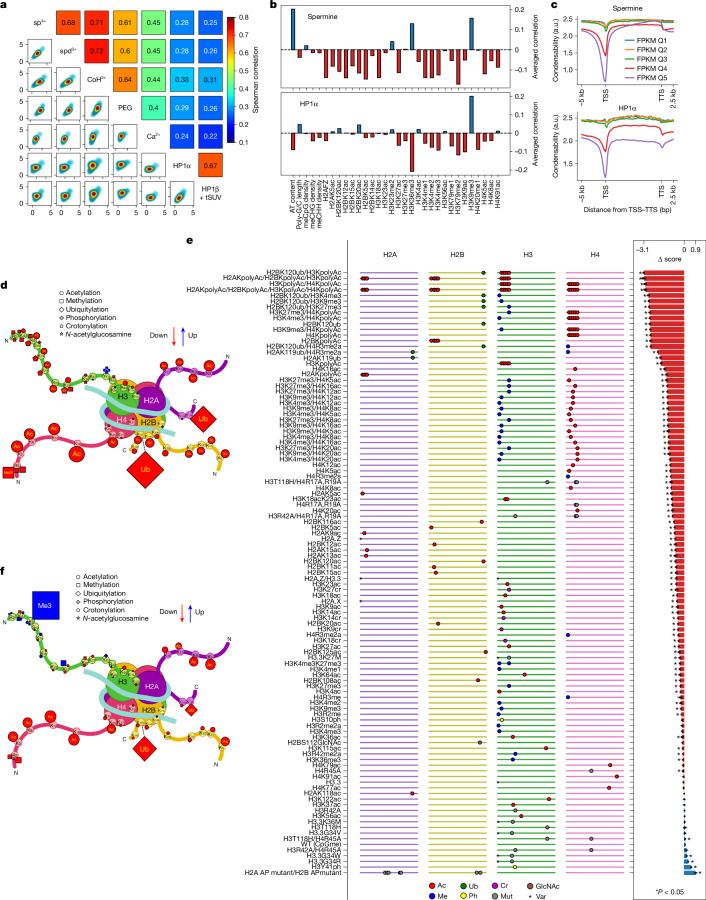
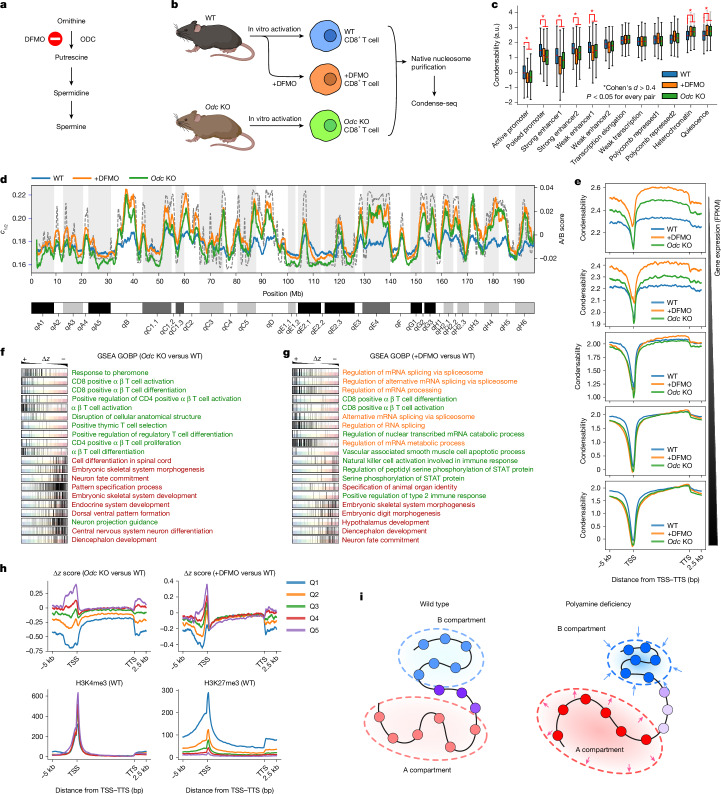
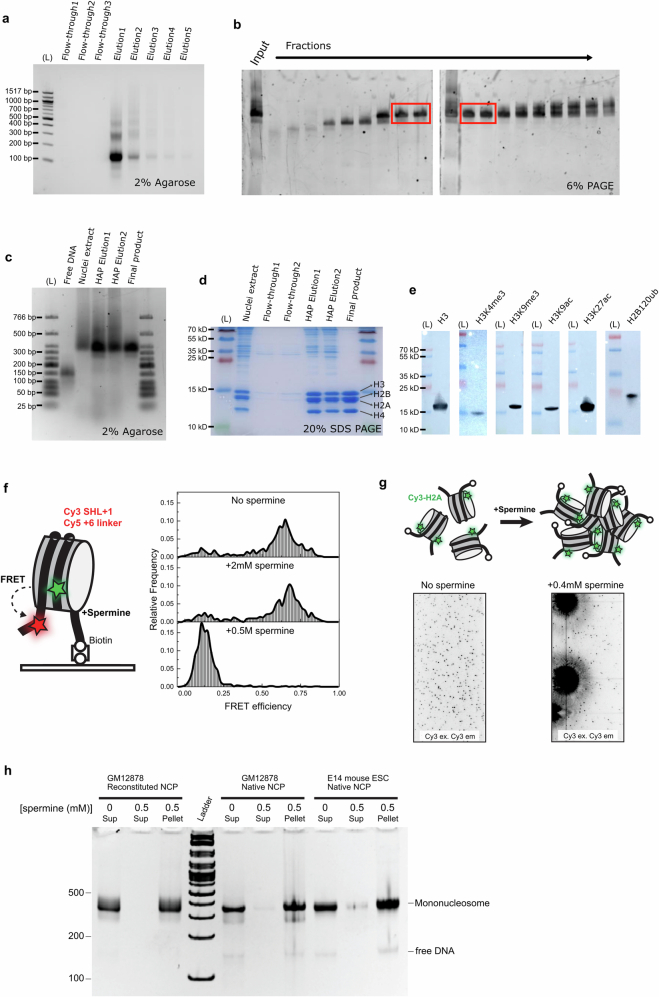
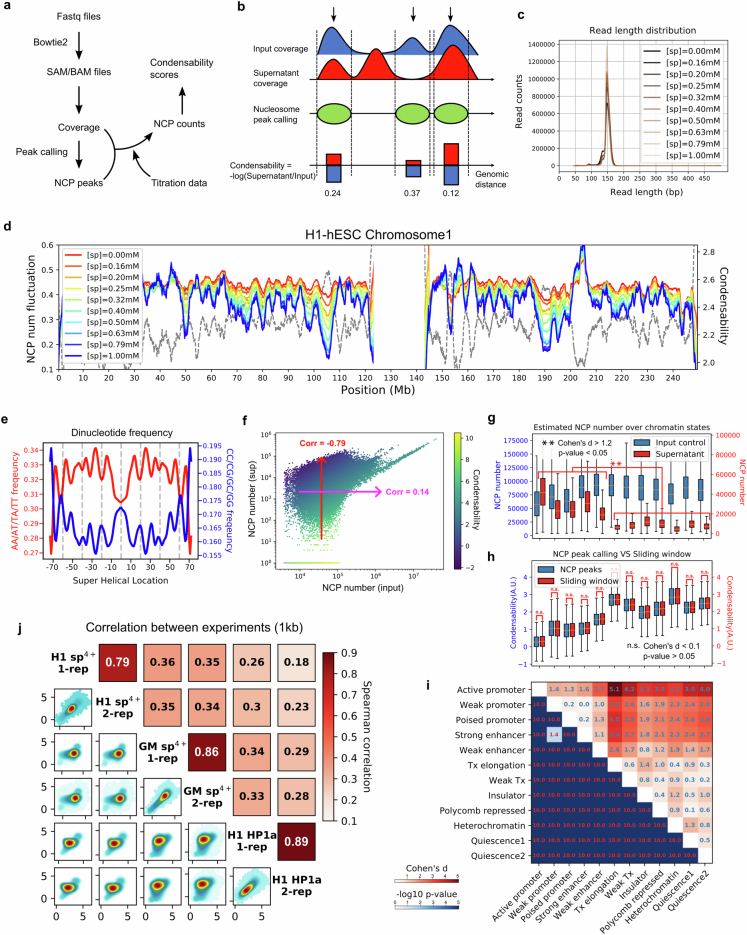
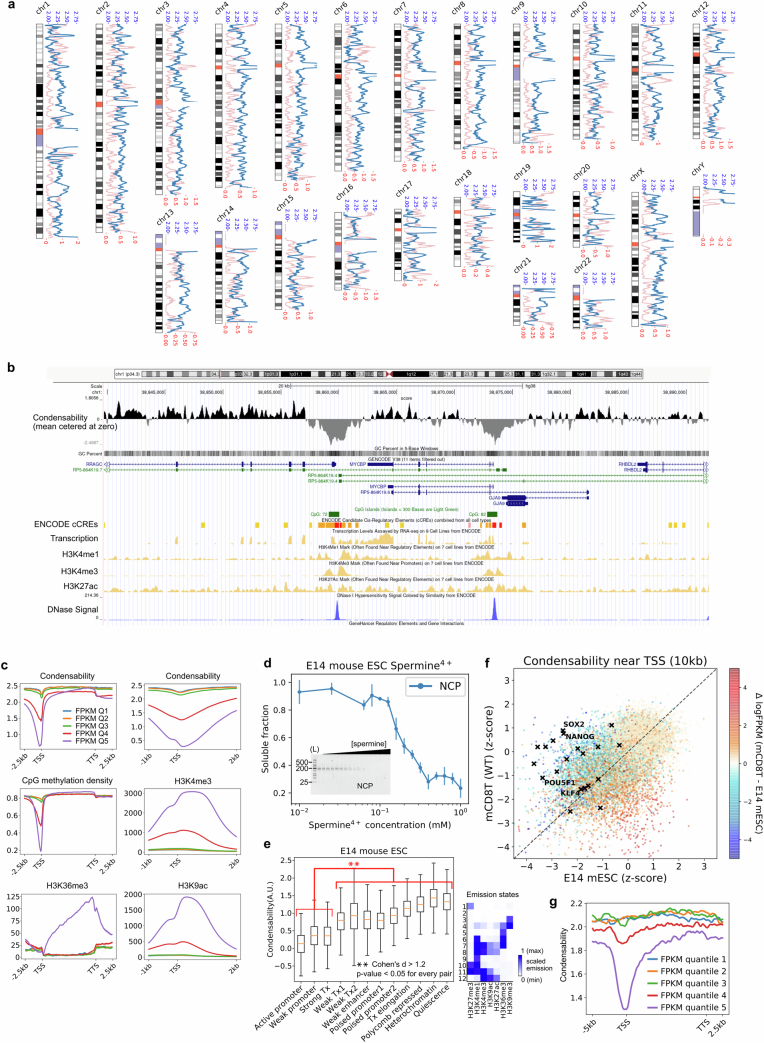
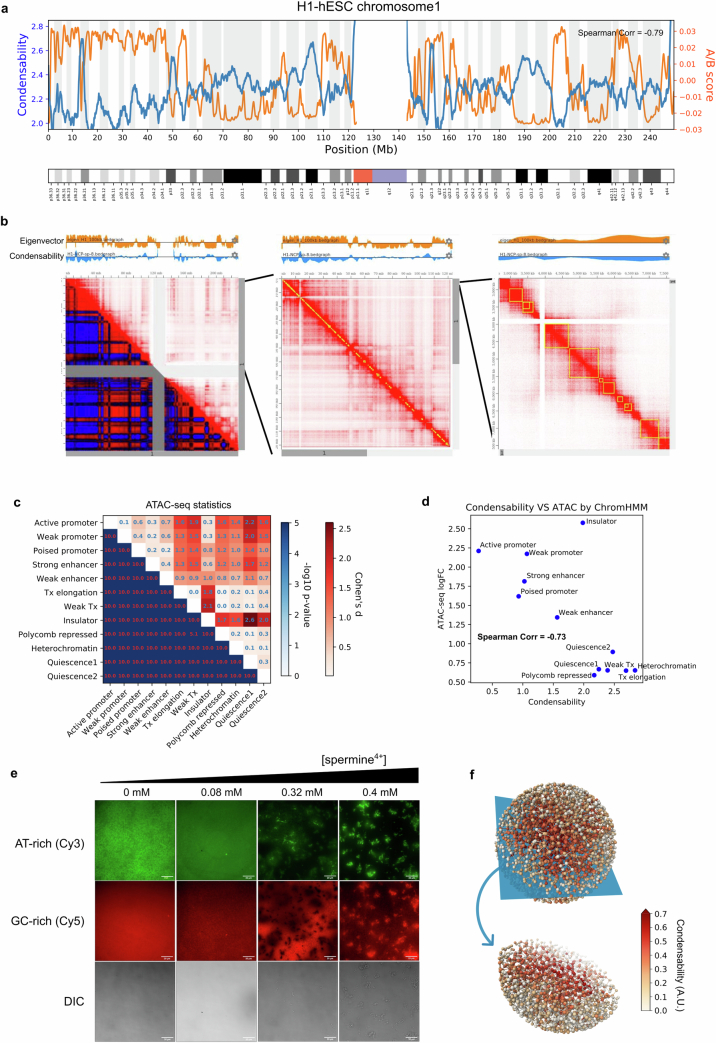
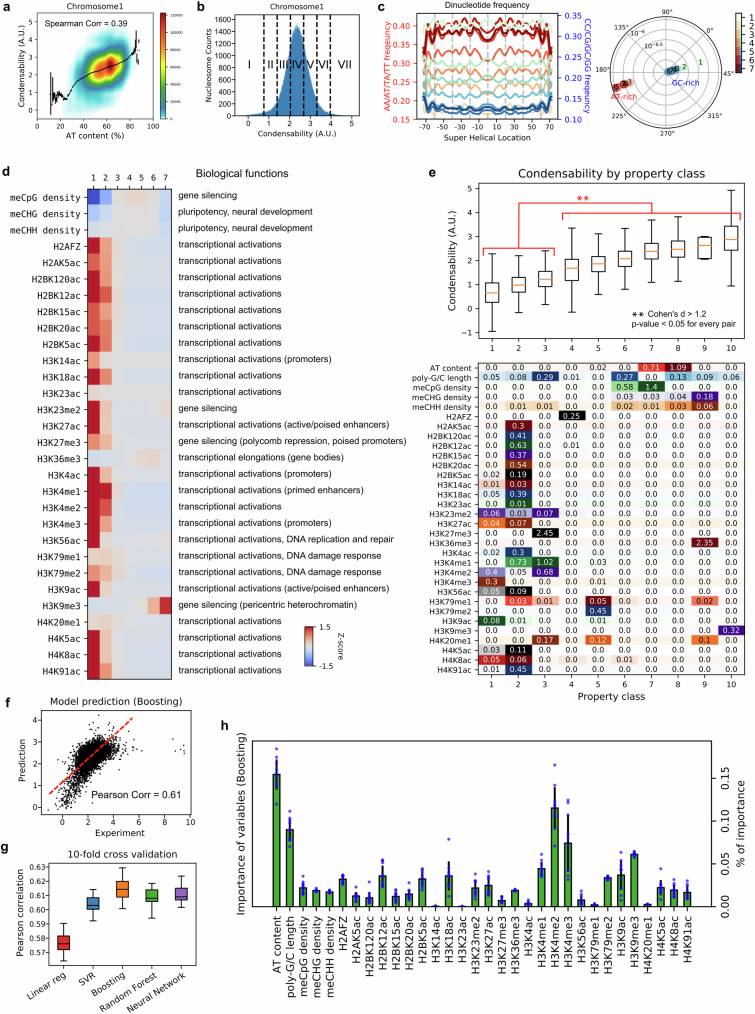
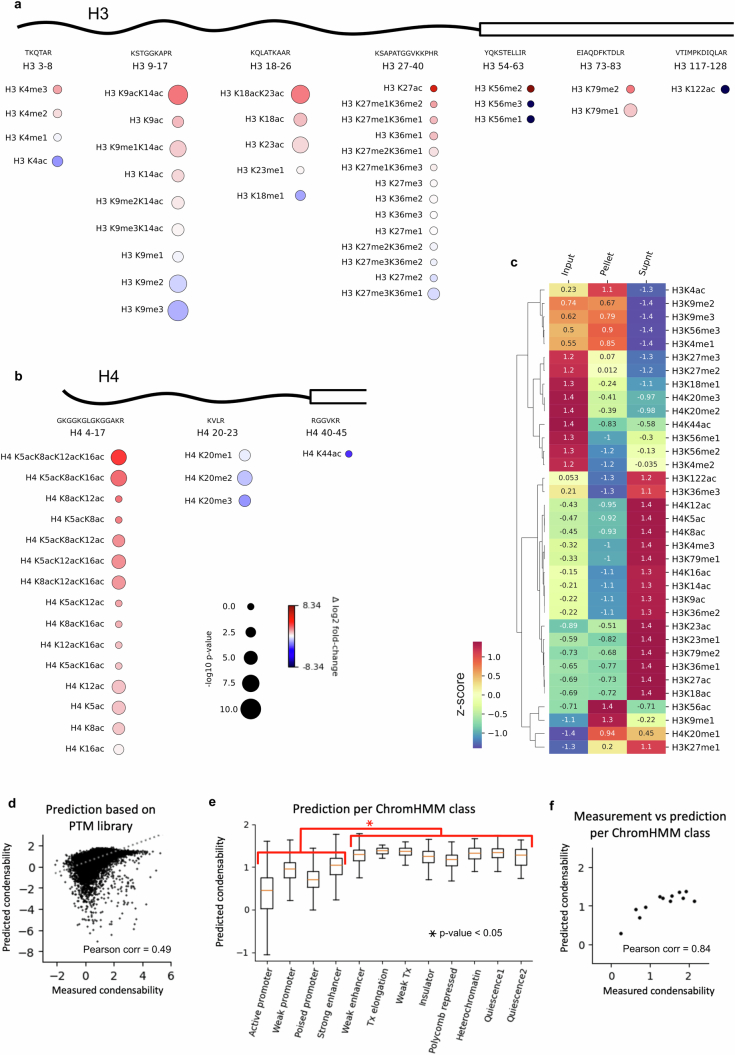
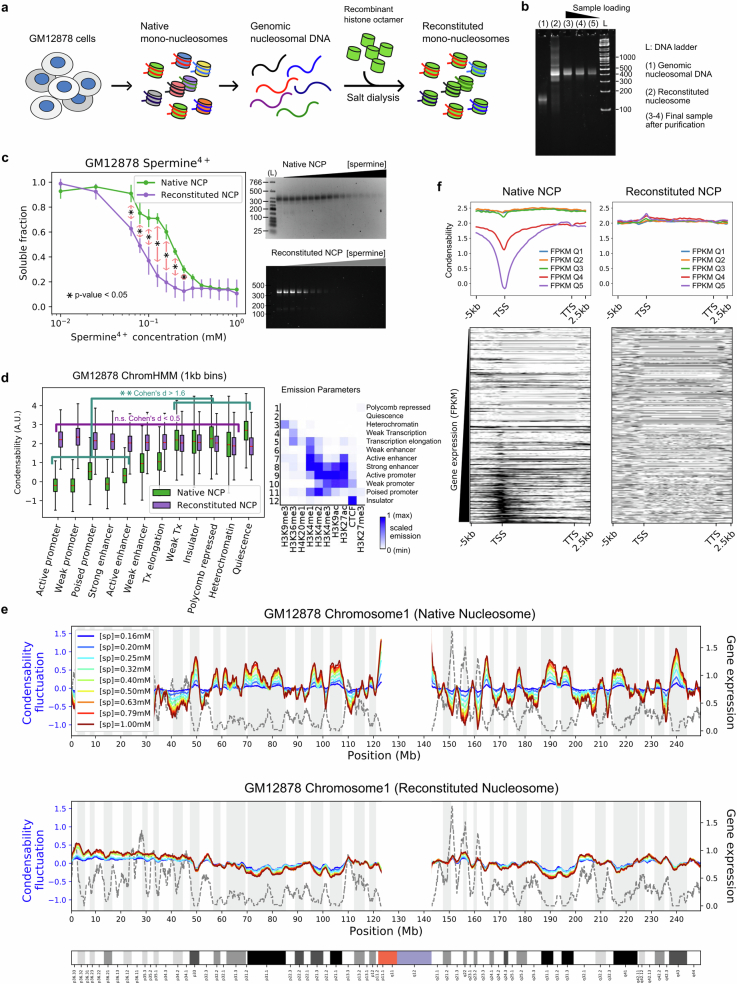
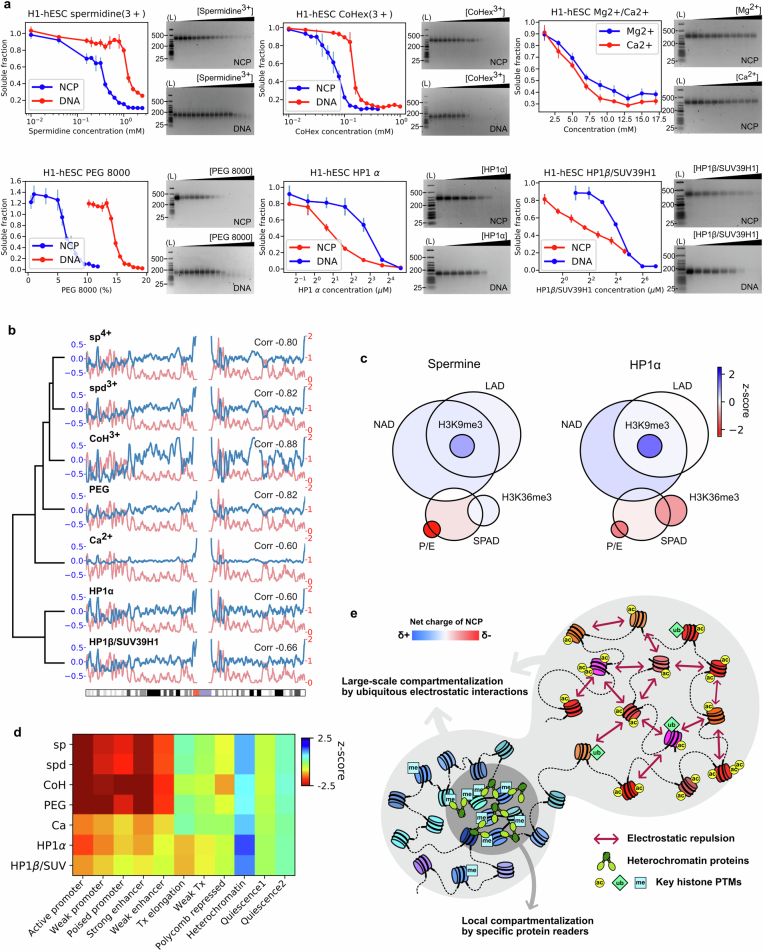
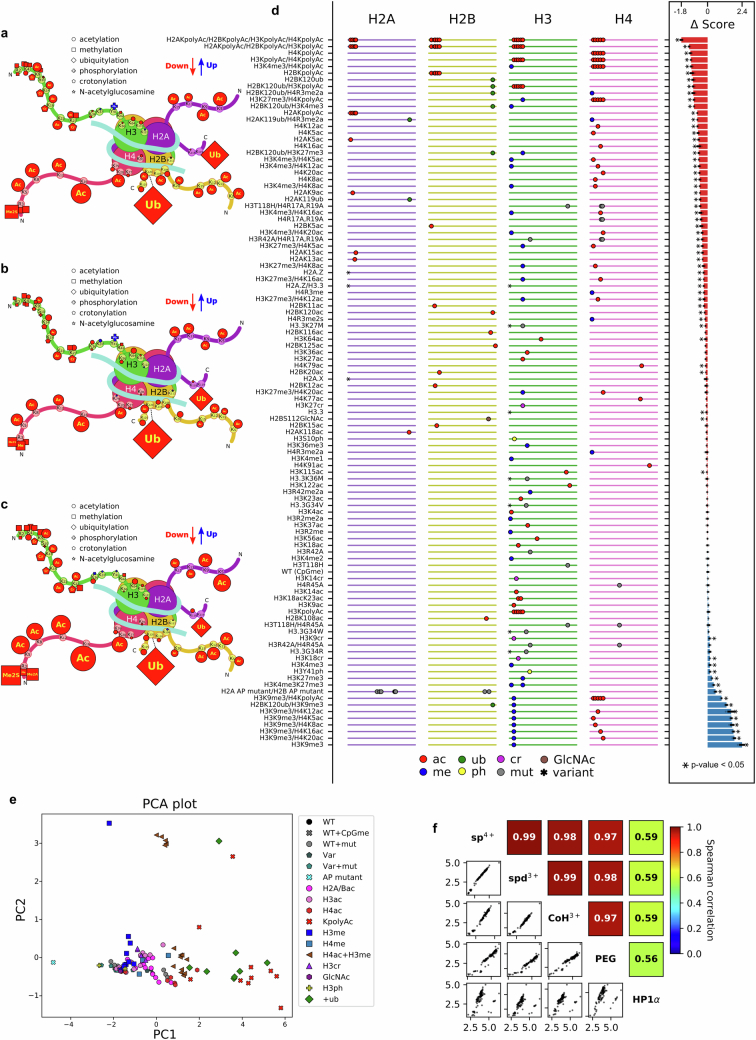
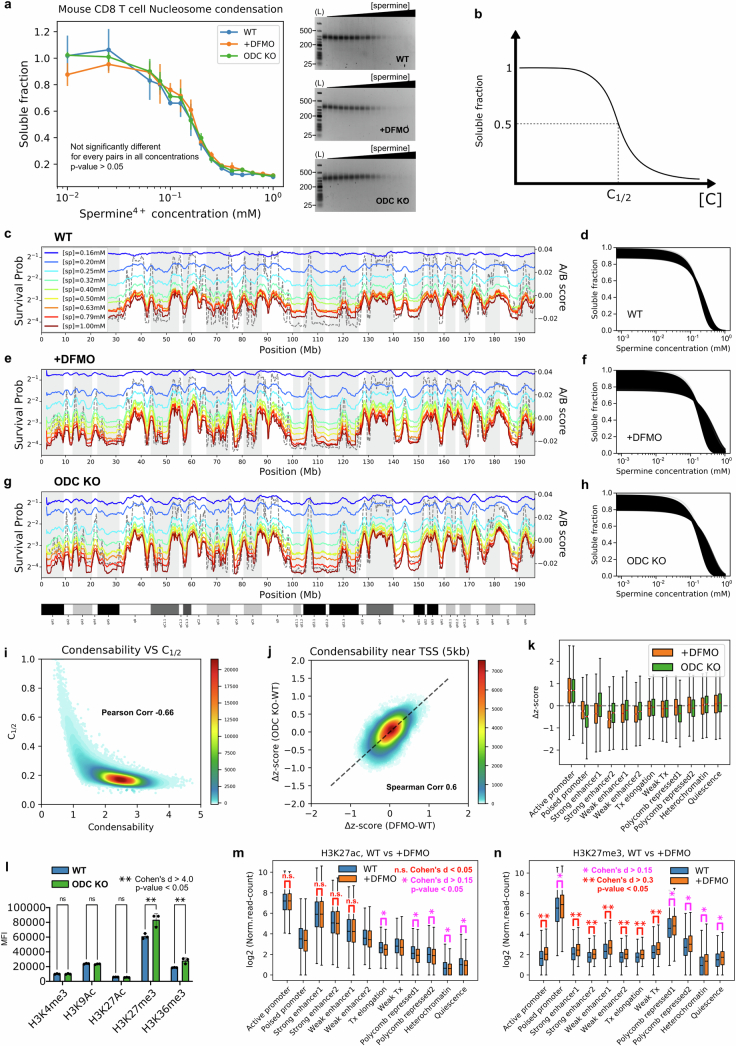
The eukaryotic genome is packed into nucleosomes of 147 base pairs around a histone core and is organized into euchromatin and heterochromatin, corresponding to the A and B compartments, respectively1,2. Here we investigated whether individual nucleosomes contain sufficient information for 3D genomic organization into compartments, for example, in their biophysical properties. We purified native mononucleosomes to high monodispersity and used physiological concentrations of polyamines to determine their condensability. The chromosomal regions known to partition into A compartments have low condensability and those for B compartments have high condensability. Chromatin polymer simulations using condensability as the only input, without any trans factors, reproduced the A/B compartments. Condensability is also strongly anticorrelated with gene expression, particularly near the promoters and in a cell type-dependent manner. Therefore, mononucleosomes have biophysical properties associated with genes being on or off. Comparisons with genetic and epigenetic features indicate that nucleosome condensability is an emergent property, providing a natural axis on which to project the high-dimensional cellular chromatin state. Analysis using various condensing agents or histone modifications and mutations indicates that the genome organization principle encoded into nucleosomes is mostly electrostatic in nature. Polyamine depletion in mouse T cells, resulting from either knocking out or inhibiting ornithine decarboxylase, results in hyperpolarized condensability, indicating that when cells cannot rely on polyamines to translate the biophysical properties of nucleosomes to 3D genome organization, they accentuate condensability contrast, which may explain the dysfunction observed with polyamine deficiency3-5.


Conflict of interest statement

Competing interests: The authors declare no competing interests.

Figures

Fig. 1
Fig. 1. Condense-seq measures genome-wide single-nucleosome condensability.
a, Schematic of the condense-seq workflow. b, The total amount of NCP or nucleosomal DNA remaining in the supernatant was measured by ultraviolet–visible (UV–VIS) spectrometry. Left; graph of three biological replicates, error bars denote standard deviation, and the statistical significance of the difference between DNA and NCP is shown as a P value, obtained by two-sided Welch’s t-test, marked with an asterisk: 0.0034, 0.06, 0.007 and 0.013, respectively. Right, their integrity was checked by 2% agarose gels; lane 1 is a low-molecular-weight DNA ladder, and other lanes are supernatant nucleosomes or nucleosomal DNA after condensation with various spermine concentrations. c, Genome segmentation into chromatin states based on histone PTM ChIP-seq data (right). All mononucleosomes of chromosome 1 were categorized and their condensability distribution for each chromatin state is shown (boxplot in which the centre is the median and the lower and upper bounds are the first and third quartiles, respectively). The P values were computed using two-sided Welch’s t-test comparing the condensabilities between chromatin states. Cohen’s d metric denotes the effect-size comparison over more than 7,000 nucleosomes for each state from two biological replicates (also shown in Extended Data Fig. 2i). d, RNA-seq data (red) and condensability (blue) over the entire chromosome 1 (Spearman correlation is −0.8 in 100-kb bins); positions are given in Mb. e, All genes were grouped into five quantiles according to the transcription level (quantiles 1–5 (Q1–Q5), in order of increasing transcription). Top, condensability, AT content and H3K27ac level along the transcription unit coordinate averaged for each quantile. Bottom, heat maps show the same quantities for each gene, rank ordered by increasing gene expression. f, Promoter condensability (averaged over a 5-kb window around the TSS) for H1-hESC and GM12878. Each gene is coloured according to its relative expression level in the two cell types. Black symbols indicate embryonic stem cell marker genes. FPKM, fragments per kilobase of transcript per million mapped reads; a.u., arbitrary units. Illustration in a created in BioRender (Park, S. (2025) https://BioRender.com/q73ofz1). Source Data
Fig. 2
Fig. 2. 3D genome compartmentalization information is encoded in native mononucleosomes.
a, Nucleosome–nucleosome pair-wise interaction energies (εij) were derived from the condense-seq measurements according to the Flory–Huggins theory. The chromatin polymer simulation was done using these interaction energies to predict the 3D chromatin structure solely from the nucleosome condensability. b, Comparison of contact probability matrix between the Hi-C data of GM12878 (lower-left triangle) and the polymer simulation (upper-right triangle). Bottom, the A/B compartment scores were computed using the Hi-C data or polymer simulation with interaction energies based on the condensability (φ). TAD insulation scores were also computed for the Hi-C data and polymer simulation. Pearson correlations between simulation (Sim) versus experimental (Exp) values are shown (0.8 for A/B compartment score and 0.5 for TAD insulation score comparison). c, Contact probability versus genomic distance from the Hi-C experimental data (orange) and a polymer simulation (blue). The scale factor of exponential fitting is: simulation, a = 1.2; experimental, a = 1.1. d, A/B compartment score versus condensability in 100-kb bins. The black line is a logistic curve fit. e, Condensability versus chromatin accessibility (ATAC-seq fold change) in 1-kb bins (the colour bar represents the number of 1-kb bins in the 2D density plot with 20 × 20 bins). Spearman correlation = −0.46. f, Condensability and ATAC score versus ChromHMM chromatin state for chromosome 1. In the boxplots, the centre is the median and the lower and upper bounds are the first and third quartiles, respectively; P values were computed using a two-sided Welch’s t-test for comparing chromatin openness in different chromatin states; Cohen’s d was calculated for comparing the effect size over more than 100,000 genomic bins for each state from two biological replicates. a.u., arbitrary units. Source Data
Fig. 3
Fig. 3. Identification of the biophysical driving force of chromatin condensation and its genetic and epigenetic determinants.
a, Correlation of condensability scores for the condensing agents tested: spermine (sp4+), spermidine (spd3+), cobalt hexamine (CoH3+), polyethylene glycol (molecular weight 8,000; PEG), Ca2+, HP1α and HP1β/tSUV39H1 (HP1β + tSUV). b, Conditional correlations between condensability and various genetic and epigenetic factors for spermine (top) and HP1α (bottom). c, Condensability profiles versus gene unit position averaged over each of the five quantiles, from weakly expressed to highly expressed genes for spermine (top) and HP1α (bottom). df, Condense-seq results of the PTM library. The effects of single PTMs on nucleosome condensation are depicted in the cartoon structures for spermine (d) and HP1α (f). Each symbol represents a PTM of a specific type, as shown in the key, and its size is proportional to the strength of the effects. The colours of the marks indicate the direction of the effect (red, decrease condensability; blue, increase condensability) compared with the unmodified control. All condensability scores of the PTM library using spermine as a condensing agent are shown (e). The library members were sorted from the lowest to the highest condensability scores from top to bottom. Left, the ladder-like lines represent each histone peptide from the N terminus (left) to the C terminus (right). Each mark on the line indicates the location of PTMs, and the shape of the marks represent the PTM type (Ac, acetylation; Me, methylation; Cr, crotonylation; Ub, ubiquitylation; Ph, phosphorylation; GlcNAc, GlcNAcylation; Mut, amino acid mutation; Var, histone variant). Right, the change in condensability scores of the various modified nucleosomes compared with the control nucleosomes without any PTMs is shown as a bar plot. Asterisks indicate statistical significance (P < 0.05, two-sided Welch’s t-test used over three independent biological replicates) compared with the wild-type control. a.u., arbitrary units. Source Data
Fig. 4
Fig. 4. Polyamine deficiency globally hyperpolarizes but locally disorganizes chromatin condensability.
a, ODC is a key enzyme in polyamine biogenesis and is inhibited by DFMO. b, Mouse CD8+ T cells were isolated and activated in vitro before condense-seq. c, Mononucleosome condensability distribution in various chromatin states classified using ChromHMM. The statistical significance (P value) of the difference between polyamine-deficient conditions versus wild type was computed using two-sided Welch’s t-test, and the effect size, Cohen’s d, over more than 2,000 nucleosomes for each state from two biological replicates, was also computed for comparison. d, Condensation point (c1/2) for chromosome 1 for +DFMO and Odc KO (solid lines show condensability; the dotted line shows the A/B score). e, Condensability over gene units averaged over genes belonging to five quantiles of gene expression. f,g, Gene set enrichment analysis (GSEA) of polyamine-deficient conditions Odc KO (f) and +DFMO (g) compared with the wild type. Genes were ordered by Δz, the z-score of condensability relative to the wild type, shown above. Each row corresponds to the Gene Ontology (GO) biological process (GOBP) strongly enriched for strongly positive or strongly negative Δz values, and genes belonging to that gene set are localized by tick marks. The top 10 positively and negatively enriched GO biological processes are shown. The enriched GO biological processes are clustered by their biological function (red, developmental; green, T cell activation and immunity; orange, mRNA splicing related). h, For each quantile of Δz near the TSS (Q1–Q5), averaged Δz versus transcription unit position is shown for Odc KO versus wild type (top left) and +DFMO versus wild type (top right), and averaged ChIP-seq signals in the wild type are shown for H3K4me3 (bottom left) and H3K27me3 (bottom right). i, Polyamine deficiency induces global hyperpolarization of chromatin compartmentalization but disrupts local chromatin organization (darker colours and the arrows shown for the polyamide deficiency condition depict hyperpolarized compartments), especially at genomic loci enriched with H3K27me3 marks. a.u., arbitrary units. Illustration in b created in BioRender (Park, S. (2025) https://BioRender.com/q73ofz1). Source Data
Extended Data Fig. 1
Extended Data Fig. 1. Intact native mono-nucleosomes obtained by hydroxyapatite (HAP) and size-selective purification.
a, After the HAP purification of MNase-treated chromatin, flow-through and elution samples were run in 2% agarose gel. The 1st lane is NEB 100 bp DNA Ladder (denoted as L). b-e, Mono-nucleosomes were selected through further size-selective purification of HAP elution. HAP elution input and each fraction of size-selection are shown in (b). Each purification step and the quality of final product was validated by running the samples in 2% agarose gel (c), SDS-PAGE gel showing only four histones without other proteins (d), and western blot for histone PTMs (e). (Ladder: NEB Low Molecular Weight DNA ladder is used for (c) and Thermo Scientific PageRuller used for (d-c)). f, Schematics of single molecule FRET analysis using a FRET pair (green for donor, red for acceptor) conjugated to DNA designed to show a FRET decrease upon DNA unwrapping (left). Single molecule FRET histograms (right) showed that there is no detectable unwrapping at the spermine concentration relevant to condense-seq (up to 2 mM). At 0.5 M spermine, DNA is unwrapped. g, Visualization of nucleosome condensates via total internal reflection fluorescence microscopy of Cy3 conjugated to H2A. Biotin (empty circle) is used to capture the nucleosomes on a passivated neutravidin-coated surface after incubation with and without 0.4 mM spermine prior to capture. Data show that 0.4 mM spermine is sufficient to induce nucleosome condensates in vitro. h, To confirm integrity of nucleosomes during polyamine-induced condensation, we ran a gel of nucleosome core particles (NCPs) before condensation (left lane in each category) and after solubilization following condensation in the presence of 0.5 mM spermine (right lane). The middle lanes show that most of NCPs have been condensed at 0.5 mM spermine. Resolubilized NCPs collected from the condensed pellet showed the same migration pattern as the input NCPs, demonstrating their integrity for GM12878 reconstituted NCPs, GM12878 native NCPs and E14 mESC NCPs. The nucleosome integrity was checked with similar results from three independent experiments. Source Data
Extended Data Fig. 2
Extended Data Fig. 2. Computational pipeline and data quality controls for condense-seq.
a,b, The pipeline of Condense-seq analysis is composed of (i) reads alignment by Bowtie2, (ii) coverage calculations, (iii) mono-nucleosome peak calling for each local maximum of input coverage, (iv) absolute nucleosome count estimation using coverage area and soluble fraction changes from the titration data of the UV-VIS spectrometry measurement, and (v) compute condensability score as negative log of soluble fraction after condensation for each nucleosome. c, For quality control, we checked that the length distribution of nucleosomal DNA of nucleosomes remaining in the supernatant is mostly around at 150 bp for all concentrations of spermine used. (d) Nucleosome number fluctuation vs genomic position in Chr 1. The input ([sp]=0 mM, red curve) shows mostly flat values, showing that there is no strong bias in the input. NCPs remaining in the supernatant show progressively strong bias at higher [sp]. e, The periodicity of AT-rich versus GC-rich dinucleotides, the hallmark indicator of nucleosome peaks, supports the nucleosomal source of DNA analyzed. f, Condensability is more highly correlated with the supernatant nucleosome number changes than the input (Spearman correlation coefficient −0.79 vs 0.14). g, Estimated NCP number for various ChromHMM chromatin states for input vs supernatant ([sp] = 0.79 mM). Analyses in (d), (f), and (g) collectively show that condensability score is mostly determined by the degree of how much nucleosomes are condensed, not by the variations in the input NCPs. h, Condensability determined via nucleosome peak calling and regular sliding windows gave almost identical results for various ChromHMM chromatin states (p-value > 0.05 and Cohen’s d < 0.1 for every comparison). All boxplot centers represent median, and the lower/upper bounds is the 1st/3rd quartile of data. i, The statistical significance (p-value using t-test) and effect size (Cohen’s d) are computed for condensability difference between each pair of ChromHMM states (data in Fig. 1c and Extended Data Fig. 2h). Numeric values are shown for each cell for Cohen’s d (top right triangle) and -log10 p-value (bottom left triangle). j, Correlations of condensability values between replicates. All statistics were computed via two-sided Welch’s t-test over more than 7000 nucleosomes (g-i) or 40000 genomic bins (h) of each state from two biological replicates. Source Data
Extended Data Fig. 3
Extended Data Fig. 3. Condensability measurements of human embryonic stem cell (H1-hESC) and mouse embryonic stem cell (E14 mESC).
a, Comparison between condensability (blue) and transcription level (red) along all chromosomes of H1-hESC. b, Snapshot of UCSC genome browser for the condensability profile of H1-hESC along with many other cis-regulatory elements. c, All genes were grouped into five quantiles according to the transcription level of H1-hESC (quantile 1 through 5 for increasing transcription). Condensability, methylated CpG density, and H3K36me3 along the transcription unit coordinate averaged for each quantile (left column). Views zoomed around TSS are shown for condensability, H3K4me3 and H3K9ac (right column). d, Native nucleosomes are prepared from mouse embryonic stem cells (E14 mESC) and condensed by spermine titration (the titration curve is the mean value of three replicates and error bar represents the standard deviation). NEB Low Molecular Weight DNA ladder was used for the first lane as marker. e, Genome segmentation into chromatin states based on histone PTM ChIP-seq data (right). All mono-nucleosomes of chromosome 1 were categorized using ChromHMM, and their condensability distribution for each chromatin state is shown (boxplot: the center is median and the lower/upper bound is the 1st/3rd quartile of data). Statistically significant differences between ChromHMM states are noted. The statistics were computed via two-sided Welch’s t-test over more than 400 nucleosomes of each state from two biological replicates. f. Promoter condensability (averaged over 10 kb window around TSS) for E14 mESC and mCD8 T cells. Each gene is colored according to their relative expression levels in the two cell types. Black symbols are for embryonic stem cell marker genes. g, All genes in chromosome 1 were grouped into five quantiles according to the transcription level (quantile 1 through 5 for increasing transcription) and condensability along the transcription unit coordinate averaged for each quantile is shown. Source Data
Extended Data Fig. 4
Extended Data Fig. 4. Spatial separation of molecules promoted by condensability difference to compartmentalize the genome.
a, b, H1-hESC condensability (blue) and A/B compartment scores based on Micro-C data (orange) in mega base-pair resolution of chromosome 1 (a) and finer resolution (b). c, Statistical significance (p-value using t-test) and effect size (Cohen’s d) were computed for ATAC-seq signal fold change differences between each pair of ChromHMM chromatin states for data shown in Fig. 2f. The statistics were computed via two-sided Welch’s t-test over more than 100000 genomic bins of each state from two biological replicates. d, ATAC-seq fold change vs condensability for various ChromHMM states shows an anticorrelation (Spearman correlation coefficient is –0.73). e, PCR amplified AT-rich (Cy3 labeled) and GC-rich (Cy5 labeled) DNAs were mixed and condensed in spermine concentrations indicated. For each condition, DNA condensates were imaged using wide-field microscope. As spermine concentration increased, AT-rich DNAs formed a condensed core first, and GC-rich DNAs condensed over the AT-rich core at higher spermine concentrations, promoting the spatial separation between AT-rich versus GC-rich condensates. A similar result was observed from two independent experiments. f, Chromosome polymer simulation with condense-seq data using spermine as the only input (GM12878, chr12) shows that highly condensable chromatin is compacted into the core and the rest is excluded to generate spatially separate compartments. Source Data
Extended Data Fig. 5
Extended Data Fig. 5. Deciphering the genetic and epigenetic determinants of genomic nucleosome condensation.
a, Scatter plot of the condensability of mono-nucleosomes in chromosome 1 and the AT contents of corresponding nucleosomal DNA. b, The nucleosome population was partitioned into seven partitions, from low to high condensability. c, The periodicity of AT-rich versus GC-rich dinucleotides. Average frequency of different dinucleotides vs position relative to nucleosome dyad for each of the seven partitions in (b) is shown (left). The amplitude and phase of dinucleotide frequency fluctuations vs position were computed using Fourier transformation and represented in a polar plot (right, radius: amplitude, angle: phase). d, The enrichment analysis of all DNA methylation and histone ChIP-seq data available in ENCODE over different condensability partitions from low to high (1–7 partitions in b). e, The genetic and epigenetic features of all mono-nucleosomes in chromosome 1 were linearly decomposed into 10 property classes by non-negative matrix factorization. Each property class has a specific combination of features, as shown in the matrix (lower panel). Every nucleosome was assigned to a representative property class with the largest contribution. After clustering, nucleosome condensabilities were plotted as boxplot for each class (upper panel) and p-values & Cohen’s d were computed for condensability comparison across classes. In the boxplot, the center represents the median and the lower/upper bound shows the 1st/3rd quartile of data. The statistics were computed via the two-sided Welch’s t-test over 7 to 500000 nucleosomes of each state from two biological replicates. f-h, Multivariate linear regression (linear reg), Supported Vector Machine regression (SVM), gradient boosting regression (Boosting), random forest regression (Random Forest), and neural networks were used to predict nucleosome condensability. All showed similar correlations between experimental values and predictions in 10 sampling replicates of 10-fold cross-validation (f,g). The importance of genetic–epigenetic features in prediction was computed using the boosting method shown as the bar plot of means from the 10 sampling replicates of10-fold cross validation with error bar as the standard deviation (h). Source Data
Extended Data Fig. 6
Extended Data Fig. 6. Mass spectrometry identification of histone PTM marks with biased enrichment during native mononucleosome condensation experiments.
a,b, Histone PTM marks detected in each histone H3/H4 peptide are shown. Its relative enrichment difference compared with the unmodified peptide is represented by color (red: more enriched in supernatant, blue: more depleted in supernatant) and its signification is represented by the size of bubble (-log p-value). The statistics were computed via the two-sided Welch’s t-test over 4 technical replicates. c, Combinatorial histone PTM enrichment data was aggregated into single PTM modifications, and the relative enrichment in each phase of condensation (input/pellet/supernatant) is shown in the z-score heat map. d-f, Only using the synthetic histone PTM library condensability data, the genomic nucleosome condensability of H1-hESC were predicted using linear regression model. The prediction shows a moderate correlation with experimental data at the single-nucleosome level (d), and could qualitatively reproduce the pattern of condensability change across different ChromHMM chromatin states (boxplot: the center is median and the lower/upper bound is the 1st/3rd quartile of data, statistics: two-sided t-test used for the comparison with 50–8000 nucleosomes of each ChromHMM state) (e-f). Source Data
Extended Data Fig. 7
Extended Data Fig. 7. Condense-seq measurement of native and reconstituted mono-nucleosomes from GM12878 cells and the comparison between nucleosome condensability and their chromatin states.
a, Native mono-nucleosomes were purified from GM12878 cell line. For reconstituted nucleosomes, DNA was isolated and purified to size homogeneity before reconstitution with recombinant histone octamers without any PTMs, and was further purified. b, Pure reconstituted nucleosomes used in the condensation experiment are shown in 6% agarose gel. Samples included isolated genomic DNA from GM12878, the reconstituted nucleosomes, and final product after size-selection. (Ladder: NEB 100 bp DNA ladder used). c, Condensation was induced by adding spermine. Soluble fractions were measured using UV-VIS spectroscopy (left, the titration curves are plotted as the mean of three replicates with error bars as the standard deviation, and the asterisk represent the significantly different titration points when the p-value < 0.05 from the two-sided Welch’s t-test from three replicates, and p-values are 0.006, 0.016, 0.016, 0.005, 0.003, 0.017, and 0.05 respectively) and ran in the 2% agarose gel (right). (Ladder: NEB Low Molecular Weight Ladder used). d, Native and reconstituted nucleosomes were grouped according to their ChromHMM states based on the combination of various PTMs Chip-seq data. Their condensabilities are shown in box plot for each chromatin state (green: native nucleosome, purple: reconstituted nucleosome), and the effect size of differences (Cohen’s d) across the chromatin states was computed over more than 4000 nucleosomes of each state from two biological replicates (boxplot: the center is median and the lower/upper bound is the 1st/3rd quartile of data). e, The adjusted condensability score (after standardized by only mean, not variation, to compute the fluctuations) was plotted over human chromosome 1 for different spermine titration points (colored lines) and compared with the gene expression level (black dotted line). f. The condensability profiles of native and reconstituted nucleosomes from TSS to TTS for five quantiles based on the gene expression levels in the GM12878 cell line. Source Data
Extended Data Fig. 8
Extended Data Fig. 8. Condense-seq of H1-hESC native mono-nucleosomes using various condensing agents.
a, The soluble fraction of nucleosomes was measured by titrating the various condensing agents other than spermine, including spermidine, cobalt-hexamine, magnesium/calcium, PEG 8000, and HP1α, HP1β with SUV39H1 complex. The titration curves were plotted as the mean of three replicates with error bar as the standard deviation. (Ladder: NEB Low Molecular Weight DNA ladder used for the first lane of gels) b, Condensability scores were plotted over chromosome 1 (blue) and the Spearman correlation coefficient were computed compared with the gene expression level (red). Hierarchical clustering of the condensability profile shows that all ionic condensing agents (spermine/spermidine/cobalt-hexamine/PEG/calcium) are clustered together but other protein-based condensing agents (HP1α and HP1β) are clustered in a separate group. c, d, Comparison of condensability scores for different condensing agents across various nuclear compartments (c, LAD: lamina-associated domain, NAD: nucleolar-associated domain, SPAD: nuclear speckle-associated domain, P/E: promoter or enhancer) and chromatin states (d). e, Hypothetical hierarchal model of the biophysical driving force of chromatin organization: At a large scale, chromatin is compartmentalized via ubiquitous charge–charge interactions, but specific heterochromatin proteins are involved to generate local compartments that are smaller in scale but more specific function directed. Source Data
Extended Data Fig. 9
Extended Data Fig. 9. Summary of histone PTM effects on the nucleosome condensation by various condensing agents on the synthetic nucleosome library with PTM marks.
The effects of single PTMs on nucleosome condensation are depicted by the cartoons (a: spermidine, b: cobalt-hexamine, c: PEG 8000 as the condensing agent). Each symbol represents different types of PTMs as shown in the legend, and the size is proportional to the strength of effects. The colors of the marks indicate the direction of the effect (red: decreases condensation, blue: increases condensation) compared with the unmodified control. d, All condensability scores of the PTM library using HP1α as a condensing agent are summarized in the ladder bar plot. The library members are sorted from the lowest to the highest condensability scores from top to bottom. On the left panel, the ladder-like lines represent each histone subunit peptide from N-terminal (left) to the C-terminal (right). Each mark on the line indicates the location of the PTMs and the shape of the marks represents the PTM type (ac: acetylation, me: methylation, cr: crotonylation, ub: ubiquitylation, ph: phosphorylation, GlcNAc: GlcNAcylation, mut: amino acid mutation, var: histone variant). On the right panel, differences in the condensability score compared with the unmodified control are shown as bar plots for each member of the library. The asterisk on the bar-plot represents statistically significant (p-value < 0.05, and the two-sided Welch’s t-test used over three biological replicates) values compared to the unmodified controls. e, PCA analysis was conducted by combining the condensability scores of all five condensing agents (spermine/spermidine/cobalt-hexamine/PEG 8000/HP1α) into the five-dimensional state vector. In the PCA plot, each member of the library is represented by a symbols according to categories such as canonical wild-type nucleosome (WT), wild type with CpG methylation (WT+CpGme), mutations on wild type (WT+mut), nucleosome with histone variants (Var), mutations on histone variants (Var+mut), Acidic patch mutants (AP mutants), and nucleosomes with acetylation on H2A/B dimer (H2A/Bac), acetylation on H3 (H3ac), acetylation on (H4ac), having poly-acetylation (KpolyAC), methylation on H3 (H3me), methylation on H4 (H4me), acetylation on H4 and methylation on H3 (H4ac + H3me), crotonylation on H3 (H3cr), GlcNAcylation (GlcNAc), phosphorylation on H3 (H3ph), and ubiquitylation (+ub), all of which are shown in the figure legend. f, Comparison of condensability scores across different condensing agents. Scatter plots of condensability across different condensing agents are shown in the lower triangle, and the corresponding Spearman’s correlations are shown in the upper triangle of the matrix. Source Data
Extended Data Fig. 10
Extended Data Fig. 10. Condense-seq measurements of nucleosomes purified from mouse CD8+ T cells.
a, Soluble fractions were measured via UV-VIS spectroscopy and run in 2% agarose gel after condensation in various spermine concentrations (the titration curves were plotted as the mean of three replicates with error bar as the standard deviation, and there were no significant differences between wild-type/DFMO-treated/ODC-KO as shown p-value > 0.05 for any-pair). (Ladder: NEB Low Molecular Weight DNA ladder used for the first lane of gels) b, Condensation point (c1/2) is defined by the concentration of condensing agent when the soluble fraction is half the input, so it is reversely correlated with condensability score. ch, Soluble fractions of nucleosomes in various spermine concentrations were calculated and plotted over chromosome 1 in 10 kb resolution. C1/2 was computed for each bin after fitting the soluble fraction change with a logistic function as shown fitting curves of all bins (d, f, h), and polyamine deficient conditions show broader distribution of condensation points. (c, d: wild type control, e, f: +DFMO, g, h: ODC KO) i, Condensability point (c1/2) has inverse relationship with condensability scores of nucleosomes in mouse CD8 + T cells. j, The scatter plot of Δ z-score of condensability near TSS shows a high correlation between +DFMO and ODC KO. k, The Δ z-score of condensabilities is computed as the difference between the standardized condensability of +DFMO or ODC KO conditions and the wild type control and then categorized into the corresponding ChromHMM chromatin states over more than 300 nucleosomes of each state from two biological replicates (boxplot: the center is median and the lower/upper bound is the 1st/3rd quartile of data). Flow cytometry data show the global changes of PTM marks in ODC knockout (ODC KO) CD8+ T cells vs wild type (WT) expressed as mean intensity fluorescence (MFI) from three biological replicates (p-values were computed via the two-sided Welch’s t-test). (l) and also further verified using calibrated histone ChIP-seq for H3K27ac (m) and H3K27me3 marks (n) (the statistics were computed via the two-sided Welch’s t-test over more than 10000 nucleosomes of each state from three biological replicates). Source Data

Update of

Similar articles

Cited by

References

    1. Yu, M. & Ren, B. The three-dimensional organization of mammalian genomes. Annu. Rev. Cell Dev. Biol.33, 265–289 (2017). - PMC - PubMed
    1. Lieberman-Aiden, E. et al. Comprehensive mapping of long-range interactions reveals folding principles of the human genome. Science326, 289–293 (2009). - PMC - PubMed
    1. Puleston, D. J. et al. Polyamine metabolism is a central determinant of helper T cell lineage fidelity. Cell184, 4186–4202 (2021). - PMC - PubMed
    1. Lee, M.-S. et al. Ornithine aminotransferase supports polyamine synthesis in pancreatic cancer. Nature616, 339–347 (2023). - PMC - PubMed
    1. Holbert, C. E., Cullen, M. T., Casero, R. A. Jr & Stewart, T. M. Polyamines in cancer: integrating organismal metabolism and antitumour immunity. Nat. Rev. Cancer22, 467–480 (2022). - PMC - PubMed

LinkOut - more resources