. 2025 Jul;643(8071):437-447.
doi: 10.1038/s41586-025-08952-w. Epub 2025 May 7.

Heterogeneous pericoerulear neurons tune arousal and exploratory behaviours

Affiliations

Heterogeneous pericoerulear neurons tune arousal and exploratory behaviours

Andrew T Luskin et al. Nature. 2025 Jul.

Abstract

As the primary source of noradrenaline in the brain, the locus coeruleus (LC) regulates arousal, avoidance and stress responses1,2. However, how local neuromodulatory inputs control LC function remains unresolved. Here we identify a population of transcriptionally, spatially and functionally diverse GABAergic (γ-aminobutyric acid-producing) neurons in the LC dendritic field that receive distant inputs and modulate modes of LC firing to control global arousal levels and arousal-related processing and behaviours. We define peri-LC anatomy using viral tracing and combine single-cell RNA sequencing with spatial transcriptomics to molecularly define both LC noradrenaline-producing and peri-LC cell types. We identify several neuronal cell types that underlie peri-LC functional diversity using a series of complementary neural circuit approaches in behaving mice. Our findings indicate that LC and peri-LC neurons are transcriptionally, functionally and anatomically heterogenous neuronal populations that modulate arousal and avoidance states. Defining the molecular, cellular and functional diversity of the LC and peri-LC provides a roadmap for understanding the neurobiological basis of arousal, motivation and neuropsychiatric disorders.


Conflict of interest statement

Competing interests: Two patents on polony gel stamping and Pixel-seq have been filed by the University of Washington and TopoGene Inc. L. Gu and L.S. are co-founders of TopoGene, which manufactures polony gels used in our approaches herein. The other authors declare no competing interests.

Figures

Extended Data Fig. 1.
Extended Data Fig. 1.. In vitro and in vivo identification and characterization of pericoerulear GABAergic neurons.
(a) Viral schematic for rabies tracing of monosynaptic inputs to peri-LCGABA neurons. Starter cells in peri-LC express TVA-mCherry and rabies-GFP (scale bar: 100 μm in LC; 20 μm in input regions). One mouse out of four injected showed starter cell expression. (b) Electrically evoked α2-mediated outward current recorded from LCNE neuron. (c) 78% of LCNE neurons displayed measurable fast IPSCs, though the success rate appeared dependent on injection specificity as 6 of 14 injection sites had 100% response rate (each data point represents one hemisphere, line shown is median; injections that were completely off target and/or had 0% response rate were excluded). (d) Properties of peri-LC GABA neurons. ChR2-expressing peri-LC neurons were identified by the presence of eYFP expression and a steady state response to a 150 ms light pulse (not shown). Representative trace of a current clamp recording with steps of 200 pA current injection. (e) Peri-LCGABA neuron firing rate upon 500 ms current injection (mean values ± SEM). n=11 cells. (f) Peri-LCGABA neuron capacitance, membrane resistance, and resting membrane potential (RMP) (mean values ± SEM). n=24 cells (capacitance), 23 cells (membrane resistance), and 13 cells (RMP). (g) Representative LCNE cell-attached trace of a single sweep (top) and an overlay of 10 sweeps (bottom). Blue hash marks indicate light stimulation (1 ms pulses, 20 Hz, 1s). (Right top) Time course of action potential firing rate for an average of 6 cell-attached recordings with a pulse train for 1 s (20 Hz, 1 ms pulses). (Right bottom) Firing rate before (mean=0.77 Hz), during (0.13 Hz), and after (1.45 Hz) photostimulation. Periods of comparison were 500ms before, middle-to-end, and after stimulation. p=0.0266 for pre-stimulation vs. post-stimulation periods by Wilcoxon signed-rank test; p=.0185 for baseline vs. stimulation period and p<0.0001 for stimulation vs. rebound period by Dunn’s multiple comparison test. (h) (Left) Average amplitudes of optically evoked IPSCs normalized to baseline (n=5 cells) during the wash on of DNQX (10μM) followed by picrotoxin (100μM). (Right) Representative traces showing PSCs during 5 min of baseline (black), 5–10 min post DNQX (red), and 5–10 min post picrotoxin (green). p=0.5721 for baseline vs. DNQX, p=0.0017 for baseline vs. picro, and p=0.0064 for DNQX vs. picro by Tukey’s multiple comparisons test. (i) Peri-LCGABA neurons increase activity during 30s exposure to 2MT. (j) Peri-LCGABA neurons increase activity during 30s exposure to odor of opposite-sex mice. (k) Peri-LCGABA neurons increase activity during 30s exposure to peppermint oil odor. (l) Summary of exploration in open-field test (OFT). n=12 trials; 2 mice that did not enter center were excluded from analysis. (m) Peri-LCGABA neuronal activity increases upon open arm entry in an elevated zero maze (EZM). n=14 trials. (n) Peri-LCGABA neurons are not affected by the consumption of highly-palatable food. (o) Peri-LCGABA neurons decrease activity during attempts to eat a false food pellet. (p) Summary of peri-LCGABA fiber photometry experiments. Bars represent change in activity before vs. after events. Left, in order from top to bottom, p<0.0001 (n=56 exposures), p=0.0027 (n=44 exposures), p<0.0001 (n=84 exposures), p=0.2682 (n=84 exposures), p<0.0001 (n=368 transitions), p=0.4499 (n=368 transitions), p=0.0002 (n=133 interactions), p=0.2539 (n=141 interactions), p<0.0001 (n=200 bouts), and p=0.0009 (n=198 bouts). Right, in order from top to bottom, p<0.0001 (n=44 exposures), p=0.0168 (n=56 exposures), p<0.0001 (n=56 exposures), p=0.0912 (n=44 bouts), p=0.4514 (n=86 transitions), p=0.0059 (n=81 transitions), p=0.4234 (n=65 bouts), p=0.0006 (n=66 bouts), p<0.0001 (n=62 bouts), and p<0.0001 (n=57 bouts), by paired two-tailed t-test. Periods of comparison were 30s for odor experiments and air flow; 20s for shock and conditioned sound; 5s for OFT, EZM, and novel/familiar object interaction; and 10s for feeding. N=14 animals for photometry experiments, 12 for OFT, and 11 for 2-PE, air flow and opposite-sex odor. *p < 0.05, ** p<0.01, *** p<0.001, ****p<0.0001 by paired two-tailed t-test. Error bars and shading indicate SEM.
Extended Data Fig. 2.
Extended Data Fig. 2.. Selective manipulation of pericoerulear GABA neurons modulates physiological arousal and exploratory behaviors.
(a) Schematic and image of pupil dilation experiment. (b) Photostimulation did not cause a real-time place preference. (c-e) Photostimulation (2 mW, 4 Hz, 5 ms pulse width) affected movement, but not anxiety-like behavior, in open-field test (OFT) (c) (p=0.5403 (time in center) and p=0.0004 (velocity)), elevated zero maze (EZM) (d) (p=0.7184 (time in open) and p<0.0001 (velocity)), and light-dark box (e) (p=0.4567 (time in light) and p=0.0028 (velocity)). (f) Photostimulation (2 mW, 4 Hz, 5 ms pulse width during 20 s presentation of cue during fear conditioning) did not affect acquisition of fear response. (g) Photostimulation (2 mW, 4 Hz, 5 ms pulse width) did not affect novel object interaction. (h) Photostimulation (2 mW, 4 Hz, 5 ms pulse width) did not affect food consumption in food-deprived state. (i) Animals did not preferentially nose-poke to receive photostimulation (2 mW, 4 Hz, 5 ms pulse width). (j, k) Chemogenetic inhibition (5 mg/kg CNO) of peri-LCGABA neurons caused behavioral arrest in EZM (j) (p=0.1555 (time in open) and p=0.0378 (velocity)) and open-field test (k) (p=0.1248 (time in center) and p=.0231 (velocity)). (l) Chemogenetic inhibition (1 mg/kg CNO) of peri-LCGABA neurons decreased movement in OFT (p=0.0231). (m) Chemogenetic inhibition (1 mg/kg CNO) of peri-LCGABA neurons did not affect movement in EZM. *p < 0.05, ** p<0.01, ***p<.001, ****p<0.0001 by unpaired two-tailed t-test. Error bars indicate SEM. Dots represent independent measurements across different animals.
Extended Data Fig. 3.
Extended Data Fig. 3.. Single-cell RNA-sequencing of locus coeruleus and pericoerulear region.
(a) Violin plots show expression of canonical marker genes in cells clustered by principal component analysis (PCA) based on transcriptional profile. The 15 neuronal clusters are shown in orange. (b) Genes detected per cell type. (c) Unique molecular identifiers (UMIs) per cell type. (d) Percent mitochondrial genes per cell type. (e) Genes detected per neuronal cell type. (f) Unique molecular identifiers (UMIs) per neuronal cell type. (g) Percent mitochondrial genes per neuronal cell type. (h) Cluster tree shows relationships between clustered cell types. (i,j) Dot plots of n=12,278 neurons are shown, with neuronal clusters on the y-axis and gene transcripts on the x-axis. Size of circles corresponds to percent of cells in the cluster expressing a specific transcript, while color intensity corresponds to the relative expression level of the transcript. Plots correspond to transcripts related to neuropeptides (i) and neuropeptide receptors (j). (k) Representative image for in situ hybridization of Dbh and VGLUT1 (Slc17a7) mRNA. Scale bar is 100 μm. (l,m) (Top) Elbow plots show the number of principal components (PC) versus standard deviation and (bottom) silhouette scores show co-clustering performance for (l) peri-LC inhibitory neurons (Slc32a1, Gad1, Gad2) and (m) LCNE neurons (Dbh, Th). Dots represent clusters at each resolution; boxes represent median scores with 95% confidence interval. (n) Graph shows the frequency of neuropeptide-expressing peri-LC inhibitory neurons. (o) Graph shows the frequency of neuropeptide receptor-expressing LCNE neurons. (p-q) Venn diagrams show the overlap of Penk-, Pnoc-, and Tac1-expressing cells among cells that express (p) or do not express (q) GABAergic markers.
Extended Data Fig. 4.
Extended Data Fig. 4.. Neuromodulatory, signaling, structural, and disease-related genes in single-cell RNA sequencing of all peri-LC neurons (n=12,278).
(a) Dot plot of neuropeptide and receptor (left), and neurotransmitter reuptake (right) genes across all neuron clusters. Circle size corresponds to percent of cells in the cluster expressing the specific transcript, while color intensity corresponds to its relative expression. (b) Dot plot of genes associated with cannabinoid signaling (left), hormone signaling (middle), and gap junctions (right) across all neuron clusters. (c) Dot plot of genes associated with development (left), and morphology and adhesion functions (right) across all neuron clusters. (d) Dot plot of genes associated with pathology across all neuron clusters.
Extended Data Fig. 5.
Extended Data Fig. 5.. Neuromodulatory, signaling, and structural genes in single-cell RNA sequencing of LCNE neurons (n=1,324).
(a) Cartoon of the sampled locus coeruleus noradrenergic neurons (left). Dot plot of neuronal subtype (left), neuropeptide (middle), and receptor (right) genes across LCNE neuron clusters. Circle size corresponds to percent of cells in the cluster expressing the specific transcript, while color intensity corresponds to its relative expression. (b) Dot plot of genes associated with neurotransmitter reuptake (left), hormone signaling (middle), and cannabinoid signaling (right) across LCNE neuron clusters. (c) Dot plot of genes associated with gap junctions across LCNE neuron clusters. (d) Dot plot of genes associated with morphology and adhesion functions and development across LCNE neuron clusters.
Extended Data Fig. 6.
Extended Data Fig. 6.. Neuromodulatory, signaling, and structural genes in single-cell RNA sequencing of peri-LCGABA neurons (n=11,182).
(a) Cartoon of the sampled peri-LC inhibitory neurons (left). Dot plot of neuronal subtype (left), neuropeptide (middle), and receptor (right) genes across peri-LCGABA neuron clusters. Circle size corresponds to percent of cells in the cluster expressing the specific transcript, while color intensity corresponds to its relative expression. (b) Dot plot of genes associated with neurotransmitter reuptake (left), hormone signaling (middle), and cannabinoid signaling (right) across peri-LCGABA neuron clusters. (c) Dot plot of genes associated with gap junctions, development, and pathology across peri-LCGABA neuron clusters.
Extended Data Fig. 7.
Extended Data Fig. 7.. Pixel-seq quality control.
(a) Uniform Manifold Approximation and Projection (UMAP) embedding of ~59,000 cells passing quality control metrics, colored by clustering analysis. (b) Proportion of the RNA type in the brain slices obtained from male and female mice used for Pixel-seq. (c) Sequencing reads and saturation for 11 brain slices (6 female, 5 male) containing the LC use for Pixel-seq. (d) Comparison of transcripts found in brain slices of male and female mice used for Pixel-seq. (e) Unique molecular identifier (UMI) counts for the 11 brain slices used for Pixel-seq. The box plot parameters (min, Q1, median, Q3, max) for the slices are FLC1: 8.022, 9.043, 9.652, 10.396, 13.644; FLC2: 8.011, 9.301, 10.065, 10.857, 14.434; FLC3: 8.044, 9.219, 9.974, 10.805, 14.898; FLC4: 8.033, 9.342, 10.118, 10.92, 14.375; FLC5: 8.022, 9.257, 10.013, 10.777, 14.706; FLC6: 8.066, 9.342, 10.077, 10.883, 14.569; MLC1: 8.05, 9.444, 9.892, 10.456, 12.66; MCL2: 8.017, 9.501, 9.964, 10.596, 12.761; MLC3: 8.017, 9.408, 9.843, 10.332, 12.704; MLC4: 8.066, 10.312, 10.983, 11.797, 16.096; MLC5: 8.011, 10.087, 10.641, 11.238, 14.207. (f) Spatial expressions of Gal, Th, Calca, Slc18a2, and Hctr1 in the LC region are shown along the anterior-posterior axis (Bregma −5.40 mm to −5.70 mm). Scale bars are 100 μm. (g) Feature plots show the peri-LC inhibitory neuron clusters expressing Penk (top), Pnoc (middle), and Tac1 (bottom). (h-j) Representative images for in situ hybridization of VGAT (Slc32a1) (h-j), Dbh (h,j), and VGLUT2 (Slc17a6) (i) with (h) Penk, (i) Pnoc, (j) Tac1 mRNA. Scale bars are 100μm (top) and 20μm (bottom). The respective quantification of the relevant in situ cell populations within the peri-LC are shown in the bottom row.
Extended Data Fig. 8.
Extended Data Fig. 8.. Peri-LC neuronal subpopulations differentially respond to arousing and stress stimuli.
(a) Example images of GCaMP6s expression in peri-LC subpopulations. Insets show placements of fibers, with ‘x’ representing on-target fibers and expression and ‘o’ representing no or off-target expression. Scale bars are 50 μm. (b) Peri-LC neurons are modulated by 30 s exposure to odor of opposite-sex mice (p<0.0001, n=44 exposures; p=0.0010, n=24; p=0.0232, n=20; p=0.8766, n=16). (c) Peri-LC neurons are modulated by 30 s exposure to 2MT (p=0.0168, n=56 exposures; p=0.0067, n=24; p=0.5479, n=20; p=0.0122, n=16). (d) Peri-LC neurons are modulated by 30 s exposure to peppermint oil odor (p<0.0001, n=56 exposures; p=0.0020, n=24; p=0.3059, n=20; p<0.0001, n=16). (e) Peri-LC neurons are not affected by 30 s of blowing air through chamber (p=0.0912, n=44 exposures; p=0.5947, n=24; p=0.8010, n=20; p=0.0763, n=16). (f) Peri-LC neurons are modulated by interactions with a novel object or a familiar object (p= 0.2539, n=141 interactions, and p=0.0002, n=133; p=0.5814, n=26, and p=0.0106, n=16; p=0.7377, n=28 and p=0.5585, n=27; p=0.0404, n=22 and p=0.0075, n=22). (g) Peri-LC neurons are unaffected by exposure to a tone that had not yet been paired with a shock (p=0.1423, n=84 exposures; p=0.6458, n=36; p=0.8857, n=30; p=0.5828, n=24). (h) Peri-LC neurons do not respond to a conditioned tone, but GABA neurons decrease activity and Tac1 neurons increase activity after the tone stops (p=0.2682 and p=0.0166, n=84 exposures; p=0.8360 and p=0.6586, n=36; p=0.3400 and p=0.8482, n=30; p=0.7967 and p=0.0029, n=24). (i) Peri-LC GABA neurons increase activity and Tac1 neurons decrease activity when an animal enters the open arm of an elevated zero maze (p=0.0059, n=81 transitions; p=0.3220, n=40; p=0.7189, n=54; p=0.0011, n=32). (j) Peri-LC GABA neurons increase activity after they stop eating highly palatable food; no other conditions are affected (p=0.4234 and p=0.0006, n=66 bouts; p=0.8965 and p=0.7484, n=31; p=0.9600 and p=0.6597, n=24; p=0.1080 and p=0.3578, n=14). Bars represent change in activity before vs. after events. Periods of comparison were 30s for odor experiments and air flow, 20s for sound stimuli, 10s for feeding, and 5s for novel/familiar object interaction and maze exploration. (k) Activity of peri-LC neurons during movement in the open field test. Bars represent difference in activity during movement vs. non-movement for each trial. p=0.0005 (n=12 trials); p=0.0348 (n=6); p=0.6327 (n=5); p=0.2310 (n=4). (l) Activity of peri-LC neurons during movement in the elevated zero maze. Bars represent difference in activity during movement vs. non-movement for each trial. p<0.0001 (n=12 trials); p=0.2752 (n=6); p=0.0153 (n=5); p=0.0776 (n=4). (m) Representative signal in 470nm (blue) and 405nm (gray) channels for peri-LC GABA, pENK, Pnoc, and Tac1 recordings of 2-PE odor. *p< 0.05, ** p<0.01, ***p<0.001, ****p<0.0001 by paired two-tailed t-test; p-values and n given in order of GABA, pENK, Pnoc, and Tac1. Error bars and shading indicate SEM. N=14 animals for GABA photometry (11 for opposite-sex odor and air flow test), 6 for pENK, 5 for Pnoc, and 4 for Tac1.
Extended Data Fig. 9.
Extended Data Fig. 9.. Differential responses to peri-LC stimulation
(a) Left, 2-photon setup for slice imaging and solution exchanges. Right, example brain slice with GCaMP6f-expressing LCNE neurons of Dbh-Cre mice. Scale bar is 100 μm. (b) Box plots show fluorescent changes of GCaMP6f-expressing LCNE cells after perfusing with either ACSF (control), 1–4 μM DAMGO, 1 μM Leu-enk, 1 μM nociceptin, or 30 mM KCl. p=0.0280 (ACSF vs. nociceptin) and p<0.0001 (ACSF vs. KCl) by two-stage linear step-up procedure after one-way ANOVA (p<0.0001). Error bars indicate SEM. The box plot parameters (min, Q1, median, Q3, max) are ACSF: −0.36, −0.12, −0.01, 0.025, 0.34; DAMGO: −0.31, −0.06, −0.02, 0, 0.19; Leu-enk: −0.35, −0.0525, −0.01, 0.0125, 0.41; Nociceptin: −0.48, −0.16, −0.07, −0.01, 0.09; and KCl: 0.01, 0.1275, 0.34, 0.615, 0.82. n=80 neurons from 5 slices. (c) Top, QQ plot shows divergence from test normality of LCNE neuronal responses for the three peptide perfusions. Bottom, correlational plots of LCNE responses for combinations of peptides, with the Pearson’s correlational coefficient shown on the bottom. (d) Left, NE activity measured by photometry traces of GRABNE2m sensor, aligned to peri-LC photostimulation (30Hz 500ms every 20s repeated 50 times), averaged across all events and across mice for pENK-Cre (n=6), Pnoc-Cre (n=5), and Tac1-Cre (n=8) mice in the PFC (top) and Pir (bottom). Right, plots show 1-s binning of NE changes in response to photostimulation at time 0. pENK vs. Tac1: p=0.031 by two-tailed Spearman correlation. (e) Area under curve over 10s of photometry recordings of NE activity (as measured by GRABNE2m) in the PFC (top) and Pir (bottom) during tail lifts in the pENK-Cre (n=6), Pnoc-Cre (n=5), and Tac1-Cre (n=8) mice used for the peri-LC photostimulation experiments. PFC: p=0.0152 (pENK), p=0.0047 (Pnoc), p=0.0017 (Tac1); Pir: p=0.0068 (pENK), p=0.0050 (Pnoc), p=0.0005 (Tac1) by paired two-tailed t-test. (f) The difference in total distance traveled in the elevated zero maze (full 20 min of assay 30 min after saline or 1 mg/kg CNO treatment) for VGAT fluorophore control (n=7), VGAT Gq (n=7), pENK Gq (n=10), Pnoc Gq (n=9), and Tac1 Gq (n=13) mice. *p=0.0411 by Tukey’s multiple comparisons test. (g) The difference in time spent in the center and total distance traveled in the open field test (full 20 min of assay 30 min after saline or 1 mg/kg CNO treatment) for VGAT fluorophore control (n=7), VGAT Gq (n=7), pENK Gq (n=10), Pnoc Gq (n=9), and Tac1 Gq (n=13) mice.
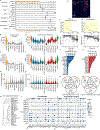
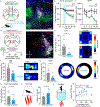
Fig. 1.
Fig. 1.. In vitro and in vivo identification of the peri-LC GABAergic neural network.
(a) Schematic of viral injection in VGAT-Cre mice is shown on top left. Light-sheet image of cleared mouse brain immunostained for tyrosine hydroxylase (TH, green) and eYFP-expressing GABAergic cells (red) is shown on top right. Confocal images depicting peri-LCGABA soma with eYFP (green), Th (white), and Nissl (blue) (bottom) are shown on the bottom. Scale bars 100 μm (inset 20 μm). AP/DV=mm from bregma. (b) Schematic of whole-cell patch clamp electrophysiology recordings of optically-evoked inhibitory postsynaptic currents (IPSCs). (c) Representative optically evoked IPSC (53.8±7.3 pA, n=18) with paired pulse ratio of 1.1 at a 50 ms interpulse interval (n=16). Blue dashes: individual 1 ms pulses, 470 nm 1mW/mm2. (d) (Left) Representative rescue of tetrodotoxin (TTX, 1 μM)-sensitive light-evoked IPSCs by 4-aminopyridine (4-AP, 500 μM). (Right) Average IPSCs during 5 min baseline (black), 3–8 min post-TTX (orange), and 5–10 min post-4-AP (purple). (e) IPSC amplitudes in the presence of TTX or TTX+4-AP normalized to baseline (n=6 cells). p=0.0330 by paired two-tailed t-test. (f) Schematic of fiber photometry recordings in peri-LCGABA neurons. (g-l) Peri-LCGABA neuronal activity during exposure to 30s of bobcat urine (g) and 2-phenylethanol (2-PE) odor (h), center entry (arrowhead) in open field test (i), 1s 0.5mA shock preceded by 20s tone (j), object interaction (k), and food consumption (l). *p<0.05, **p<0.01, ***p<0.001, ****p<0.0001. ns, not significant. Error bars (e) and shading (g-l) indicate SEM. Dotted line (d,e) represents baseline level.
Fig. 2.
Fig. 2.. Manipulation of peri-LC GABAergic neurons alters diverse behavioral states.
(a) (Left) Schematic of viral injection and optogenetic simulation of peri-LCGABA neurons. (Right) Image shows ChR2-eYFP (green), tyrosine hydroxylase (TH, white), and Nissl (blue) expressed in the LC and peri-LC region. Scale bar is 100 μm. (b) Pupil size in response to 10s of 20Hz stimulation (2mW, 5ms pulse width) in wild-type control or VGAT-Cre mice starting at 10s. (c) Distance traveled in real-time place preference assay with varying photostimulation frequencies 0–20 Hz (2mW, 5ms pulse width). p=0.0081 (0 vs. 10 Hz) and p=0.0001 (0 vs. 20 Hz); n=10 VGAT-Cre+ and 10 wild-type subjects. (d) (Left) Schematic of viral injection and chemogenetic inhibition of peri-LCGABA neurons. (Right) Image shows hM4D(Gi)-mCherry (red), TH (white), and Nissl (blue) in the LC and peri-LC region. Scale bar is 100 μm. (e-j) Chemogenetic inhibition (1 mg/kg CNO) of peri-LCGABA neurons in VGAT-Cre mice versus non-expressing wild-type controls in (e) time spent in the center of an open field (p=0.0094), (f) time spent on the light side of a light-dark box test (LDB) (p=0.0006), (g) time spent in the open arms of an elevated-zero maze (EZM) (p=0.0117), (h) food consumed in a 20 min period (p=0.0424), (i) latency to paw lick on a 55°C hot plate (p=0.0133), and (j) latency to tail flick in 54°C water (p=0.0444 (0 vs. 40 min), p=0.0014 (0 vs. 50 min)) (VGAT-Cre+ vs. VGAT-Cre-: p=0.007206 (20 min); p=0.001607 (30 min); p=0.001209 (40 min); p=0.00237 (50 min)). Corresponding location heat maps are shown for OFT, LDB, and EZM. *p<0.05, **p<0.01, ***p<0.001 by unpaired two-tailed t-test (e-i) or two-way ANOVA with Dunnett’s multiple comparison test (c,j). Dots represent independent measurements across different animals. Shading (b) and error bars (c,e-j) indicate SEM.
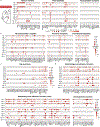
Fig. 3.
Fig. 3.. The locus coeruleus and peri-LC transcriptome.
(a) Schematic of single-nucleus RNA sequencing (snRNAseq) experiments. (b) UMAP visualization based on transcriptional profile for n=30,818 cells pooled from 3 different samples. (c) Distribution of cell types (top, n=28,066) and neuronal classes (bottom, n=12,278) in snRNAseq sample after VGLUT1 neurons were removed. (d) Dot plots of n=12,278 neurons, with neuronal clusters on the y-axis and transcripts on the x-axis. Size of circles corresponds to percent of cells in the cluster expressing a specific transcript, while color intensity corresponds to the relative expression level of the transcript. Plots correspond to transcripts related to neurotransmission. (e) UMAP visualizations of reclustered neurons using Slc32a1 (VGAT), Gad1, or Gad2 expression for peri-LC inhibitory neurons (left, n=11,182); and Dbh or Th expression for LCNE neurons (right, n=1,324). (f-g) Dot plots of the subset of neurons that express Slc32a1 (VGAT), Gad1, or Gad2 (n=11,182) (f) or Dbh or Th (n=1324) (g), with subpopulations on the y-axis and neuropeptide (f) or neuropeptide receptor genes (g) on the x-axis. Circle size corresponds to percent of cells in the cluster expressing a specific transcript, while color intensity corresponds to its relative expression. Cell number in each cluster is graphed to the right, where the yellow represents the contribution from the female sample and blue represents the two male samples. (h) Distribution of neurotransmitter/neuropeptide gene expression in GABAergic neurons on the x-axis and the gene expression of their cognate receptors in LCNE neurons on the y-axis.
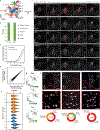
Fig. 4.
Fig. 4.. Spatial transcriptomics using Pixel-seq of the LC and peri-LC region.
(a) Schematic depicts spatial transcriptomics via Pixel-seq. Barcoded DNA templates were grafted onto polyacrylamide gel and the spatial coordinates of barcodes were determined by Illumina sequencing by synthesis method. The right plot shows the spatial distribution of unique molecular identifier (UMI) density per cluster (1 pixel = 0.325 × 0.325 μm2). (b) Left, a spatial UMI density image of a representative fresh tissue section containing the LC and neighboring regions. 4V, 4th ventricle. Cb, cerebellum. Scale bar is 200 μm. Right, single-nucleus RNA sequencing-guided annotation of segmented pseudo-cells is shown for neuronal and non-neuronal subpopulations. Scale bar is 100 μm. (c) Spatial expression maps of Dbh, Penk, Pnoc, Tac1, Sst, Nps of the LC region along the anterior-posterior axis are shown for a female (top) and male (bottom) mouse. Scale bar is 100 μm. (d) Summary comparisons of the spatial expressions of Gal, Npy, Dbh, Penk Pnoc, Tac1, Sst, Nps in the anterior and posterior LC in male and female mice. Each pseudo-cell has been enlarged 1.5 times to aid with visualization. Scale bar is 100 μm. (e) Probability density of the expressions of various neuropeptide and Dbh transcripts along the anterior-posterior axis (Bregma −5.34 mm to −5.68 mm) in the LC region.
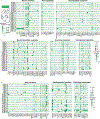
Fig. 5.
Fig. 5.. Functional heterogeneity of peri-LC neuronal subpopulations.
(a) Schematic of fiber photometry recordings in in the peri-LC of VGAT-Cre, pENK-Cre, Pnoc-Cre, or Tac1-Cre mice. (b) Heat map summary of peri-LC photometry experiments. (c-h) Photometry traces and change in activity for peri-LC subpopulations (VGAT, pENK, Pnoc, Tac1) for 30s exposure to bobcat urine odor (c) (p<0.0001, n=56 exposures; p<0.0001, n=24; p=0.0165, n=20; p=0.2398, n=16), 2-phenylethanol (2-PE) odor (d) (p=0.0027, n=44 exposures; p=0.0032, n=24; p=0.5265, n=20; p=0.0002, n=16), early (left, 0–5s after shock) and late (right, 5–20s after shock) responses to a 1s 0.5mA footshock (e) (p<0.0001 and p<0.0001, n=84 exposures; p<0.0001 and p=0.0101, n=36; p<0.0001 and p=0.0007, n=30; p<0.0001 and p=0.6062, n=24), foot pinch (f) (p<0.0001, n=56 exposures; p=0.0118, n=24; p=0.0048, n=30; p=0.0001, n=16), entering the center of an open field (g) (p<0.0001, n=368 transitions; p=0.0010, n=56; p=0.0384, n=135; p=0.2833, n=90), and the start and end of food consumption (h) (p<0.0001 and p=0.0009, n=200 bouts; p=0.0019 and p=0.0004, n=59; p<0.0001 and p<0.0001, n=74; p=0.1324 and p=0.4794, n=36). Periods of comparison were 30s for odor experiments and foot pinch, 5s for OFT, and 10s for feeding. Early shock comparison period=5s before vs. after shock initiation; late shock comparison period=5–20s before vs. after shock. N=14 animals for GABA photometry (11 for 2-PE exposure and 12 for OFT), 6 for pENK, 5 for Pnoc, and 4 for Tac1. Two-tailed t-test; p-values and n given in order of GABA, pENK, Pnoc, and Tac1. (i) Heat plots of individual neurons (n=80 from 5 slices) show GCaMP6s responses to DAMGO, Leu-enk, nociceptin, and KCl. (j) Immunostains for phospho-pyruvate dehydrogenase (pPDH) after activating Gq-DREADD. Bottom, %pPDH positivity in TH+ neurons. p=0.0081 (VGAT vs. pENK) and p=0.0013 (pENK vs. Tac1) by chi-square test of homogeneity with Bonferroni correction. (k) Change in the percent time spent in open arms of an elevated zero maze after saline or 1 mg/kg CNO treatment in VGAT-Cre fluorophore control (N=7), VGAT Gq (N=8), pENK Gq (N=10), Pnoc Gq (N=9), and Tac1 Gq (N=13) mice. p=0.0065 (VGAT), p=0.0290 (pENK), p=0.0251 (Pnoc) by Tukey’s multiple comparisons test. *p<0.05, **p<0.01, ***p<0.001, ****p<0.0001, ns=not significant. Shading and error bars denote SEM.

References

Main references:

    1. Samuels ER & Szabadi E Functional Neuroanatomy of the Noradrenergic Locus Coeruleus: Its Roles in the Regulation of Arousal and Autonomic Function Part I: Principles of Functional Organisation. Curr. Neuropharmacol. 6, 235–253 (2008). - PMC - PubMed
    1. Berridge CW, Schmeichel BE & España RA Noradrenergic modulation of wakefulness/arousal. Sleep Med. Rev. 16, 187–197 (2012). - PMC - PubMed
    1. Uematsu A et al. Modular organization of the brainstem noradrenaline system coordinates opposing learning states. Nat. Neurosci. 20, 1602–1611 (2017). - PubMed
    1. Seo D & Bruchas MR Polymorphic computation in locus coeruleus networks. Nat. Neurosci. 20, 1517–1519 (2017). - PubMed
    1. Loughlin SE, Foote SL & Grzanna R Efferent projections of nucleus locus coeruleus: morphologic subpopulations have different efferent targets. Neuroscience 18, 307–319 (1986). - PubMed

Methods references:

    1. Vong L et al. Leptin Action on GABAergic Neurons Prevents Obesity and Reduces Inhibitory Tone to POMC Neurons. Neuron 71, 142–154 (2011). - PMC - PubMed
    1. Parker KE et al. A Paranigral VTA Nociceptin Circuit that Constrains Motivation for Reward. Cell 178, 653–671.e19 (2019). - PMC - PubMed
    1. Feng J et al. Monitoring Norepinephrine Release in Vivo Using next-Generation GRAB NE Sensors. http://biorxiv.org/lookup/doi/10.1101/2023.06.22.546075 (2023) doi: 10.1101/2023.06.22.546075. - DOI - DOI
    1. Fraklin KBJ & Paxinos. The Mouse Brain in Stereotaxic Coordinates Third Edition. (Academic Press, New York, NY, 2007).
    1. Bankhead P et al. QuPath: Open source software for digital pathology image analysis. Sci. Rep. 7, 1–7 (2017). - PMC - PubMed

LinkOut - more resources