. 2025 Jun;642(8067):492-500.
doi: 10.1038/s41586-025-08974-4. Epub 2025 May 7.

Activation of lysosomal iron triggers ferroptosis in cancer

Affiliations

Activation of lysosomal iron triggers ferroptosis in cancer

Tatiana Cañeque et al. Nature. 2025 Jun.

Abstract

Iron catalyses the oxidation of lipids in biological membranes and promotes a form of cell death called ferroptosis1. Defining where this chemistry occurs in the cell can inform the design of drugs capable of inducing or inhibiting ferroptosis in various disease-relevant settings. Genetic approaches have revealed suppressors of ferroptosis2-4; by contrast, small molecules can provide spatiotemporal control of the chemistry at work5. Here we show that the ferroptosis inhibitor liproxstatin-1 exerts cytoprotective effects by inactivating iron in lysosomes. We also show that the ferroptosis inducer RSL3 initiates membrane lipid oxidation in lysosomes. We designed a small-molecule activator of lysosomal iron-fentomycin-1-to induce the oxidative degradation of phospholipids and ultimately ferroptosis. Fentomycin-1 is able to kill iron-rich CD44high primary sarcoma and pancreatic ductal adenocarcinoma cells, which can promote metastasis and fuel drug tolerance. In such cells, iron regulates cell adaptation6,7 while conferring vulnerability to ferroptosis8,9. Sarcoma cells exposed to sublethal doses of fentomycin-1 acquire a ferroptosis-resistant cell state characterized by the downregulation of mesenchymal markers and the activation of a membrane-damage response. This phospholipid degrader can eradicate drug-tolerant persister cancer cells in vitro and reduces intranodal tumour growth in a mouse model of breast cancer metastasis. Together, these results show that control of iron reactivity confers therapeutic benefits, establish lysosomal iron as a druggable target and highlight the value of targeting cell states10.


Conflict of interest statement

Competing interests: Institut Curie filed a patent application (PCT/EP2025/051999) related to lipid degraders to induce ferroptosis in cancer. M.C. and B.P. hold patents for some of the compounds described herein and are co-founders of ROSCUE Therapeutics. B.R.S. is an inventor on patents and patent applications involving ferroptosis; co-founded and serves as a consultant to ProJenX and Exarta Therapeutics; holds equity in Sonata Therapeutics; and serves as a consultant to Weatherwax Biotechnologies and Akin Gump Strauss Hauer & Feld. All the other authors declare no competing interests.

Figures

Fig. 1
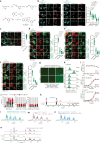
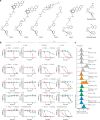
Fig. 1. Lysosomal iron triggers the oxidation of membrane lipids.
a, Schematic (left), images (middle) and quantification (right) of labelling cLip-1 (1 μM, 1 h) in cells. n = 3 independent experiments in HT-1080 cells. Data are the mean ± s.d. Asc, ascorbate; Lys., lysosome; PFA, paraformaldehyde. b, Kaplan–Meier survival curves of Rosa26-CreERT2;Gpx4f/f mice treated with cLip-1 (10 mg per kg per day by intraperitoneal injection; n = 6 mice per group). Mantel–Cox log-rank test. Arrows indicate the timing of the two tamoxifen injections. Average days of survival are indicated. c, Fluorescence images of labelled cLip-1 in renal proximal tubules of a Rosa26-CreERT2;Gpx4f/f mouse 7 days after tamoxifen treatment. Images representative of n = 2 mice. d, 1H NMR spectra of Lip-1 titrated with FeCl3 (red, 2:1 Lip-1 to iron; green, 1:1 Lip-1 to iron). e, 1H NMR spectra of Lip-1 titrated with FeCl3 and then TFA. The blue reference spectrum is Lip-1 + 3 eq. TFA. f, Putative binding modes of Lip-1 and iron obtained from molecular modelling. g, Cyclic voltammetry of a FeCl3 solution with Lip-1 (left) or DFO (right) (reduction potentials indicated by pink arrows). SCE, saturated calomel electrode. hk, Data are for HT-1080 cells. h, Flow cytometry of cells treated with the indicated compounds for 15 min and then with the iron(III) probe RPE for 15 min. n = 9 independent experiments. a.u., arbitrary unit; MFI, mean fluorescence intensity. i, Flow cytometry of cells treated with the indicated compounds for 15 min and then with the iron(II) probe HMRhoNox-M for 15 min. n = 8 independent experiments. j, Bodipy-C11 581/591 flow cytometry of cells treated with RSL3 (1 h) and with bafilomycin-A1 (Baf-A1) or hydroxychloroquine (HCQ) 2 h before. n = 7 independent experiments. One-way analysis of variance (ANOVA). k, Fluorescence imaging of Liperfluo in cells treated with RSL3 (1 h). n = 3 independent experiments. Two-sided unpaired t-test. Data are the mean ± s.d. d,e, NMR spectra recorded at 310 K in methanol-d4. For h and i, P values are from two-sided unpaired t-test compared with vehicle. The following concentrations were used: h,i, Lip-1 (10 µM), HCQ (100 µM); hj, Baf-A1 (75 nM); j, HCQ (10 µM), RSL3 (200 nM); k, RSL3 (1 µM). Box plots show the interquartile range, with centre lines indicating the medians and whiskers indicating the minimum and maximum values. Scale bar, 10 μm (a,c,k). Source data
Fig. 2
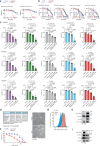
Fig. 2. Induction of ferroptosis by a lysosome-selective iron-dependent phospholipid degrader.
a, Chemical synthesis of Fento-1 and redox-active iron catalyst formation. b, Top, illustration of a liposome loaded with iron(II) and H2O2. Bottom, lipidomics of oxidized DOPC-forming liposomes with iron(II) and Fento-1. n = 3 independent experiments. ci, Data are for HT-1080 cells. c, Fluorescence imaging of Fento-1, marmycin and labelled cCW (1 µM) in cells treated at 37 °C for 1 h. Scale bar, 10 μm. n = 3 independent experiments. Data are the mean ± s.d. d, Quantitative proteomics of cells treated with Fento-1 (48 h). The dashed vertical line indicates adjusted P = 0.05. n = 5 independent experiments. FC, fold change; TFs, transcription factors. e, KEGG enrichment analysis of upregulated proteins in cells treated with Fento-1 (48 h). n = 5 independent experiments. f, Western blot of proteins from total and lysosome-enriched extracts from cells treated with Fento-1 (48 h). Representative of n = 3 independent experiments. γ-Tubulin is a sample-processing control. g, Lipidomics of oxidized phospholipids in cells treated with Fento-1 (24 h) and inhibitors (added 2 h before Fento-1). n = 5 independent experiments. Full heat map is in Supplementary Information. h, Lipidomics of lysophospholipids in cells treated with Fento-1 (24 h). n = 5 independent experiments. i, Lactate dehydrogenase (LDH) release from cells treated with Fento-1 (10 µM for 6 h) and with inhibitors added 2 h before. n = 4 independent experiments. Two-sided Mann–Whitney test compared to vehicle. The box plots show the interquartile range, with the centre lines indicating the medians and the whiskers the minimum and maximum values. Def, deferiprone; DFX, deferasirox; Fer-1, ferrostatin-1; Toc, α-tocopherol. The following concentrations were used unless stated otherwise: Fento-1 (1 µM), Toc (100 µM), Def (100 µM) and Lip-1 (1 µM). Phosphatidylcholine (PC) lipids are displayed in the main figure. Subscript Oxn denotes the addition of n oxygens. Phosphatidylethanolamine (PE), phosphatidylinositol (PI) and phosphatidylserine (PS) are shown in the Supplementary Information. Lysophosphatidylcholine (LPC) lipids are displayed in the main figure. LPE, LPI and LPS are shown in the Supplementary Information. For d and e, linear model, two-sided t-test on fold change. P adjusted with Benjamini–Hochberg false-discovery rate. Illustration in b was created using BioRender (https://biorender.com). Source data
Fig. 3
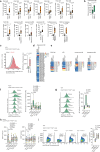
Fig. 3. Activation of lysosomal iron targets CD44high cancer cells and reduces tumour growth.
a, ICP-MS of human healthy and cancer tissues. PDAC, n = 6 pieces per tissue; UPS and liposarcoma, n = 10 pieces per tissue. b, ICP-MS of dissociated human tumour cancer cells (CD45CD31FAP). PDAC, n = 5; UPS, n = 6; liposarcoma, n = 7 replicates per tumour. c, HMRhoNox-M flow cytometry of dissociated human PDAC cancer cells (CD45CD31FAP). n = 8 patients. d, Lipidomics of oxidized phospholipids of dissociated human tumour cells treated with Fento-1 (1 µM, 24 h) and Toc (2 h before). e, CD44 flow cytometry of dissociated human PDAC cancer cells (CD45CD31FAP) treated with Fento-1 (1 µM, 24 h) and inhibitors (2 h before). n = 13 patients. One-way ANOVA. f, Colony-formation assay of DTP SUM159 cancer cells after doxorubicin treatment (150 nM, 72 h), then Fento-1 (5 µM) or DMSO (0.2%) treatment for 72 h. Data are the mean ± s.d. g, ICP-MS of sorted 4T1 tumour cells (CD45CD31MCHII+). n = 7 replicates. h, Tumour volume in 4T1 tumour-bearing mice. n = 5 mice per condition. Two-way ANOVA. P values (day 10) compared to vehicle. Data are the mean ± s.e.m. CW, Chen–White ligand. i, Maximum tumour diameter as the survival end point of tumour-bearing mice. Mantel–Cox log-rank test. j, Lipidomics of oxidized phospholipids in mouse 4T1 tumours (treatment for 15 days). n = 4 mice per condition. k, CD44 flow cytometry of dissociated tumour cancer cells (CD45CD31MCHII+) from 4T1 tumour-bearing mice treated with Fento-1 (0.003 mg per animal every other day). Vehicle, n = 10 mice, Fento-1, n = 4 mice. The following concentrations were used unless stated otherwise: Toc (100 µM), Def (100 µM), Lip-1 (1 µM) and cLip-1 (1 µM). For a–c,f,g and k, P values are from two-sided Mann–Whitney tests. For c and e, each coloured dot represents a tumour of a distinct patient per given panel. Full heat maps for d and j are provided in the Supplementary Information. Box plots show the interquartile range, with centre lines indicating the medians and whiskers the minimum and maximum values. Source data
Fig. 4
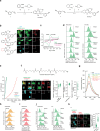
Fig. 4. Iron in ferroptosis and cell-state transitioning.
a, Iron is internalized by endocytosis. Lysosomal iron catalyses the production of oxygen-centred radicals from hydroperoxides under acidic conditions. These radicals can abstract a hydrogen from reactive phospholipids to produce carbon-centred radicals, which leads to oxidation products and ferroptosis. Inactivation of lysosomal iron protects cells against iron-redox chemistry. Activation of lysosomal iron triggers the oxidation of membrane lipids and ferroptosis. Hyal, hyaluronate b, Cell-state transitions induced by standard-of-care and pro-ferroptotic drugs. Illustrations in a and b were created using BioRender (https://biorender.com).
Extended Data Fig. 1
Extended Data Fig. 1. Inactivation of lysosomal iron inhibits ferroptosis (Part 1).
a, Chemical synthesis of cLip-1. b, Fluorescence imaging of labelled cLip-1 (1 μM, 2 h) and specific markers of cellular organelles. Scale bars, 10 μm. n = 3 independent experiments. Data are mean ± s.d. c, Fluorescence imaging of labelled cLip-1 (1 μM, 1 h) and LysoTracker. Scale bar, 10 μm. n = 3 independent experiments. Data are mean ± s.d. d-f, Fluorescence imaging of labelled cLip-1 (1 μM, 1 h) and BacMam transduced cells of GFP-labelled cell organelle markers. Scale bar, 10 μm. n = 3 independent experiments. Data are mean ± s.d. g, Fluorescence imaging of labelled cLip-1 in proximal kidney and liver tissues of a Rosa26-CreERT2;Gpx4f/f mouse treated with cLip-1 (0, 10 and 100 mg/ kg/ day; sacrificed 1 h after i.p. injection). Scale bar, 100 μm. h, Bodipy-C11 581/591 flow cytometry of cells treated with Lip-1 (1 µM), cLip-1 (1 µM) and RSL3 (100 nM) for 1 h. i, Viability of cells (top, after 72 h of incubation; middle, incubation for 24 h and cotreatment with RSL3 (500 nM); bottom, incubation for 72 h and cotreatment with 4-OH TAM to knock out Gpx4. Data are mean ± s.d. j, Annexin-V/ Propidium Iodide (A/ PI) staining in cells treated for 24 h. RSL3: n = 2 independent experiments; RSL3 + Lip-1: n = 3 independent experiments; RSL3 + cLip-1: n = 3 independent experiments. k, 1H NMR spectra of Lip-1 and naphthalene titrated with FeCl3. l-n, 1H NMR spectra of Lip-1 titrated with FeCl3 then TFA. o, 1H NMR spectra of Lip-1 titrated with FeCl3 and then sodium deuteroxide (NaOD). k-o, NMR spectra recorded at 310 K in methanol-d4. b, d-f, 1-way ANOVA. AU, arbitrary unit. Source data
Extended Data Fig. 2
Extended Data Fig. 2. Inactivation of lysosomal iron inhibits ferroptosis (Part 2).
a, Chemical syntheses of metcLip-1 and alcLip-1. b, Fluorescence imaging of labelled cLip-1 (10 µM, 2 h), metcLip-1 (10 µM, 2 h) and alcLip-1 (10 µM, 2 h). Scale bar, 10 μm. c, Cyclic voltammetry of a FeCl3 solution (reduction potentials = pink arrow). Data recorded in the presence of metcLip-1 or alcLip-1. d, Bodipy-C11 581/591 flow cytometry of cells treated with metcLip-1 (10 µM), alcLip-1 (10 µM) and RSL3 (100 nM) for 1 h. Representative of n = 3 independent experiments for PDAC053T and n = 1 for HT-1080. e, FENIX assay of cLip-1, metcLip-1 and alcLip-1. f, Molecular structure of cDFO and fluorescence imaging of labelled cDFO (100 µM, 15 min). Scale bar, 10 μm. n = 3 independent experiments. Data are mean ± s.d. g, Fluorescence emission spectra of RPE at pH 5 in the presence of FeCl3 and Lip-1. h, RPE flow cytometry of cells treated for 30 min and then cotreated with the probe for 30 min. HCQ (100 µM). Representative of n = 3 independent experiments. i, HMRhoNox-M flow cytometry of cells treated for 30 min and then cotreated with the probe for 30 min. HCQ (100 µM). Representative of n = 3 independent experiments. j, Bodipy-C11 581/591 flow cytometry of cells treated with RSL3 (200 nM for PDAC053T, 500 nM for 4T1, 1 h) and Baf-A1 or HCQ (10 µM) used 2 h prior. Representative of n = 3 independent experiments. k, Fluorescence imaging of Bodipy 665/676 in cells treated with RSL3 (1 µM, 1 h). Scale bar, 10 μm. n = 3 independent experiments. Two-sided unpaired t-test. Data are mean ± s.d. Concentrations used unless stated otherwise: Lip-1 (10 µM), Baf-A1 (75 nM). Source data
Extended Data Fig. 3
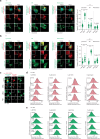
Extended Data Fig. 3. Ferroptosis inducers initiate lipid peroxidation in lysosomes.
a, Fluorescence imaging of Bodipy 665/676 and BacMam transduced cells of GFP-labelled cell organelle markers treated with RSL3 (1 μM, 1 h). Scale bars, 10 μm. n = 3 independent experiments. Data are mean ± s.d. b, Fluorescence imaging of Bodipy 665/676 and BacMam transduced cells of GFP-labelled cell organelle markers treated with RSL3 (1 μM, 4 h). Scale bars, 10 μm. n = 3 independent experiments. Data are mean ± s.d. c, Fluorescence imaging of the lysosomal GSH probe (SQSS) and a lysosomal marker in cells treated with RSL3 (1 μM). Scale bar, 10 μm. Representative of n = 3 independent experiments. d, SQSS flow cytometry of cells treated with ferroptosis inducers. e, 1-Red flow cytometry of cells treated with ferroptosis inducers. a, b, Two-sided unpaired t-test. Source data
Extended Data Fig. 4
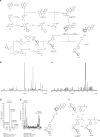
Extended Data Fig. 4. Chemical synthesis and spectral data of Fento-1.
a, Chemical synthesis of Fento-1. b, 1H NMR spectrum of Fento-1. c, 13C NMR spectrum of Fento-1. d. High-resolution mass spectrum (HRMS) of Fento-1. e, Low-resolution mass spectrum (LRMS) of a Fento-1-iron complex. f, Chemical synthesis of cCW. b, c, NMR spectra recorded at 298 K in methanol-d4. Full description, Supplementary Information.
Extended Data Fig. 5
Extended Data Fig. 5. Fento-1 induces the oxidation of phospholipids and cell death by activating lysosomal iron (Part 1).
a, Fluorescence imaging of Fento-1, marmycin and the cell surface marker CD44 in cells treated at 4 °C for 1 h. Scale bar, 10 μm. n = 3 independent experiments. Data are mean ± s.d. b, Fluorescence imaging of Fento-1 in BacMam transduced cells of GFP-labelled cell organelle markers. Scale bar, 10 μm. n = 3 independent experiments. Data are mean ± s.d. c, Bodipy-C11 581/591 flow cytometry of cells treated with Fento-1, marmycin and cCW alone or in combination for 6 h. Representative of n = 3 independent experiments. d, Viability of cells treated for 6 h. Data are mean ± s.e.m. n = 3 independent experiments. e, Viability of cells treated for 72 h. Data are mean ± s.e.m. n = 3 independent experiments. f, Lipidomics of oxidised phospholipids in cells treated with Fento-1 or ferroptosis inducers for 24 h. n = 5 independent experiments. g, Lipidomics of oxidised phospholipids in cells treated with Fento-1. n = 4 independent experiments. Full heatmap, Supplementary Information. h, Lipidomics of oxidised phospholipids of lysosomal extracts in cells treated with Fento-1 (10 µM, 1 h). n = 3 independent experiments. i, Western blot of proteins from cells treated with Fento-1, marmycin, cCW or marmycin + cCW. γ-tubulin is a sample loading control. Representative of n = 3 independent experiments. j, Western blot of proteins from cells treated with Fento-1, marmycin, cCW or marmycin + cCW (48 h). γ-tubulin is a sample processing control. Representative of n = 2 independent experiments with similar results. k, Bodipy-C11 581/591 flow cytometry of cells treated with Fento-1 (24 h) and inhibitors used 2 h prior. n = 7 independent experiments. Box plots: interquartile range, centre lines = medians and whiskers = the minimum and maximum values. l, Fluorescence imaging of 4-HNE treated with Fento-1 (1 h). Two-sided unpaired t-test. n = 3 independent experiments. Data are mean ± s.d. Scale bar, 10 μm. m, Quantification of glycerol in cells treated with Fento-1 (24 h). Data are mean ± s.e.m. n = 5 independent experiments. Concentrations used unless stated otherwise: Fento-1 (1 µM), marmycin (1 µM), cCW (1 µM), erastin (10 µM), RSL3 (100 nM), iFSP1 (10 µM), Toc (100 µM), Def (100 µM), Lip-1 (1 µM) and cLip-1 (1 µM). k, m, Kruskal–Wallis test with Dunn’s post-test. Phosphatidylcholine (PC) lipids displayed in the main figures. Phosphatidylethanolamine (PE), phosphatidylinositol (PI), phosphatidylserine (PS), Supplementary Information. Source data
Extended Data Fig. 6
Extended Data Fig. 6. Fento-1 induces the oxidation of phospholipids and cell death by activating lysosomal iron (Part 2).
a, CellTiterGlo luminescence of cells treated with Fento-1 (10 µM, 6 h) and inhibitors used 2 h prior. n = 5 independent experiments. b, Resorufin fluorescence of cells treated with Fento-1 (10 µM, 6 h) and inhibitors used 2 h prior. Vehicle, Lip-1: n = 8 independent experiments, clip-1 and Z-VAD-FMK: n = 4 independent experiments, Fer-1, Def and Toc: n = 6 independent experiments, DFO, DFX and Vitamin K3: n = 7 independent experiments. c, d, CellTiterGlo luminescence of cells treated with Fento-1 (10 µM, 6 h) and inhibitors used 2 h prior. n = 7 independent experiments. e, Incucyte cell viability measurement. Representative of n = 3 independent experiments. Data are mean ± s.e.m. f, Viability of cells treated with Fento-1 (10 μM, 24 h) or Lip-1 (1 μM, 24 h) or Fento-1 (10 μM, 24 h) and Lip-1 (1 μM, 30 min prior). 1-way ANOVA. n = 6 technical replicates. g, Fluorescence imaging of Fento-1. Fento-1 (1 μM, 1 h) and Toc (100 μM, 2 h prior). Scale bar, 10 μm. n = 3 independent experiments. Two-sided unpaired t-test. Data are mean ± s.d. h, Viability of cells treated for 48 h. n = 3 independent experiments. Data are mean ± s.d. i, Left: Cell death in knock-down cells measured by Annexin-V/ Sytox blue in cells treated with Fento-1 for 6 h. n = 3 independent experiments. 2-way ANOVA. Data are mean ± s.d. Right: Western blot of proteins in knock-down cells. γ-tubulin is a sample processing control. j, Bodipy-C11 581/591 flow cytometry of knock-down cells treated for 6 h. Box plots: interquartile range, centre lines = medians and whiskers = the minimum and maximum values. a-d, Two-sided Mann–Whitney test compared to vehicle. Source data
Extended Data Fig. 7
Extended Data Fig. 7. Fentomycin analogues.
a, Molecular structures. b, Viability of cells treated for 6 h or 72 h. Data are mean ± s.d. n = 3 independent experiments. c, Bodipy-C11 581/591 flow cytometry of cells treated for 6 h. Representative of n = 3 independent experiments. Source data
Extended Data Fig. 8
Extended Data Fig. 8. Fento-1 induces ferroptosis in CD44high iron-rich cancer cells (Part 1).
a, ICP-MS of healthy and cancer tissues from patients. PDAC #2: healthy n = 10 tissue pieces, PDAC n = 7 tissue pieces; PDAC #3: healthy n = 10 tissue pieces, PDAC n = 10 tissue pieces; PDAC #4: healthy n = 10 tissue pieces, PDAC n = 8 tissue pieces; PDAC #5: healthy n = 8 tissue pieces, PDAC n = 6 tissue pieces; PDAC #6: healthy n = 8 tissue pieces, PDAC n = 8 tissue pieces; PDAC #7: healthy n = 10 tissue pieces, PDAC n = 8 tissue pieces; PDAC #8: healthy n = 10 tissue pieces, PDAC n = 10 tissue pieces; PDAC #9: healthy n = 8 tissue pieces, PDAC n = 8 tissue pieces; angiosarcoma #1: healthy n = 8 tissue pieces, angiosarcoma n = 8 tissue pieces; angiosarcoma #2: healthy n = 10 tissue pieces, angiosarcoma n = 10 tissue pieces; liposarcoma #2: healthy n = 10 tissue pieces, liposarcoma n = 10 tissue pieces; epithelioid sarcoma: healthy n = 10 tissue pieces, epithelioid sarcoma n = 10 tissue pieces; PDAC liver metastasis: healthy n = 7 tissue pieces, PDAC liver metastasis n = 4 tissue pieces. b, ICP-MS of dissociated human tumour cancer cells. n = 10 replicates. c, HMRhoNox-M flow cytometry of cancer cells from human UPS. n = 5 patients. d, Lipidomics of oxidised phospholipids in dissociated human tumour cells treated with Fento-1 (24 h) and Toc used 2 h prior. e, Lipidomics of lysophospholipids in dissociated human tumour cells treated with Fento-1 (24 h) and Toc used 2 h prior. f, Bodipy-C11 581/591 flow cytometry of dissociated human PDAC cancer cells treated with Fento-1 (24 h) and inhibitors used 2 h prior. n = 11 patients. g, Bodipy-C11 581/591 flow cytometry of dissociated UPS cancer cells treated with Fento-1 (24 h) and inhibitors used 2 h prior. n = 5 patients. h, Flow cytometry cell counting of dissociated human PDAC CD44high/low cancer cells treated with Fento-1 (24 h) and inhibitors used 2 h prior. n = 13 patients. i, CD44 flow cytometry of dissociated UPS cancer cells treated with Fento-1 (24 h) and inhibitors used 2 h prior. n = 5 patients. Concentrations used unless stated otherwise: Fento-1 (1 µM), Toc (100 µM), Def (100 µM), Lip-1 (1 µM) and cLip-1 (1 µM). a, b, c, Two-sided Mann–Whitney test. f-i, 1-way ANOVA. c, f-i, each coloured dot represents a tumour of a distinct patient for a given panel. Box plots: interquartile range, centre lines = medians and whiskers = the minimum and maximum values. Source data
Extended Data Fig. 9
Extended Data Fig. 9. Fento-1 induces ferroptosis in CD44high iron-rich cancer cells (Part 2).
a, Viability of cells treated with Fento-1 or standard-of-care chemotherapy for 72 h. Data are mean ± s.e.m. n = 3 independent experiments. b, Viability of PDAC-derived organoids treated with Fento-1 or standard-of-care chemotherapy for 72 h. Data are mean ± s.e.m. IC50-values are indicated. PDAC009T: Oxaliplatin, 5-FU and SN-38 n = 4 independent experiments, Fento-1 n = 2 independent experiments. PDAC003T: Oxaliplatin n = 6 independent experiments, 5-FU and SN38 n = 4 independent experiments, Fento-1 n = 3 independent experiments. PDAC117T: Oxaliplatin, 5-FU and SN-38 n = 7 independent experiments, Fento-1 n = 3 independent experiments. PDAC372T: Oxaliplatin, 5-FU and SN-38 n = 4 independent experiments, Fento-1 n = 3 independent experiments. c, Viability of cells treated with standard-of-care chemotherapy and sublethal doses of Fento-1 (1.5 µM, 72 h). 1-way ANOVA. Data are mean ± s.e.m. n = 3 independent experiments. d, Synergy score of standard-of-care chemotherapy and Fento-1 in human primary PDAC cells. e, Viability of cells treated with Fento-1 (72 h) in naive cells or cells pretreated with Doxo (25 nM) for 30 days, then treated with Fento-1 for 72 h. Data are mean ± s.e.m. n = 5 independent experiments. f, Bright field images of cells treated with Doxo (25 nM, 30 days). Scale bar, 100 μm. Representative of n = 3 independent experiments with similar results. g, CD44 flow cytometry of cells treated with Doxo (25 nM) or Fento-1 (1 µM) for 10 days. Representative of n = 3 independent experiments. h, Western blot of mesenchymal and iron homeostasis markers in cells treated with Doxo (25 nM) for 10 days. Lamin A/C is a sample loading control. Representative of n = 3 independent experiments with similar results. i, Western blot of mesenchymal and iron homeostasis markers in cells treated with Fento-1 (1 µM) for 10 days. γ-tubulin is a sample loading control. Representative of n = 3 independent experiments with similar results. Doxo, doxorubicin. Source data
Extended Data Fig. 10
Extended Data Fig. 10. Fento-1 induces ferroptosis in CD44high iron-rich cancer cells (Part 3).
a, ICP-MS of blood, serum and lymphatic fluid from mice. Blood and serum: n = 7 mice; Lymph: n = 6 mice. 1-way ANOVA. b, HMRhoNox-M flow cytometry of dissociated mouse tumour cancer cells. n = 10 mice. Each coloured dot represents a tumour of a distinct mouse. Two-sided Mann–Whitney test. c, Tumour diameter in mice treated with Fento-1 (0.003 mg per animal every-other-day). 2-way ANOVA. Data are mean ± s.e.m. 2nd experiment: vehicle n = 10 mice, Fento-1 n = 5 mice; 3rd experiment: n = 10 mice for each group; 4th experiment: n = 5 mice for each group. d, Tumour diameter in tumour-bearing mice treated with Fento-1 (0.003 mg compound per animal every-other-day). n = 4 independent experiments. 1st experiment: n = 5 mice for each group; 2nd experiment vehicle: n = 10 mice, Fento-1: n = 5 mice; 3rd experiment: n = 10 mice for each group; 4th experiment: n = 5 mice for each group. e, Mice body weight of mice treated as in Fig. 3h and Extended Data Fig. 10c. 1st experiment: n = 5 mice for each group; 2nd experiment: vehicle n = 10 mice, Fento-1 n = 5 mice; 3rd experiment: n = 10 mice for each group; 4th experiment: n = 5 mice for each group. Data are mean ± s.e.m. f, Lipidomics of lysophospholipids in tumours of tumour-bearing mice treated with Fento-1 as in Fig. 3j. n = 4 4T1 tumours. LPC lipids displayed. LPE, LPS, Supplementary Information. Box plots: interquartile range, centre lines = medians and whiskers = the minimum and maximum values. Source data

Update of

  • Activation of lysosomal iron triggers ferroptosis in cancer.
    Rodriguez R, Cañeque T, Baron L, Müller S, Carmona A, Colombeau L, Versini A, Sabatier M, Sampaio J, Mishima E, Picard-Bernes A, Solier S, Zheng J, Proneth B, Thoidingjam L, Gaillet C, Grimaud L, Fraser C, Szylo K, Bonnet C, Charafe E, Ginestier C, Santofimia P, Dusetti N, Iovanna J, Sa Cunha A, Pittau G, Hammel P, Tzanis D, Bonvalot S, Watson S, Stockwell B, Conrad M, Ubellacker J. Rodriguez R, et al. Res Sq [Preprint]. 2024 Apr 8:rs.3.rs-4165774. doi: 10.21203/rs.3.rs-4165774/v1. Res Sq. 2024. Update in: Nature. 2025 Jun;642(8067):492-500. doi: 10.1038/s41586-025-08974-4. PMID: 38659936 Free PMC article. Updated. Preprint.

References

    1. Dixon, S. J. & Olzmann, J. A. The cell biology of ferroptosis. Nat. Rev. Mol. Cell Biol.25, 424–442 (2024). - PubMed
    1. Friedmann Angeli, J. P. et al. Inactivation of the ferroptosis regulator Gpx4 triggers acute renal failure in mice. Nat. Cell Biol.16, 1180–1191 (2014). - PMC - PubMed
    1. Bersuker, K. et al. The CoQ oxidoreductase FSP1 acts parallel to GPX4 to inhibit ferroptosis. Nature575, 688–692 (2019). - PMC - PubMed
    1. Doll, S. et al. FSP1 is a glutathione-independent ferroptosis suppressor. Nature575, 693–698 (2019). - PubMed
    1. Yang, W. S. & Stockwell, B. R. Synthetic lethal screening identifies compounds activating iron-dependent, nonapoptotic cell death in oncogenic-RAS-harboring cancer cells. Chem. Biol.15, 234–245 (2008). - PMC - PubMed