. 2025 Jun;642(8069):1062-1072.
doi: 10.1038/s41586-025-08973-5. Epub 2025 May 7.

Oncogene aberrations drive medulloblastoma progression, not initiation

Affiliations

Oncogene aberrations drive medulloblastoma progression, not initiation

Konstantin Okonechnikov et al. Nature. 2025 Jun.

Abstract

Despite recent advances in understanding disease biology, treatment of group 3/4 medulloblastoma remains a therapeutic challenge in paediatric neuro-oncology1. Bulk-omics approaches have identified considerable intertumoural heterogeneity in group 3/4 medulloblastoma, including the presence of clear single-gene oncogenic drivers in only a subset of cases, whereas in most cases, large-scale copy number aberrations prevail2,3. However, intratumoural heterogeneity, the role of oncogene aberrations, and broad copy number variation in tumour evolution and treatment resistance remain poorly understood. To dissect this interplay, we used single-cell technologies (single-nucleus RNA sequencing (snRNA-seq), single-nucleus assay for transposase-accessible chromatin with high-throughput sequencing (snATAC-seq) and spatial transcriptomics) on a cohort of group 3/4 medulloblastoma with known alterations in the oncogenes MYC, MYCN and PRDM6. We show that large-scale chromosomal aberrations are early tumour-initiating events, whereas the single-gene oncogenic events arise late and are typically subclonal, but MYC can become clonal upon disease progression to drive further tumour development and therapy resistance. Spatial transcriptomics shows that the subclones are mostly interspersed across tumour tissue, but clear segregation is also present. Using a population genetics model, we estimate medulloblastoma initiation in the cerebellar unipolar brush cell lineage starting from the first gestational trimester. Our findings demonstrate how single-cell technologies can be applied for early detection and diagnosis of this fatal disease.


Conflict of interest statement

Competing interests: C.M.v.T. participates on advisory boards for Alexion, Bayer and Novartis. The other authors declare no competing interests.

Figures
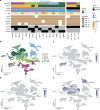
Fig. 1
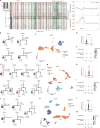
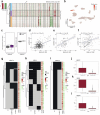
Fig. 1. Single-nucleus transcriptional profiling of 16 oncogene-associated group 3/4 medulloblastoma primary tumour samples.
a, Overview of target cohort with annotation. Two primary-relapse pairs (MB272/R, INF_P/R_637) are from the same patients. b, UMAP of snRNA-seq merged dataset, with medulloblastoma subgroups annotated. ce, Feature plots showing MYC (c), MYCN (d) and PRDM6 (e) expression within the UMAP of the merged snRNA-seq dataset. G3, group 3; G4, group 4; G34, group 3/4 medulloblastoma; F, female; M, male.
Fig. 2
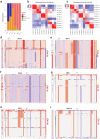
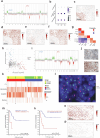
Fig. 2. Clonal proliferation and differentiation gradients are independent of oncogene expression.
a, Copy numbers derived from snATAC-seq data in MYCN-amplified sample MB183. Red, chromosome loss. Green, chromosome gain. Right side, inset of MYCN chromosome region. b, Somatic phylogeny trees for MYCN samples. Blue, proportion of MYCN-expressing cells. c, snRNA-seq UMAP of single MYCN sample MB183. Grey boxes, proliferating cell clusters with strong proliferation enrichment. Blue, C1 clone. Orange, C2 clone. d, MYCN expression in C1 and C2 clones. e, Per cell gene set variance analysis (GSVA) enrichments of proliferation, progenitor-like activity and differentiation in single sample shown in c. f, Somatic phylogeny trees for MYC samples. Red, proportion of MYC-expressing cells. Red square, cases MB292 and MB248 with somatic mutations in C0. g, snRNA-seq UMAP of single MYC sample MB89. Grey boxes, proliferating cell clusters with strong proliferation enrichment. Red, MYC-expressing C2 clone. Orange, C1 clone. Aquamarine, C3 clone. h, MYC expression in C1, C2 and C3 clones. i, Per cell GSVA enrichments of proliferation, progenitor-like activity and differentiation in single sample shown in g. j, Somatic phylogeny trees for PRDM6 samples. Purple, proportion of PRDM6-expressing cells. Red square, case MB249 with somatic mutations outside CNV regions. k, snRNA-seq UMAP of single PRDM6 sample MB249. Grey box, proliferating cell cluster with strong proliferation enrichment. Purple, PRDM6-expressing C2 clone. Orange, C1 clone. Aquamarine, differentiation signal enrichment in C3 clone. l, PRDM6 expression in C1, C2 and C3 clones. m, Per cell GSVA enrichments of proliferation, progenitor-like activity and differentiation in single sample shown in k.
Fig. 3
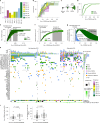
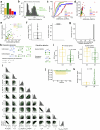
Fig. 3. Somatic mutation profiles and association with cell of origin.
a, Group 3/4 medulloblastoma subgroups analysed by bulk WGS. b, SNV densities at MRCA per group 3/4 medulloblastoma subgroup (I, n = 3; II, n = 15; III, n = 10; IV, n = 6; V, n = 12; VI, n = 12; VII, n = 19; VIII, n = 31). Shown are mean and 95% CI (estimated by bootstrapping the genomic segments 1,000 times). c, Early medulloblastoma evolution. Driver mutation in an ECA spawns a pre-malignant lesion. Malignant transformation occurs upon further drivers in the tumour’s MRCA. d, SNV densities at ECA and MRCA for group 3/4 medulloblastoma (n = 108). Mean and 95% CI, estimated by bootstrapping the genomic segments 1,000 times. e, Model fit to SNV densities at ECA. Line, mean and standard deviation (estimated by bootstrapping the genomic segments 1,000 times) of the measured SNV densities; green and grey areas, 95% credible interval of the model fit, and of key time points. f, As in e, but for SNV densities at MRCA. g, 95% credible intervals of modelled tissue of origin (blue) and pre-malignant clone (green). Grey areas as in f. h, Mutation spectrum with timing information (‘ECA’, CNV uniquely timed to ECA; ‘MRCA’, CNV uniquely timed to MRCA; ‘ECA or MRCA’, CNV in agreement with both ECA and MRCA; ‘clonal’, CNV/small mutation was clonal, no further mapping to ECA/MRCA possible; ‘subclonal’, CNV/small mutation was subclonal; ND, no data). Subclonality information for amplification of MYC/MYCN and duplication of SNCAIP from single-cell data. i, SNV density at ECA in group 3/4 medulloblastoma with and without driver in MYC/MYCN/PRDM6. P value, unpaired Wilcoxon rank sum test (n = 80 without, n = 28 with driver). j, As in i, but for SNV density at MRCA. 95% CI, 95% confidence interval; scRNA-seq, single-cell RNA-seq; SSNV, somatic single-nucleotide variants.
Fig. 4
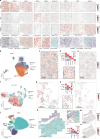
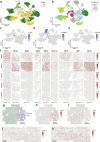
Fig. 4. Spatial heterogeneity across oncogene-associated group 3/4 medulloblastoma samples.
a, Spatial gene expression of MYC, MYCN and PRDM6. Last row, projection of clones derived from snRNA-seq. b, Spatial data UMAP of representative MYCN sample. c, Spatial visualization of clones of sample in b. Enlarged view of a fragment in the bottom right. d, Proximity of each compartment to each other of sample in b. e, MKI67 spatial expression of sample in b. f, Spatial data UMAP of representative MYC sample. g, Spatial visualization of clones of sample in f. Magnification of specific region in bottom right. h, Proximity of each compartment to each other of sample in f. i, MKI67 spatial expression of sample in f. j, Spatial data UMAP of representative PRDM6 sample. k, Spatial visualization of clones of sample in j. Magnification of specific region in top right. l, Proximity of each compartment to each other of sample in j. m,n, PRDM6 (m) and MKI67 (n) spatial expression of sample in j. diff, differentiated; prolif, proliferating.
Fig. 5
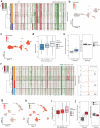
Fig. 5. Independent oncogene subclones may co-occur in one tumour, but subclones are lost at relapse.
a, Copy number profiles of snATAC-seq data from MYC-MYCN sample MB272. Red, chromosome loss. Green, chromosome gain. b, snRNA-seq UMAP of sample shown in a. Grey boxes, proliferating cell clusters with strong proliferation enrichment. Blue, MYCN-expressing C2 clone. Red, MYC-expressing C3 clone. Orange, C1 clone. c, MYC and MYCN expression in C1, C2 and C3 clones. d, Spatial gene expression of MYC (red) and MYCN (blue) from original signals. e, Spatial data UMAP of sample shown in d. f, Spatial visualization of clones of sample in d. g, Somatic phylogeny trees for MYC relapse samples. h, Copy number profiles of snATAC-seq data of relapse sample arising from primary sample shown in af. i, Spatial gene expression of MYC (red) and MYCN (blue) in spatial transcriptomic relapse sample of case shown in af. Scale bars, 400 μm (d,f), 300 μm (i).
Extended Data Fig. 1
Extended Data Fig. 1. Group 3/4 medulloblastoma single-nuclei RNA and ATAC data properties.
a) UMAP of snRNA-seq merged dataset with medulloblastoma groups annotated. Non-tumor cells marked by dotted box. Feature plots showing b) SNCAIP, c) PTPRC, d) IGFBP7 and e) AQP4 expression within UMAP of merged snRNA-seq dataset. f) Global CNV profiles derived from snRNA-seq data. Top fragment: non-tumor cells. G) UMAP of snATAC-seq merged dataset with medulloblastoma groups annotated. Green box, normal cells. h) UMAP of snATAC-seq merged dataset with medulloblastoma subgroups annotated.
Extended Data Fig. 2
Extended Data Fig. 2. Validation of copy number profiling using single-nuclei RNA and ATAC data.
a) Merged pseudo-bulk CNV profile of snRNA-seq data from sample MB292 b) Methylation data-derived CNV profiles from sample MB292. c) Correlation plot of CNV values across 500 Kbp bins between snRNA-seq pseudo-bulk and methylation bulk profiles from sample MB292. d) Cross-comparison of snRNA-seq CNV profiles against bulk profiles. Red boxes, 3 cases where the highest correlation does not correspond to the same sample. e) Cross-comparison of snATAC-seq CNV profiles against bulk profiles.
Extended Data Fig. 3
Extended Data Fig. 3. Copy number profiling of single-nuclei profiles from Group 3/4 MYC- and MYCN-amplified samples.
a) Copy number profile of snRNA-seq data from MYCN samples MB183. b,c) Per cell GSVA enrichment of proliferation (b) and differentiation (c) markers within UMAP of MB183 MYCN-amplified sample. d) Differentiation signal compared to ranked MYCN expression within MYCN-amplified subclone in sample MB183. MYCN normalized expression cutoffs: low = zero, intermediate > 0 and <2, high > 2. e) Boxplots showing difference in mean signal of progenitor-like activity (left) and differentiation (right) between MYCN-amplified and non-MYCN-amplified subclones in n = 4 tumor cases. f) Copy number profiles of snATAC-seq data from MYC sample MB89. Right side: zoom-in on MYC region. g,h) Per cell GSVA enrichment of proliferation (g) and differentiation (h) markers within UMAP of MB89 MYC-amplified sample. i) Differentiation signal compared to ranked MYC expression within MYC-specific sublclone in sample MB89. MYC normalized expression cutoffs: low = zero, intermediate > 0 and <2, high > 2. j) Boxplots showing difference in mean signal of progenitor-like activity (left side, t-test p-val: 0.003) and differentiation (right side) between MYC-amplified and non-MYC-amplified subclones in n = 6 tumor cases.
Extended Data Fig. 4
Extended Data Fig. 4. Copy number profiling of single nuclei profiles from Group 3/4 PRDM6 samples.
a) Copy number profiles of snATAC-seq from SCNAIP-PRDM6 sample MB249. b) Per cell GSVA enrichment of proliferation markers within UMAP of MB249 PRDM6 sample. c) Boxplots showing the difference in the mean signal of progenitor-like activity (left) and differentiation (right) between PRDM6- and non-PRDM6 subclones in n = 3 tumor cases. d-e) Correlation of VAF between mutations called from snATAC and bulk WGS data from n = 3 MYC cases: MB272 (d), MB89 (e), MB248 (f). g-i) Mutation heatmaps obtained via snATAC-seq data across subclones f from n = 3 MYC cases: MB272 (g), MB89(h), MB248 (i). j-l) Boxplots of comparison for number of subclone-specific vs. common mutations across snATAC profiles from n = 3 MYC cases: MB272 (j), MB89(k), MB248 (l) SNVs were filtered using bulk germline control and additional filtering parameters (see Methods for details).
Extended Data Fig. 5
Extended Data Fig. 5. Single-nuclei DNA and RNA data from Group 3/4 samples confirm CNV subclones.
a) Projection of RNA data into annotation of subclones. b-c) Cross-comparison of snRNA-seq (b) and snATAC-seq (c) subclonal CNV pseudo-bulk profiles against scDNA subclonal CNV profiles. d-i) Single-cell DNA copy number profiles from MYCN samples MB165 (d), MB183 (e), and MYC samples MB248 (f), MB89 (g), MB272 primary (h) and MB272 relapse (i). Zoom-in for target region (MYC or MYCN) is provided on the right side.
Extended Data Fig. 6
Extended Data Fig. 6. Early evolution of Group 3/4 medulloblastoma.
a) Medulloblastoma samples analyzed by bulk WGS. b) SNV variant allele frequencies on disomic chromosomes for sample MB104 (G34_VIII). Green line, fitted clonal SNV density; dashed line, true clonal VAF estimated with ACEseq. c), SNV densities at MRCA (39 MB G3, 69 MB G4, 21 MB SHH INF, 35 MB SHH CHL/AD, and 17 MB WNT; 4 MB SHH CHL/AD and 2 MB WNT had clonal densities between 0.7 and 2.9 SNVs/Mb and are not shown). Mean and 95% CI (estimated by bootstrapping genomic segments 1,000 times). d) Mean SNV densities at MRCA versus age at diagnosis (n = 173 cases with age information). e) As in d but for G3/4 subgroups (n = 105 cases with age information). f) Left panel, number of early CNVs per tumor. Right panel, percentage of early CNVs with SNV densities agreeing with a single ECA. Data are from G3/4 medulloblastomas with evidence for an ECA. g), Comparison between mutation density estimates obtained in this paper and with MutationTimeR. Estimates at gains/LOH were computed relative to the MRCA using both methods. Shown is the percentage of CNVs per tumor with overlapping 95% CIs. Data are from 38 MB G3, 66 MB G4, 15 MB SHH INF, 28 SHH CHL/AD, and 9 MB WNT with clonal gains/LOH at copy number ≤4 and at least 107 bp length. h) Population genetics model of tumors initiation in two steps. i) GSVA scores for MYC target genes and S-phase genes (86 G3/4 medulloblastomas with RNAseq data). j) Overall survival of 23 Group 3 and 36 Group 4 medulloblastomas with available data. k) Doubling times estimated from 35 G3/4 medulloblastomas using the population-genetics model outlined in h). l) Posterior probabilities for the model fit to all G3/4 MBs (n = 108). <µ1, µ1>, geometric mean of the driver mutation rate.
Extended Data Fig. 7
Extended Data Fig. 7. Clonal copy number changes in Group 3/4 medulloblastoma.
a) Percentage of tumors with copy number gains and losses ≥1 Mb along the genome. Red, regions where CNVs were significantly more frequent than expected, according to a Binomial test with padj < 0.01; Holm correction for multiple sampling. Shown are data from 109 Group 3/4 medulloblastomas. b, SNV densities at clonal chromosomal gains and at MRCA. Shown are mean and 95% confidence intervals (confidence intervals for SNV densities at chromosomal gains/LOH were estimated according to a Poisson distribution; confidence intervals for SNV densities at MRCA were estimated by bootstrapping genomic segments 1,000 times.
Extended Data Fig. 8
Extended Data Fig. 8. Spatial resolution of sub-clonal tumor populations.
a) UMAP of spatial merged dataset with medulloblastoma groups annotation. Normal cells marked. b) UMAP of spatial merged dataset with medulloblastoma subgroups annotation. c-e) Feature plots showing c) AQP4, d) IGFBP7 and e) PTPRC expression within UMAP of merged spatial dataset. f) Spatial gene expression of MKI67, EOMES, AQP4, IGFBP7 and PTPRC across samples. g) Spatial visualization of clones of PRDM6 sample in 2nd image fragment. h) PRDM6 and i) MKI67 spatial expression of sample in g. j) PRDM6 and k) MYCN spatial gene expression in image fragment of sample MB292.
Extended Data Fig. 9
Extended Data Fig. 9. Independent oncogene clones may co-occur in one tumor.
a) CNV profile of MB272 cases bulk methylation data. b) Per cell GSVA enrichments of proliferating, progenitor-like and differentiation in single sample MB272. Spatial expression of c) MYC, d) MYCN, e) CA10 and f) GABRA5 in sample MB272. g) Proximity of each compartment to each other in sample MB272 spatial data. h) Negative correlation (R = −0.287, P = 1.08e-09) between MYC and MYCN expression within medulloblastoma FFPE bulk RNA-seq cohort (n = 435). i) CNV profile of bulk methylation data from a Group 3/4 tumor with amplifications of MYC and MYCN. j) Identification of MYC (left) and MYCN (right) signals in the same sample using immunohistochemistry (IHC). k) CIBERSORT deconvolution results across subset of MYC/MYCN cases from medulloblastoma bulk FFPE RNA-seq cohort. MB272 single cell data with subclones annotation used as a reference, the data from control case is marked with c, target sample marked with asterisk. l) Identification of MYC (red) and MYCN (green) signals in the highlighted target Group 3/4 sample described in panel (k) using FISH. m) Kaplan–Meyer overall survival probability curves for medulloblastoma Subgroup V tumors with (red) and without (blue) MYC amplification as identified from bulk data CNV profiling. n) Kaplan–Meyer overall survival probability curves for medulloblastoma Subgroup V tumors with high (red) and low (blue) MYC subclone level enrichment. o) MYC and p) MYCN expression in spatial transcriptomic relapse sample.

References

    1. Bailey, S. et al. Clinical trials in high-risk medulloblastoma: evolution of the SIOP-Europe HR-MB trial. Cancers14, 374 (2022). - PMC - PubMed
    1. Northcott, P. A. et al. The whole-genome landscape of medulloblastoma subtypes. Nature547, 311–317 (2017). - PMC - PubMed
    1. Cavalli, F. M. et al. Intertumoral heterogeneity within medulloblastoma subgroups. Cancer Cell31, 737–754.e736 (2017). - PMC - PubMed
    1. Hanahan, D. Hallmarks of cancer: new dimensions. Cancer Discov.12, 31–46 (2022). - PubMed
    1. Hinohara, K. & Polyak, K. Intratumoral heterogeneity: more than just mutations. Trends Cell Biol.29, 569–579 (2019). - PMC - PubMed

MeSH terms

Substances

LinkOut - more resources