. 2025 Jun;642(8067):474-483.
doi: 10.1038/s41586-025-08942-y. Epub 2025 May 7.

PLA2G15 is a BMP hydrolase and its targeting ameliorates lysosomal disease

Affiliations

PLA2G15 is a BMP hydrolase and its targeting ameliorates lysosomal disease

Kwamina Nyame et al. Nature. 2025 Jun.

Abstract

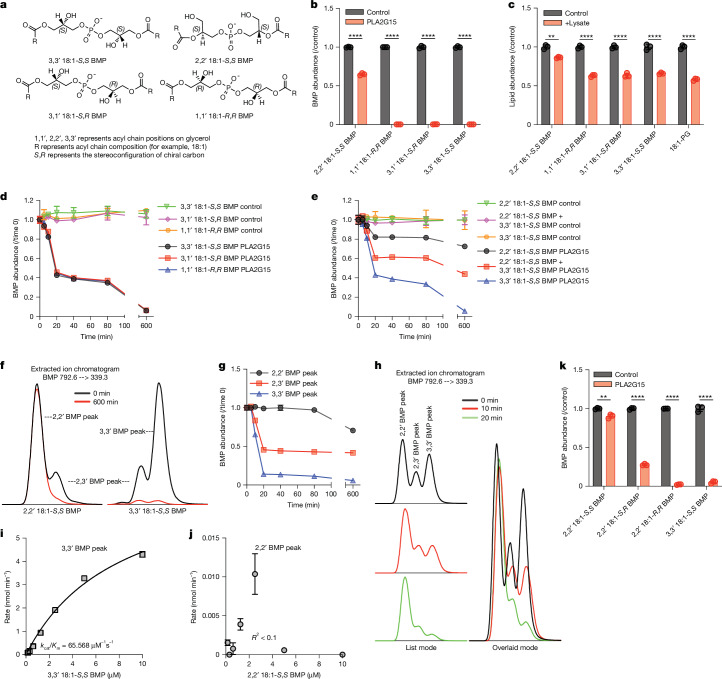
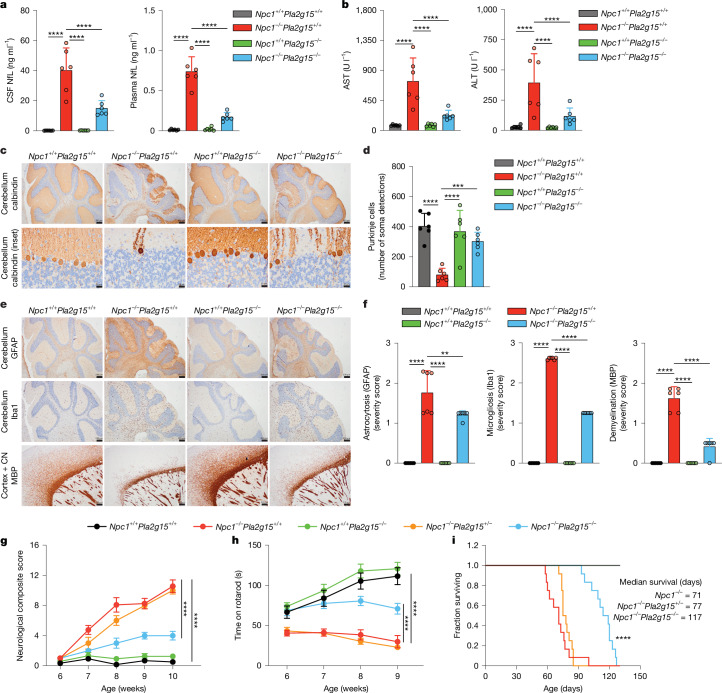
Lysosomes catabolize lipids and other biological molecules, maintaining cellular and organismal homeostasis. Bis(monoacylglycero)phosphate (BMP), a major lipid constituent of intralysosomal vesicles, stimulates lipid-degrading enzymes and is altered in various human conditions, including neurodegenerative diseases1,2. Although lysosomal BMP synthase was recently discovered3, the enzymes mediating BMP turnover remain elusive. Here we show that lysosomal phospholipase PLA2G15 is a physiological BMP hydrolase. We further demonstrate that the resistance of BMP to lysosomal hydrolysis arises from its unique sn2, sn2' esterification position and stereochemistry, as neither feature alone confers resistance. Purified PLA2G15 catabolizes most BMP species derived from cell and tissue lysosomes. Furthermore, PLA2G15 efficiently hydrolyses synthesized BMP stereoisomers with primary esters, challenging the long-held thought that BMP stereochemistry alone ensures resistance to acid phospholipases. Conversely, BMP with secondary esters and S,S stereoconfiguration is stable in vitro and requires acyl migration for hydrolysis in lysosomes. Consistent with our biochemical data, PLA2G15-deficient cells and tissues accumulate several BMP species, a phenotype reversible by supplementing wild-type PLA2G15 but not its inactive mutant. Targeting PLA2G15 reduces the cholesterol accumulation in fibroblasts of patients with Niemann-Pick disease type C1 and significantly ameliorates disease pathologies in Niemann-Pick disease type C1-deficient mice, leading to an extended lifespan. Our findings established the rules governing BMP stability in lysosomes and identified PLA2G15 as a lysosomal BMP hydrolase and a potential target for therapeutic intervention in neurodegenerative diseases.


Conflict of interest statement

Competing interests: M.A.-R. is a scientific advisory board member of Lycia Therapeutics and senior advisor of Scenic Biotech. M.R., V.A.B., S.M.B.N., T.R.B., A.P.H.d.J. and G.H. are employees or advisors of Scenic Biotech. R.d.M. is an employee of AnaPath Services. The other authors declare no competing interests.

Figures

Fig. 1
Fig. 1. PLA2G15 hydrolyses BMP lipids.
ac, Chemical structures of BMP (top) and phosphatidylglycerol (bottom) (a) and their degradation intermediates LPG (all possible structures) (b) and GPG (c). Red represents two glycerol groups, and blue represents the acyl chains. d, BMP hydrolase activity in the brain (left) and liver (right) lysates. The hydrolysis of 3,3′ 18:1-S,S BMP (1 µM) in buffers with pH range between 3.0 and 9.0 (Methods). Controls had similar reaction buffers, except with no lysate or BMP. Data are presented as mean ± s.d. of three biological replicates. e, Lysosomal lysates hydrolyse BMP with an acidic optimum. As in d but using brain lysosomal lysate (left) and liver lysosomal lysate (right). Data are presented as mean ± s.d. of n = 3. f, As in d but using brain and liver lysosomal lysates and in increasing concentration of amiodarone under acidic conditions (pH 5.0). Data are presented as mean ± s.d. of three biological replicates. g,h, PLA2G15 hydrolysed BMPs isolated from mouse liver lysosomes. g, Depiction of experimental design. h, Fold changes in the abundance of measured BMPs, and each time point was compared to the control. Data are presented as mean ± s.d. of five biological replicates. *P < 0.05; **P < 0.01; ***P < 0.001; ****P < 0.0001 by two-tailed unpaired t-tests for each BMP. i, Hydrolysis of 1 µM 3,3′ 18:1-S,S BMP by 100 nM recombinant wild-type PLA2G15 and S198A mutant under acidic conditions for 30-s reaction time. Data are presented as mean ± s.d. of three independent replicates. ****P = 0.000014 by two-tailed unpaired t-test. j, As in i using wild-type PLA2G15 in the presence of 20 µM amiodarone and fosinopril compared with the no inhibitor control. Data are presented as mean ± s.d. of three independent replicates. ****P < 0.0001 by two-tailed unpaired t-tests. a.u., arbitrary units; WT, wild type. Panel g was created using BioRender (https://biorender.com). Source data
Fig. 2
Fig. 2. sn2, sn2′ esterification position provides S,S BMP with resistance to PLA2G15.
a, Chemical structures of the main BMP lipids used in this study. b, Hydrolysis of 1 µM of BMP isomers by 100 nM recombinant PLA2G15 for 12 h (pH 5.0). The control had similar reaction components without the enzyme. Data are presented as mean ± s.d. of three independent replicates. ****P < 0.0001 by two-tailed unpaired t-tests. c, Assay as in b for 2 h using 10 µg of CLN5 knockout HEK293T lysosomal lysate; n = 3 individual replicates. **P = 0.0011 and ****P < 0.0001 by two-tailed unpaired t-tests. d, Hydrolysis of 20 µM BMP stereoisomers with primary esters by 100 nM recombinant PLA2G15 over 10 h (pH 5.0). Data are presented as mean ± s.d. of three independent replicates. e, As in d, but 20 µM positional isomers of S,S BMP was used, including a mixture of equimolar amounts. Data are presented as mean ± s.d. of three independent replicates. f, Representative chromatograms from e showing BMP peaks for each isomer in overlaid mode. g,h, Time course analysis from the reaction with an equimolar mixture of 2,2′ BMP and 3,3′ BMP in e showed that the 3,3′ peak was preferentially decreased, followed by the 2,3′ peak, whereas the 2,2′ peak was unchanged. The intensity of each BMP peak was carefully integrated in g, and representative chromatograms are shown in h. i,j, PLA2G15 was incubated with 3,3′ 18:1-S,S BMP in i and 2,2′ 18:1-S,S BMP in j for 10 min (pH 5.0). Each experiment was repeated three times, and a representative graph is shown. Data are presented as mean ± s.d. of three independent replicates. k, Assay as in b for 1 h using 20 µM of various BMP isomers. Data are mean ± s.d. of three independent replicates. **P = 0.0033 and ****P < 0.0001 by two-tailed unpaired t-tests. Source data
Fig. 3
Fig. 3. PLA2G15-deficient cells and tissues accumulate BMP.
a,b, Targeted analyses of BMP lipids revealed that a deficiency in PLA2G15 increased BMP amounts in HEK293T cells. a, Heat map representation of log2-transformed changes in BMP abundance in PLA2G15-deficient HEK293T cells compared to wild-type controls (n = 3 WT and n = 3 PLA2G15 knockout (KO)). The data represent the ratio of the mean of each BMP. Significant changes from the graph are represented by *P < 0.05. P values were calculated using two-tailed unpaired t-tests and are presented in Supplementary Table 2. b, Fold changes in total BMP abundance. Data are presented as mean ± s.d. Statistical analysis was performed. ****P < 0.0001 using two-tailed unpaired t-tests. c, Recombinant PLA2G15 rescued the elevated concentrations of most BMPs resulting from PLA2G15 loss. Fold changes in BMP concentrations in PLA2G15 knockout HEK293T cells after supplementation with wild-type or mutant PLA2G15 (n = 3 independent replicates of each condition). Data are presented as mean ± s.d. *P < 0.05, **P < 0.01, ***P < 0.001 and ****P < 0.0001 by two-tailed unpaired t-tests. d, Heat map representation of log2-transformed changes in BMPs in PLA2G15-deficient mouse tissues compared with their control counterparts (n = 6 WT and n = 6 Pla2g15−/−). Data are presented as the ratio of the mean of each BMP. *P < 0.05 by two-tailed unpaired t-tests and are presented in Supplementary Table 4. e, Normalized abundance of BMP 20:4/20:4. This lipid was undetected in some samples; thus, it is reported separately. Data are presented as mean ± s.d. of six biological replicates. *P = 0.0157 using two-tailed unpaired t-tests. f, Fold changes in total BMP abundance. Data are presented as mean ± s.d. of six biological replicates. ****P < 0.0001 using two-tailed unpaired t-tests. g, Fold changes in sphingomyelin (SM 34:3) in the same samples. Data are presented as mean ± s.d. of six biological replicates. Source data
Fig. 4
Fig. 4. PLA2G15 regulates lysosomal lipid metabolism.
a, Hydrolysis of 1 µM 3,3′ S,S BMP by 5 µg wild-type or PLA2G15 knockout lysosomal lysates for 10 min (pH 5.0). Data are presented as mean ± s.d. of three individual replicates. ****P < 0.0001 using two-tailed unpaired t-tests. b, Pulse-chase experimental design. c, Cells were treated with 10 µM 2,2′ S,S BMP for 2 h, washed and chased with phosphate-buffered saline (PBS) (vehicle) or 100 nM protein for 2 days. Data are mean ± s.d. of three individual replicates. ****P < 0.0001 using two-tailed unpaired t-tests. d, Representative chromatograms during a 4-h wild-type PLA2G15 chase after delivering the indicated BMPs. e, Indicated BMP peaks were measured following a 2-h chase with PLA2G15 proteins after the addition of equimolar 2,2′ S,S and 3,3′ S,S BMP mixture for 2 h. Data are presented as mean ± s.d. of three individual replicates. *P < 0.05 and **P < 0.01 by two-way analysis of variance (ANOVA) with Tukey’s test. f, Quantification of BMP peaks from e during wild-type PLA2G15 chase. Data are presented as mean ± s.d. of three individual replicates. ***P < 0.001 and ****P < 0.0001 using two-tailed unpaired t-tests. g, Representative images of 3-day small interfering RNA (siRNA)-treated BMDMs after LysoFQ-GBA incubation. h, Quantification of LysoFQ-GBA intensity. Data are presented as mean ± s.e.m. Gba+/+: siControl, n = 174 cells; siPla2g15_1, n = 153 cells; siPla2g15_2, n = 185 cells. Gba+/D409A: siControl, n = 170 cells; siPla2g15_1, n = 119 cells; siPla2g15_2, n = 112 cells. *P = 0.0336 and ****P < 0.0001 by one-way ANOVA with Fisher’s least significant difference (LSD) test. i, Representative images of filipin-stained fibroblasts from patients with NPC1 after 2-day siRNA treatment. j, Quantification of filipin intensity. Data are mean ± s.e.m. siControl, n = 27 cells; siPLA2G15_1, n = 17 cells; siPLA2G15_2, n = 16 cells. GM03123: siControl, n = 21 cells; siPLA2G15_1, n = 23 cells; siPLA2G15_2, n = 34 cells). ***P = 0.0003 and ****P < 0.0001 by one-way ANOVA with Kruskal–Wallis test. Scale bars, 20 µm (g,i). Panel b was created using BioRender (https://biorender.com). Source data
Fig. 5
Fig. 5. Genetic ablation of Pla2g15 ameliorates disease symptoms and extends lifespan in NPC1-deficient mouse.
a,b, PLA2G15 depletion rescued the elevated levels of neurodegenerative and liver damage biomarkers in NPC1-deficient mice. NfL concentrations in the CSF (left) and plasma (right) (a) and plasma concentrations of liver transaminases AST (left) and ALT (right) (b) measured on day 56. Data are presented as mean ± s.d. (n = 6, that is, three male and three female mice per genotype). *P < 0.05, **P < 0.01, ***P < 0.001 and ****P < 0.0001 by one-way ANOVA with Fisher’s LSD test. cf, Genetic depletion of PLA2G15 increased Purkinje cell survival (c,d) and decreased astrocytosis, microgliosis and demyelination (e,f) in the CNS of NPC1-deficient mice. Representative images are shown in c,e. Histomorphometry to quantify the number of Purkinje cells per slide and the mean severity score (Methods) of the histopathological evaluation are shown in d and f, respectively. Data are mean ± s.d. (n = 6, that is, three male and three female mice per genotype). **P = 0.0025, ***P = 0.0004 and ****P < 0.0001 by one-way ANOVA comparing NPC1-deficient tissues with other genotypes. gi, Genetic depletion of PLA2G15 improved neurological composite (Methods) score (g) and motor defect (h) and increased survival rate (i) in NPC1-deficient mice. Data are presented as mean ± s.e.m. of 12 mice (six male and six female mice per genotype). In h, ataxia symptoms were measured using a rotarod. Data are presented as mean ± s.e.m. of 12 mice (six male and six female mice per genotype). ****P < 0.0001 by two-way ANOVA comparing Npc1−/−Pla2g15+/+ to either Npc1−/−Pla2g15−/− or Npc1+/+Pla2g15+/+. i, Kaplan–Meier graph for animal survival. Data from n = 12, that is, six male and six female mice per genotype. The curves for Npc1+/+Pla2g15+/+ and Npc1+/+Pla2g15−/− completely overlap. ****P < 0.0001 by log-rank (Mantel–Cox) test. Scale bars, 200 µm, except 20 µm for the cerebellar calbindin inset (ai). CN, cerebral nuclei. Source data
Extended Data Fig. 1
Extended Data Fig. 1. Purification of recombinant PLA2G15.
a, Purification of wildtype recombinant His-tagged lysosomal phospholipase PLA2G15. Representative image of 47.5 kDa PLA2G15-6xHis protein purified to homogeneity and stained with Coomassie Blue. This was repeated at least three times. b, Immunoblot analysis of purified PLA2G15 using anti-His antibody. This was repeated at least three times. c, Purified PLA2G15 is active enzyme. Phospholipase activity determined using 100 nM PLA2G15 against phosphatidylcholine (PC) or phosphatidylglycerol (PG) under acidic conditions for 1 min. Glycerophosphodiester products (GPD) detected using LC-MS. Data are mean ± s.d. of n = 3 independent replicates for each protein. Statistical analysis was performed using two-tailed unpaired t-tests. ***p = 0.0003 and ****p = 0.000051. Control has all reaction components with no enzyme. Gel source data are provided in Supplementary Fig. 1. Source data
Extended Data Fig. 2
Extended Data Fig. 2. PLA2G15 catabolizes lysosomal phospholipids including BMP.
a,b, PLA2G15 hydrolyzes phospholipid substrates isolated from mouse liver lysosomes. Fold changes in the abundance of known PLA2G15 substrates (PC, PE, PG, PI and PS) in (a) and lysophospholipid intermediates (LPC, LPE, LPG, LPI, LPS) in (b) for 30 min or 120 min reactions. c, Non-phospholipids are unchanged in PLA2G15 reaction. Fold changes in sphingomyelin (SM) and triacylglycerol (TG). Each incubation time was compared to control (no enzyme) samples from the same mouse incubated for the same time. Data are mean ± s.d. of n = 5 biological replicates. Statistical analysis was performed using two-tailed unpaired t-tests. *p < 0.05, **p < 0.01, ***p < 0.001 and ****p < 0.0001. d-f, PLA2G15 hydrolyzes BMP and other phospholipid substrates extracted from HEK293T lysosomes. Lysosomal lipids were isolated from HEK293T lysosomes and incubated with recombinant PLA2G15 for 30 min or 120 min. Fold changes in phospholipid substrates (PC, PE, PG, PI and PS) in (d), lysophospholipid intermediates (LPC, LPE, LPG, LPI, LPS) in (e), and BMPs in (f). Data are mean ± s.d. of n = 4 biological replicates. Statistical analysis was performed using two-tailed unpaired t-tests. *p < 0.05, **p < 0.01, ***p < 0.001 and ****p < 0.0001. g, Non PLA2G15 substrates remained unchanged. Fold changes in diacylglycerol (DG) and sphingomyelin (SM). Each incubation time was compared to control samples from each biological replicate incubated at the same time. Data are mean ±  s.d. of n = 4 biological replicates. h, PLA2G15 hydrolyzes synthesized BMP in vitro. Thin Layer Chromatography (see methods) was used to measure the presence of LPG intermediate after incubating wildtype recombinant PLA2G15 with 3,3’ 18:1-S,S BMP under acidic conditions (pH=5.0). Controls had similar reaction buffers except with no enzyme. Putative FA: fatty acid was annotated based on solvent characteristics. Source data
Extended Data Fig. 3
Extended Data Fig. 3. Purification and characterization of lysosomal phospholipases.
a, Purification of recombinant His-tagged PLA2G15 S198A. Representative image of 47.5 kDa PLA2G15 S198A-6xHis protein purified to homogeneity and stained with Coomassie Blue. b, Immunoblot analysis of PLA2G15 S198A using anti-His antibody. c, Melting temperature (Tm) curves indicate that wildtype and S198A mutant maintain thermal stability. Tm is indicated on the graph. d, Purification of recombinant His-tagged PLBD2. Representative image of PLBD2-6xHis protein purified to homogeneity and stained with Coomassie Blue. The three bands are indicative of 66.5 kDa proenzyme, 46.5 kDa matured form and 33 kDa N-terminus pro-domain. e, Immunoblot analysis of PLBD2 using anti-His antibody. f, PLBD2 has no BMP hydrolase activity. BMP Hydrolase activity by 100 nM wildtype recombinant PLA2G15 and PLBD2 proteins under acidic conditions determined using LC-MS. Data are mean ± s.d. of n = 3 independent replicates from each protein. ****p = 0.0000021 using two-tailed unpaired t-tests. Gel source data are provided in Supplementary Fig. 1. Source data
Extended Data Fig. 4
Extended Data Fig. 4. PLA2G15 has high catalytic activity towards BMP under optimized enzyme reaction conditions.
a, BMP hydrolase activity of PLA2G15 has an acidic pH optimum. PLA2G15-6xHis was incubated with 3,3’ 18:1-S,S BMP under the indicated pH conditions. A representative graph is shown for an experiment repeated at least 3 times. Data are mean ± s.d. of n = 3 independent replicates. b, PLA2G15−6xHis was incubated with 1 µM of 3,3’ 18:1-S,S BMP and at different time points and enzyme concentrations. A representative graph indicates linearity in increments across multiple enzyme concentrations at a 30 s time point. c, Standard curves generated from measuring the indicated LPG and GPG standards. d, Standard curves generated from measuring the indicated BMP standards. e-h, PLA2G15 deacylates BMP to LPG with high catalytic efficiency that is comparable to that against PG phospholipid and this activity correlates with acyl chain length. Recombinant PLA2G15 was incubated with the indicated phospholipids under acidic conditions (pH = 5.0) for 30 s and reactions were stopped by heating. Phospholipids were incorporated in liposomes with non-cleavable 18:1 diether PC and indicated LPG intermediates were measured. Each experiment was repeated at least three times, and a representative graph is shown. Kcat/Km is a measure of kinetic efficiency. Data are mean ± s.d. of n = 3 independent replicates. i-l, PLA2G15 deacylates BMP to GPG with high efficiency. Recombinant PLA2G15 was incubated with the indicated phospholipids under acidic conditions (pH = 5.0) for 30 s and reactions were stopped by heating. Phospholipids were incorporated in liposomes with non-cleavable 18:1 diether PC and GPG product was measured. Each experiment was repeated at least three times, and a representative graph is shown. “app” is defined as apparent because the catalytic efficiency is derived from a two-step reaction. Data are mean ± s.d. of n = 3 independent replicates. Source data
Extended Data Fig. 5
Extended Data Fig. 5. sn2, sn2’ esterification position of S,S BMP confers resistance to PLA2G15-mediated hydrolysis in vitro.
a, PLA2G15 efficiently deacylates BMP independent of stereoconfiguration. Hydrolysis of 1 µM BMP stereoisomers by 100 nM recombinant PLA2G15 for 30 s under acidic conditions (pH=5.0). LPG intermediate was measured with LC-MS. Data are mean ±  s.d. of n = 3 independent replicates. b, A representative image of the extracted ion chromatogram of 2,2’ and 3,3’ positional BMP isomers used in this paper. Each compound has a minor amount of 2,3’ isomer. c, LPG monitoring shows minimal difference in the activity of PLA2G15 against positional BMP isomers. Same experiment as in (a) using 1 µM of either 3,3’ S,S BMP or 2,2’ S,S BMP as substrate incubated for 30 secs. Data are mean ±  s.d. of n = 3 independent replicates. d,e, Time course of BMP hydrolysis shows 2,2’ BMP positional isomer confers resistance to PLA2G15 degradation. Hydrolysis of 20 µM 2,2’ S,S BMP or 3,3’ S,S BMP positional isomers as well as equimolar amount of both by 100 nM recombinant PLA2G15 over 10 h under acidic conditions (pH=5.0). Controls had similar reaction buffers except with no enzyme. BMP hydrolase activity was determined using LC-MS by measuring the abundance of LPG intermediate in (d) and GPG product in (e). Data are mean ±  s.d. of n = 3 independent replicates. f, DiffDock of 3,3’ S,S BMP onto AlphaFold human PLA2G15 structure. Catalytic triad residues Ser198, Asp360 and His392 of the active site of PLA2G15 are annotated. g, BMP binds to PLA2G15 S198A at low micromolar concentration. Binding affinity was determined using microscale thermophoresis for 3,3’ S,S BMP. Data presented as mean ± s.e.m. from three measurements. h, Chemical structures of other BMP lipids used in this study. i, Time dependent hydrolysis of BMP stereoisomers confirms S,S stereochemistry of 2,2’ BMP contributes to resistance to PLA2G15-dpendent degradation. Assay as in (d) using indicated BMP isomers over 1 hour under acidic conditions (pH=5.0). Data are mean ±  s.d. of n = 3 independent replicates. Source data
Extended Data Fig. 6
Extended Data Fig. 6. PLA2G15-deficient cells and lysosomes accumulate BMP.
a,b, Targeted analyses of BMP lipids in PLA2G15-deficient cells reveal their accumulation in lysosomes and whole cells. a, Heatmap representation of log2-transformed changes in BMP abundances in lysosomes (IP) and whole cells (WC) of PLA2G15-deficient HEK293T clone1 compared to wildtype control (n = 3 WT and n = 3 PLA2G15 KO). Data are the ratio of the mean of each BMP. Significant changes from the graph are represented by *p < 0.05. P values were calculated using two-tailed unpaired t-tests and are presented in Supplementary Table 1. b, Fold changes in total BMP abundance. The sum of all abundances of measured BMPs was used to generate these values. Data are mean ±  s.d. Statistical analysis was performed using two-tailed unpaired t-tests. **p = 0.0013, ****p = 0.000051. c, Generation of PLA2G15-deficient clones 2 and 3. d, Schematic for fluorescently labeled PLA2G15 uptake experiments. Labeled recombinant PLA2G15 proteins were supplemented to PLA2G15 KO HEK293T cells for 48 h and imaged to validate delivery. e, Representative images of labeled PLA2G15 wildtype and mutant proteins (Alexa488) and lysosomes (Lysotracker) show successful uptake and trafficking in PLA2G15 KO HEK293T cells (left). In the merged images, green and magenta represents the protein and Lysotracker channel respectively and white represents the colocalized spots. Scale bar = 5 µm. Intensity showing that labeled proteins colocalize with Lysotracker (right). Each experiment was repeated three times. f, Recombinant PLA2G15 does not rescue elevated levels of around a fifth of BMPs resulting from PLA2G15 loss. Fold changes in the levels of BMPs in PLA2G15 KO HEK293T cells after supplementation with wildtype or mutant PLA2G15 (n = 3 WT, n = 3 PLA2G15 KO, n = 3 PLA2G15 KO + PLA2G15 and n = 3 PLA2G15 KO + PLA2G15 S198A). Data are mean ±  s.d. Statistical analysis was performed using two-tailed unpaired t-tests. **p = 0.0012, ***p < 0.001 and ****p < 0.0001. g, Targeted analyses of BMP lipids reveal that a deficiency in PLA2G15 increases levels of most BMPs in HeLa cells. Data are mean ±  s.d. (right) (n = 3 WT and n = 3 PLA2G15 KO). Statistical analysis was performed using two-tailed unpaired t-tests. *p < 0.05, **p = 0.0017, ***p < 0.001 and ****p < 0.0001. Individual BMP species and their statistics are presented in Supplementary Table 3. h, Targeted analyses show minimal phospholipid alterations in PLA2G15-deficient mouse tissues (top), HEK293T cells and lysosomes (bottom). Heatmap representation of log2-transformed changes in total lipid class in PLA2G15-deficient mouse tissues (mouse brain, kidney and liver) compared to their control counterparts (n = 6 WT and n = 6 Pla2g15-/-) and PLA2G15-deficient HEK293T cells compared to wildtype cells (n = 3 PLA2G15 KO and n = 3 WT). Data are the ratio of the mean of each lipid class. Significant changes from the graph are represented by *p < 0.05. P values were calculated using two-tailed unpaired t-tests. All measured individual lipid species, total lipid classes and their statistics are presented in Supplementary Table 5. i,j, Loss of PLA2G15 has no effect on BMP synthesis and lysosomal biogenesis. i, Immunoblot analysis of lysosomal markers (LAMP2 and Cathepsin B), the BMP synthase CLN5 and a loading control (Vinculin). j, BMP synthesis in HEK293T cells using labeled phosphatidylglycerol (D5-PG) at the indicated time points. n = 3 WT and n = 3 PLA2G15 KO. Data are mean ±  s.d. Gel source data are provided in Supplementary Fig. 1. Panel d was created using BioRender (https://biorender.com). Source data
Extended Data Fig. 7
Extended Data Fig. 7. Esterification position in BMP confers resistance to hydrolysis in cells.
a, Generation and sequence validation of PLA2G15 KO on a background of CLN5 KO HEK293T cells (DKO). b, BMP signal is diminished in CLN5 PLA2G15 double KO HEK293T cells compared to wildtype. Fold changes of normalized BMP 18:1/18:1 abundance. Data are mean ±  s.d. Statistical analysis was performed using two-tailed unpaired t-tests. ****p = 1.72×10⁻⁸. c, Supplementation of synthesized positional isomers to HEK293T cells demonstrates 2,2’ BMP as the major BMP form in cells. Representative smoothened graphs of the extracted ion chromatograms following addition of 2,2’ and 3,3’ BMP standards to CLN5 PLA2G15 double KO HEK293T cells. The retention times are shown in the list mode (left) while the alignment of standards in overlaid mode (right) indicate 2,2’ BMP as the predominant endogenous form. d, Representative images of labeled PLA2G15 wildtype and mutant proteins (Alexa488) and lysosomes (Lysotracker) show successful uptake and trafficking in CLN5 PLA2G15 KO HEK293T cells. In the merged images, green and magenta represents the protein and Lysotracker channel respectively and white represents the colocalized spots. Scale bar = 5 µm. Each experiment was repeated three times. e, Curve represents intensity showing that labeled proteins (green) colocalizes with Lysotracker (red) as marker for the lysosome. f, Exogenous BMP feeding to cells was optimized for pulse-chase experiments. Normalized BMP abundance was measured following addition of 3,3’ BMP at indicated time points. Data are mean ±  s.d. of n = 3 independent replicates. g, PLA2G15 WT hydrolyzes BMP in cells while cells supplemented with inactive PLA2G15 S198A exhibit reduced BMP hydrolysis capacity. 100 nM PLA2G15 proteins were supplemented in the chase period after delivery of 10 µM 2,2’ S,S BMP for two hours. h-j, Turnover of 3,3’ S,S BMP is rapid while 2,2’ BMP may require positional isomerization for efficient degradation in cells. h, The intensity of each BMP peak (2,2’ BMP peak; left, 2,3’ BMP peak; middle, 3,3’ BMP peak; right) was quantified following a 4-hour chase by PLA2G15 proteins or no enzyme control following addition of either 10 µM of 2,2’ S,S BMP (top) or 3,3’ S,S BMP (bottom). PLA2G15 quickly hydrolyzes 3,3’ and 2,3’ BMP after 3,3’ BMP supplementation while 2,2’ BMP is converted to 2,3’ and 3,3’ BMP. Data are mean ±  s.d. of n = 3 independent replicates. i, Quantitation of endogenous BMP peaks during pulse-chase experiment in cells that were not supplemented with BMP in (h). These levels are minimal compared to cells supplemented with the lipids. Data are mean ± s.d. of n = 3 independent replicates. Statistical analysis was performed using two-tailed unpaired t-tests. ***p = 0.0003 and ****p < 0.0001. j, Quantitation of endogenous BMP peaks in cells that were not supplemented with BMP during pulse-chase experiment (Fig. 4d–f) using equimolar mixture of 2,2’ BMP and 3,3’ BMP. Data are mean ± s.d. of n = 3 independent replicates. Statistical analysis was performed using two-tailed unpaired t-tests. **p = 0.0011 and ***p < 0.001. k, BMP stereoisomers are degraded similarly in cells. Same experiment as in (h) using S,S BMP (left) and S,R BMP (right) to measure total BMP levels during chase. Data are mean ±  s.d. of n = 3 independent replicates. Source data
Extended Data Fig. 8
Extended Data Fig. 8. PLA2G15 role in lysosomal lipid metabolism.
a,b, PLA2G15 supplementation reduces GCase activity in bone marrow derived macrophages (BMDMs). a, Representative fluorescence microscopy images of BMDMs treated with 300 nM recombinant PLA2G15 WT, inactive PLA2G15 S198A or vehicle buffer (PBS) overnight followed by a 30-min incubation of 10 µM LysoFQ-GBA to measure GCase activity. b, Quantification of signal intensity of LysoFQ-GBA. Signals were normalized to vehicle treated BMDMs. Data are mean ± s.e.m. (Vehicle n = 194 fields, PLA2G15 WT n = 118 and PLA2G15 S198A n = 83 of cells). *p < 0.05, by one-way ANOVA Fisher’s LSD test. c, Pla2g15 knockdown in wildtype and mutant Gba mouse-derived BMDMs after two-day treatment with 10 nM control siRNA or two different siRNA that target Pla2g15. qPCR quantification of Pla2g15 mRNA abundance relative to siControl. Actin was used an endogenous control. Data are mean ±  s.e.m. (n = 6 per condition). ****p < 0.0001, by one-way ANOVA Fisher’s LSD test. d, PLA2G15 knockdown in two independent NPC1 patient fibroblast cell lines (Coriell GM03123 and GM18453) after two-day treatment with 10 nM control siRNA or two different siRNA that target PLA2G15. qPCR quantification of PLA2G15 mRNA abundance relative to siControl. GAPDH was used as endogenous control. Data are mean ±  s.e.m. For GM18453 (siControl n = 5, siPLA2G15_1 n = 5 and siPLA2G15_2 n = 6) and for GM03123 (siControl n = 6, siPLA2G15_1 n = 6 and siPLA2G15_2 n = 5). ****p < 0.0001, by one-way ANOVA Fisher’s LSD test. Source data
Extended Data Fig. 9
Extended Data Fig. 9. Haploid genetic screens for genes affecting intracellular cholesterol staining.
a, Schematic overview of the haploid genetic screens in Hap1 cells. Mutagenized cell libraries were stained for intracellular cholesterol staining using fluorescently labeled PFO. Subsequently, cells are sorted by flow cytometry to obtain cell populations with high and low levels of PFO signal. PFO-HIGH versus PFO-LOW represent the 5% of cells with the highest and lowest fluorescent signal, respectively. b,c, Fishtail plots depicting genetic modifiers of intracellular cholesterol in screens of wild-type (b) and NPC1-deficient (c) Hap1 cells. Insertion sites were mapped in each individual population of cells (i.e. PFO-HIGH versus PFO-LOW) and the log mutational index (MI; see Methods) was plotted against the number of trapped alleles per gene. Statistically significant (p < 0.05) positive (whose loss decreases PFO stain) and negative (whose loss increases PFO stain) regulators are coloured blue and orange, respectively. The screen in wild-type Hap1 cells (b) identified NPC1 as a strong negative regulator of cholesterol staining as expected (in red). In contrast, the screen in NPC1-deficient cells (c) identified genes associated with cholesterol uptake and efflux as strong regulators (i.e. MYLIP, LDLR, LDLRAP1, SREBF2, SCAP, MBTPS1, MBTPS2, SCARB1). In addition, PLA2G15 was identified as a genetic modifier of cholesterol staining (in blue). Note that PLA2G15 was not identified to affect the phenotype in wildtype Hap1 cells. Individual gene-trap insertions (dark grey dots) and their distribution across the gene bodies in PFO-HIGH and PFO-LOW channels of both screens are shown for NPC1 and PLA2G15. d, Same as c but lysosomal genes are highlighted. Out of 55 lysosomal enzyme-encoding genes, 6 appear to regulate cholesterol staining in NPC1-deficient cells. The non-significant genes are labeled dark grey (n = 49), while the positive (n = 3) and negative (n = 3) regulators are labeled in dark blue and red, respectively. e, Of the 6 identified lysosomal enzyme genes, PLA2G15 appears to be the strongest positive regulator of the cholesterol staining in NPC1-deficient cells. The other genes include LIPA (Lipase A, lysosomal acid type), PPT1 (Palmitoyl-protein thioesterase 1), NAGLU (N-acetyl-alpha-glucosaminidase), HGSNAT (Heparan-alpha-glucosaminide N-acetyltransferase), and PLBD2 (Phospholipase B Domain Containing 2). The list of 55 enzyme genes can be found in Supplementary Table 6 together with all other screen data. f, Visualization of top hits with known functions in cellular pathways according to GeneCards. Positive and negative regulators are coloured blue and orange, consistent with the fishtail plots in b and c. Positive regulators (in blue) include genes affecting clathrin-mediated endocytosis (CME), receptor trafficking/recycling, endosome maturation/trafficking, and mitochondrial function. Negative regulators (in orange) include genes affecting glycosylation, organelle contact sites, and cargo sorting. Key regulators are indicated with larger font size. Icons in a adapted from Flaticon (https://www.flaticon.com). Images in e adapted from Servier Medical Art (https://smart.servier.com/) under a Creative Commons Licence CC BY 4.0. Source data
Extended Data Fig. 10
Extended Data Fig. 10. Genetic targeting of Pla2g15 ameliorates defects in NPC1-deficient mouse.
a, PLA2G15 depletion increases levels of only few BMPs in NPC1-deficient mice. Fold changes in the levels of selected BMPs measured on the QQQ mass spectrometer in all genotypes over Npc1+/+ Pla2g15+/+ brain (left) and liver (right). Data are mean ±  s.d. (n = 4, for all genotypes except n = 3 for Npc1+/+ Pla2g15-/-). Statistical analysis was performed using two-tailed unpaired t-tests.*p < 0.05 and **p = 0.0072. All measured BMP species and their statistics are presented in Supplementary Table 7. b, Cholesterol staining. Cholesterol was measured in left hemibrain and left liver lobe (n = 4 per group). Data are mean ± s.d. Statistical analysis was performed using one-way ANOVA followed by Bonferroni’s multiple comparisons. **p = 0.00295. c,d, Genetic depletion of PLA2G15 reverses secondary lipid storage in NPC1-deficient brain (c) and liver (d) mouse tissues. Fold changes in the levels of selected total lipid classes in all genotypes compared to Npc1+/+ Pla2g15+/+ brain (c) and liver (d). Data are mean ±  s.d. (n = 5, for all brain genotypes except n = 6 for brain Npc1-/- Pla2g15-/- and n = 6, for all liver genotypes). Statistical analysis was performed using two-tailed unpaired t-tests.*p < 0.05, **p < 0.01, ***p < 0.001, ****p < 0.0001. All measured individual lipid species, total lipid classes and their statistics are presented in Supplementary Table 8. e,f, Purkinje cell count by histomorphometry on Calbindin-immunolabelled CNS sections. e, Proof-of-concept of the image analysis indicating the annotations in the cerebellum (ROI: Region of Interest) and the detection of Purkinje cell soma at different magnifications. f, Representative images of the cerebellum at the level of lobe II/III for comparison among study groups. No label: Scanned whole slide images (WSI) prior to image analysis. Labeled: WSI indicating the annotations of the ROI and the detections of Purkinje cell’s soma. g,h, Genetic ablation of PLA2G15 decreases histopathology lesions in NPC1-deficient mice. The microscopy images are in g and their mean severity scores of each histopathology finding are shown in h. Data are mean ± s.d of n = 6 independent replicates. **p = 0.0063, ***p = 0.0006 and ****p < 0.0001, by one-way ANOVA Fisher’s LSD test comparing NPC1-deficient tissues to other genotypes. Scale bar is 20 µm. i, Body weight assessment for all genotypes. Animal body weight was measured every other day starting at 3 weeks old. Data are mean ±  s.e.m. of n = 12, 6 males and 6 females per genotype. Source data

Update of

References

    1. Medoh, U. N. & Abu-Remaileh, M. The bis(monoacylglycero)-phosphate hypothesis: from lysosomal function to therapeutic avenues. Annu. Rev. Biochem. 10.1146/annurev-biochem-092823-113814 (2024). - PubMed
    1. Showalter, M. R. et al. The emerging and diverse roles of bis(monoacylglycero) phosphate lipids in cellular physiology and disease. Int. J. Mol. Sci.21, 8067 (2020). - PMC - PubMed
    1. Medoh, U. N. et al. The Batten disease gene product CLN5 is the lysosomal bis(monoacylglycero)phosphate synthase. Science381, 1182–1189 (2023). - PubMed
    1. Bulfon, D. et al. Functionally overlapping intra- and extralysosomal pathways promote bis(monoacylglycero)phosphate synthesis in mammalian cells. Nat. Commun.15, 9937 (2024). - PMC - PubMed
    1. Huterer, S. & Wherrett, J. R. Deacylation of bis(monoacylglycero)phosphate by lysosomal and microsomal lysophospholipases from rat liver. Can. J. Biochem.60, 599–607 (1982). - PubMed

LinkOut - more resources