. 2025 Jun;642(8066):232-241.
doi: 10.1038/s41586-025-08931-1. Epub 2025 May 7.

Targeting the SHOC2-RAS interaction in RAS-mutant cancers

Affiliations

Targeting the SHOC2-RAS interaction in RAS-mutant cancers

Zachary J Hauseman et al. Nature. 2025 Jun.

Erratum in

  • Author Correction: Targeting the SHOC2-RAS interaction in RAS-mutant cancers.
    Hauseman ZJ, Stauffer F, Beyer KS, Mollé S, Cavicchioli E, Marchand JR, Fodor M, Viscomi J, Dhembi A, Katz S, Faggion B, Lanter M, Kerr G, Schildknecht D, Handl C, Maddalo D, Pissot Soldermann C, Brady J, Shrestha O, Nguyen Z, Leder L, Cremosnik G, Lopez Romero S, Hassiepen U, Stams T, Linder M, Galli GG, Guthy DA, King DA, Maira SM, Thoma CR, Ehmke V, Tordella L. Hauseman ZJ, et al. Nature. 2025 Jul;643(8072):E14. doi: 10.1038/s41586-025-09309-z. Nature. 2025. PMID: 40595365 Free PMC article. No abstract available.

Abstract

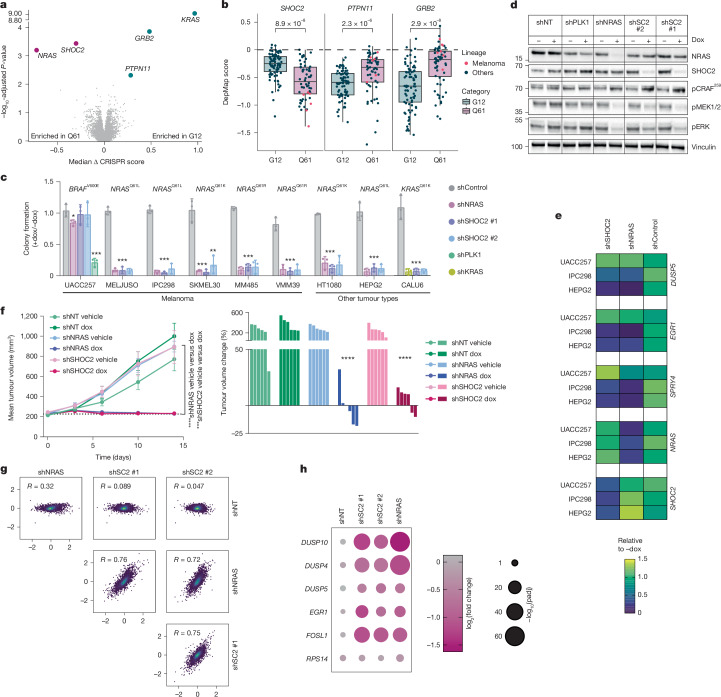
Activating mutations in the rat sarcoma (RAS) genes HRAS, NRAS and KRAS collectively represent the most frequent oncogenic driver in human cancer1. They have previously been considered undruggable, but advances in the past few years have led to the clinical development of agents that target KRAS(G12C) and KRAS(G12D) mutants, yielding promises of therapeutic responses at tolerated doses2. However, clinical agents that selectively target NRAS(Q61*) mutants (* represents 'any'), the second-most-frequent oncogenic driver in melanoma, are still lacking. Here we identify SHOC2, a component of the SHOC2-MRAS-PP1C complex, as a dependency of RAS(Q61*) tumours in a nucleotide-state-dependent and isoform-agnostic manner. Mechanistically, we found that oncogenic NRAS(Q61R) forms a direct interaction with SHOC2, evidenced by X-ray co-crystal structure. In vitro high-throughput screening enabled the discovery of small molecules that bind to SHOC2 and disrupt the interaction with NRAS(Q61*). Structure-based optimization led to a cellularly active tool compound that shows inhibition of mitogen-activated protein kinase (MAPK) signalling and proliferation in RAS-mutant cancer models, most notably in NRAS(Q61*) settings. These findings provide evidence for a neomorph SHOC2-(canonical)RAS protein interaction that is pharmacologically actionable and relevant to cancer sustenance. Overall, this work provides the concept validation and foundation for developing new therapies at the core of the RAS signalling pathway.


Conflict of interest statement

Competing interests: Z.J.H., F.S., K.S.B., S.M., E.C., J.-R.M., A.D., J.V., S.K., B.F., M. Lanter, G.K., D.S., C.P.S., J.B., O.S., Z.N., L.L., G.C., S.L.R., U.H., T.S., M. Linder, G.G.G., D.A.G., D.A.K., S.-M.M., V.E. and L.T. are employees and shareholders of Novartis Pharma. M.F., C.H., D.M. and C.R.T. are former employees of Novartis AG.

Figures

Fig. 1
Fig. 1. CRISPR knockout screen in Ba/F3 lines identifies specific RAS-mutant dependencies.
a, Schematic describing the Ba/F3 model of oncogene addiction. Ba/F3 relies on IL-3–JAK–STAT signalling for survival unless engineered to express oncogenes such as RAS. Mut, mutation. b, Effect on cell viability for the indicated Ba/F3 isogenic models after treatment for 72 h with the KRAS(G12C) inhibitor adagrasib or the KRAS(G12D) inhibitor MRTX1133. DMSO, dimethyl sulfoxide. c, Genetic screen diagram: Ba/F3 stably engineered to co-express Cas9 and different NRAS and KRAS mutants were transduced with a mouse genome-wide sgRNA library, antibiotic selected, expanded and subjected to genomic DNA isolation and next-generation sequencing (NGS) analysis to identify sensitizer and rescuer genes. d, PCA bi-plot representing PC1 (x axis) and PC2 (y axis) from the 250 most variable genes in the screen. Coloured dots represent PCA scores for each condition. Arrows represent loadings for genes driving the PCA distribution, coloured according to the contribution to the eigenvectors. Selected genes are highlighted with a black dot. e, Scatter plot representing hits from differential representation analysis between screens in Q61 lines and G12 lines. The x axis represents scoring and the y axis represents statistics (see the ‘CRISPR screen analysis’ section in the Methods). Non-significant genes (absolute Q < 2 and RSA > –2) are represented as a density plot to avoid overplotting. f, Dot–plot representing screening results of selected hits. Colours represent Q scoring and dot sizes represent statistical significance (RSA). g, Schematic illustrating the RAS signalling cellular context for the indicated RAS G12 and Q61 hits. h, Effect on cell viability for the indicated Ba/F3 isogenic models following 72 h treatment with inhibitors for SHP2, SOS1 and IGFR. The dotted lines indicate 50% of growth inhibition. i, Effect on cell viability of the indicated Ba/F3 isogenic models following transduction with sgRNAs against SHOC2, sgSHOC2 or non-targeting sgNT. Data in b, h and i are mean ± s.d. of n = 3 biologically independent samples. Images in a, c and g created using BioRender (Galli, G., 2025): a, https://BioRender.com/c48w611; c, https://BioRender.com/m41c915; g, https://BioRender.com/q07k743. Source Data
Fig. 2
Fig. 2. SHOC2 genetic validation in cancer models.
a, Scatter plot showing the mean difference (x axis) and significance (y axis; P-values are Benjamini–Hochberg corrected for multiple testing based on a two-sided Mann–Whitney U-test) of DepMap scores in cell lines with RAS mutations (Q61 on the left, G12 on the right). b, Box-plot (median, first and third quartiles are shown with whiskers extending to the 95th percentile) of DepMap score for the indicated genes in cell lines with the indicated RAS mutations. P-values obtained by two-sided Wilcoxon t-test (Q61, n = 60; G12, n = 82). c, Quantification of colony assays for the indicated cell models with doxycycline (dox)-inducible shRNAs treated with dox (+dox) or DMSO (−dox) (mean ± s.d., n = 3 independent experiments). Significance was determined using a two-tailed t-test (*P < 0.05, **P < 0.005, ***P < 0.001). d, Lysates from IPC298 lines with the indicated dox-inducible shRNAs treated with dox (+) or DMSO (−) were immunoblotted with the indicated antibodies. A representative image of three independent experiments is shown. e, Effect of shSHOC2, shNRAS or shControl on the expression of the indicated genes in the UACC275, IPC298 and HEPG2 cell lines. f, Left, MUGMEL2 xenograft growth with or without dox induction of the indicated shRNAs (mean ± s.e.m., n = 6 mice per group). Significance was determined using a one-way ANOVA with Tukey’s multiple-comparison test (***P = 0.0003, ****P < 0.0001). Right, change in tumour volume after 14 days of treatment is presented as a waterfall plot of individual tumours (n = 6 mice per group). Significance was determined by two-tailed unpaired t-test (****P < 0.0001). g, Pearson correlation of global gene expression log2FCs. h, Change in mRNA expression of the indicated RAS/MAPK-induced genes and control housekeeping gene (RPS14) between KD conditions in the tumours from Extended Data Fig. 2d. shSC2, shSHOC2; shNT, non-targeting shRNA; P-values were calculated using the DESeq2 Wald test and are FDR corrected). Source Data
Fig. 3
Fig. 3. Biochemical–physical and structural evidence of SHOC2 in complex with oncogenic canonical RAS proteins.
a, Sedimentation velocity profiles expressed as c/s distribution plots. Monomeric sedimentation coefficients (S) were observed for SHOC2 (blue) and NRAS (grey), while NRAS(Q61R)–GTP mixed with SHOC2 (orange) displayed larger S values consistent with a binary complex. A representative example of three independent experiments is shown. b, Surface and ribbon representation of the binary interaction of SHOC2 (light violet) and NRAS(Q61R) (grey) (Protein Data Bank: 9BTM). RAS-bound magnesium is shown as a green sphere adjacent to the stick representation of GTP. c, The interaction between SHOC2 and MRAS(Q71R) (orange; SMP complex structure with PP1Cα hidden) or NRAS(Q61R) (grey) is shown aligned through the SHOC2 solenoid (light violet; model shown from the SHOC2–NRAS binary structure), highlighting the difference in orientation between the binary and ternary complex models when aligned with the SHOC2 solenoid as the key object. d, Detailed representation of key interactions between NRAS(Q61R) SWI (pink)/SWII (green) and SHOC2 (light violet). Source Data
Fig. 4
Fig. 4. Pharmacological disruption of SHOC2–RAS PPI.
a, Representation of SHOC2 bound to peptide 4 (light violet surface; PDB: 9BTN), compound (R)-5 (yellow spheres; PDB: 9OVJ) and NRAS(Q61R) (grey; PDB: 9BTM). Key regions of overlap highlight the RAS binding site on the concave face as uniquely ligandable on the SHOC2 surface. b, Top, compound (R)-5 interacts with R223 and Q269 via its carboxylic acid. Middle, benzo[d]oxazol-2(3H)-one mediates three hydrogen bonds. Bottom, aliphatic regions in multiple side chains form a shallow hydrophobic patch bound by the chloro-diphenyl moiety of (R)-5. Colours as in a. c, Top, TR-FRET data for the interaction between NRAS(Q61R) and SHOC2 in the presence of varying concentrations of compounds 1 (grey) or 6 (blue). Data represent two technical replicates. Bottom, table summarizing the slope and IC50 values (more repeats are shown in Table 1). d, NanoBiT results showing the compound 6 cellular displacement of SHOC2–NRAS(Q61mut) PPI versus a control pair (mean ± s.d., n = 3 biologically independent samples). e, Lysates from MELJUSO cells treated for 24 h with increasing doses of compound 6 and immunoblotted with the indicated antibodies. f, Lysates from MELJUSO (left) and A375 (right) cells treated with compound 6 (30 µM) and collected at different time points were immunoblotted with the indicated antibodies. g, Densitometry quantification of pCRAF/CRAF and pERK/ERK levels from the MELJUSO immunoblot in f. The images in eg are representative of two independent experiments. h, Differences in 3D cell growth between MELJUSO (top) and A375 (bottom) BRAF cells treated twice a week with DMSO or compound 6 over time (mean ± s.d. from n  =  6 biologically independent replicates). Graphs are representative of two independent experiments. i, Changes in mRNA expression of RAS/MAPK-induced genes and control genes (RPS14, NRAS and SHOC2) in MELJUSO cells treated with compound 6 or 7 versus DMSO at the indicated conditions (P-values were computed using the edgeR QLF test and FDR corrected). FC, fold change. Source Data
Extended Data Fig. 1
Extended Data Fig. 1. Identification of RAS G12C/D, Q61R dependencies.
a, Immunoblot analysis of engineered isogenic Ba/F3 models. Image representative of two independent immunoblots. b, Scatter plot representing hits from differential representation analysis between screens in individual Ba/F3 cell lines and plasmid DNA library. X-axis represents scoring while y-axis represents statistics (see CRISPR screen analysis in Methods). Non-significant genes (Abs Q < 2 and RSA > −2) are depicted as density plot to avoid overplotting. c, Dot-plot representing screening results of selected hits for the labelled subgroups. Colors represent Q scoring and dot sizes represent statistical significance (RSA). d, Immunoblot analysis and relative quantifications of Ba/F3 isogenic models subjected to treatment with indicated inhibitors. Image representative of two independent immunoblots. Source Data
Extended Data Fig. 2
Extended Data Fig. 2. SHOC2 genetic validation in RASQ61* melanoma models.
a, Images of colony formation assays (representative of three independent experiments) quantified in Fig. 1c portraying multiple cell models transduced with dox-inducible shRNAs under DMSO (−) or dox (+) growing conditions. b, c, Lysates from UACC257 (b) and Calu6 (c) cell models transduced with the indicated dox-inducible shRNAs treated with DMSO (−) or dox (+) were immunoblotted with the indicated antibodies. A representative image of two independent experiments is shown. d, IPC298 xenografts growth with or without dox induction of indicated shRNAs. Dox treatment was performed when tumors reached the size of approximately 200 mm3 as indicated by the dotted lines (mean ± s.e.m., n  = 8-10 mice per group as indicated in the figure). Significance is determined using a two-way ANOVA with Tukey’s multiple comparison test (ns=not significant, *p < 0.05; ****p < 0.0001). e, RT-qPCR mRNA analysis of MUGMEL2 tumors (at endpoint) for the indicated genes (shNT = non-targeting shRNA; veh = vehicle treated; DOX = doxycycline treated; mean ± s.d., n = 6 mice per group. Significance is determined using a two tailed unpaired t-test (***p = 0.0006, ****p < 0.0001). f, Gene set enrichment in knock-down responses quantified with RNA-seq. Displayed are normalized enrichment scores computed with R fgsea and FDR adjusted p-values. Source Data
Extended Data Fig. 3
Extended Data Fig. 3. Pharmacological disruption of the SHOC2-RASQ61* complex.
a, Sedimentation velocity profiles expressed as c/s distribution plots; SHOC2 (light blue) and KRAS (grey) alone display lower sedimentation coefficients (S). When KRASQ61R loaded with GTP is mixed with SHOC2 a species with larger S value is obtained (orange) indicating a binary complex. b, The interaction surface between NRASQ61R (orange cartoon-surface) and a portion of the concave surface of SHOC2 (green cartoon) is highly coincident with the sole ligandable region of the SHOC2 surface (pink surface). c, HMQC 2D NMR spectra of 13C methyl methionine labelled SHOC2(80-582) at 35 μM with increasing concentrations of compound 1; chemical shift perturbations observed at M173 and M219. d, Determination of dissociation constant (Kd) for binding of compound 1 to SHOC2(80-582) from observed differences in chemical shifts. e, Surface representation of the Peptide 4/SHOC2 interaction. Peptide 4 adopts a conformation that is stabilized by intra and intermolecular hydrogen bonds and leverages hydrophobic and charged residues on the SHOC2 surface. f, Peptide 4 produces a key interaction by coordinating the aspartic acid carboxylic acid to SHOC2 R177, an interaction leveraged by compound (R)-5. Source Data
Extended Data Fig. 4
Extended Data Fig. 4. SHOC2 inhibitor specificity.
a, SHOC2 interacting with either NRASQ61R or compound (R)-5, highlighting SHOC2 G290A (yellow density) clashing with (R)-5, but not with NRASQ61R b, DSF assay showing no significant difference in Tm between SHOC2 WT and SHOC2 G290A. Y and X-axis show the fluorescence intensity derivative and temperature measured (°C) respectively. c, SHOC2 G290A binds NRASQ61R in vitro, measured by SPR. d, SHOC2 G290A is insensitive to compound 6 mediated RASQ61R-displacement in vitro, measured by TR-FRET. Comparison with SHOC2 WT is shown. Compound 7 is inactive on SHOC2 G290A and ~100-fold less active on SHOC2 WT. Assay sensitivity demonstrated with untagged SHOC2, resulting in PPI disruption with similar IC50 in both SHOC2 WT and G290A conditions (n = 2 technical replicates). Bottom, table summarizing IC50 values (for compound 6 and 7, IC50 values for 2 independent experiments. The images in (b, c, d) are representative of two independent experiments. e, (bottom) Immunoblot showing levels of indicated transfected proteins in HEK293 cells. Image representative of n = 3 independent experiments. (top) Results of SHOC2-NRASQ61K NanoBiT assay under the conditions described in the table below it. No significant difference observed in NRASQ61K-SHOC2G290A vs. NRASQ61K-SHOC2WT interactions (n = 4 independent experiment). f, In the same NanoBit assay, SHOC2 G290A is insensitive to compound 6 mediated RASQ61R-displacement vs. SHOC2 WT (top), while Compound 7 is inactive on both proteins (bottom) (n = 2 biologically independent samples). g, Volcano plot illustrating differential gene expression in RNA-seq analysis of MELJUSO treated with compound 6 or 7 at the indicated conditions. Red quadrants illustrate significantly upregulated genes while blue quadrants significantly downregulated genes. P-values were computed with edgeR QLF test, and significance was set at an FDR adjusted p-value < 0.01. h, Gene set enrichment analysis of differential gene expression between compound 6 and DMSO computed with R fgsea. Displayed are normalized enrichment scores and FDR adjusted p-values. Source Data
Extended Data Fig. 5
Extended Data Fig. 5. SHOC2 inhibitor cellular effects.
a, b, Immunoblot analysis of total cell lysates (TCL) and RAF-RBD pull-down of MELJUSO (a) and A375 (b) cells after compound 6 treatment (+) or DMSO (−) at indicated conditions. Images are representative of two independent experiments. c, Immunoblot analysis of cell lines subjected to treatment with indicated inhibitors (4 h, 30 µM). d, Immunoblot analysis of SHOC2 shRNA-expressing cell lines treated with DMSO (−) or doxycycline (+) to regulate SHOC2 expression. Images in (c, d) are representative of two independent immunoblots. e, Differences is 3D cell growth between a panel of RAS mutant (top) and RAS WT cell lines (bottom) treated bi-weekly with DMSO or compound 6 over the indicated time period (mean ± s.d. from n = 6 technical replicates. Graph representative of n = 2 independent experiments). Source Data

References

    1. Martínez-Jiménez, F. et al. A compendium of mutational cancer driver genes. Nat. Rev. Cancer20, 555–572 (2020). - PubMed
    1. Punekar, S. R., Velcheti, V., Neel, B. G. & Wong, K.-K. The current state of the art and future trends in RAS-targeted cancer therapies. Nat. Rev. Clin. Oncol.19, 637–655 (2022). - PMC - PubMed
    1. Simanshu, D. K., Nissley, D. V. & McCormick, F. RAS proteins and their regulators in human disease. Cell170, 17–33 (2017). - PMC - PubMed
    1. Hobbs, G. A., Der, C. J. & Rossman, K. L. RAS isoforms and mutations in cancer at a glance. J. Cell Sci.129, 1287–1292 (2016). - PMC - PubMed
    1. The Cancer Genome Atlas Network. Genomic classification of cutaneous melanoma. Cell10.1016/j.cell.2015.05.044 (2015). - PMC - PubMed

MeSH terms