Meta-Analysis
. 2025 Jul;9(7):1470-1487.
doi: 10.1038/s41562-025-02145-1. Epub 2025 May 7.

Genome-wide association meta-analysis of age at onset of walking in over 70,000 infants of European ancestry

Affiliations
Meta-Analysis

Genome-wide association meta-analysis of age at onset of walking in over 70,000 infants of European ancestry

Anna Gui et al. Nat Hum Behav. 2025 Jul.

Abstract

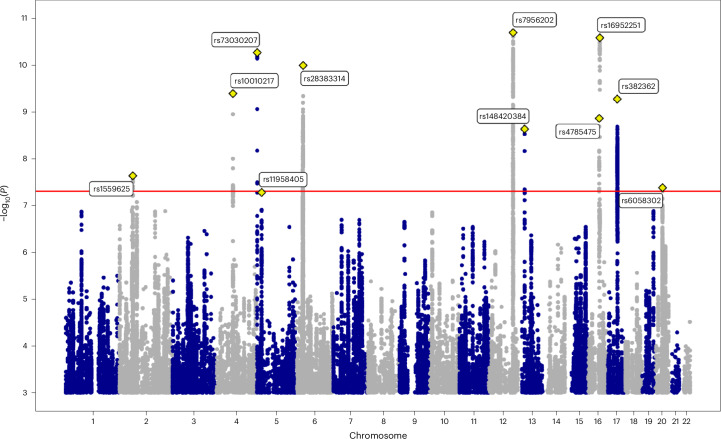
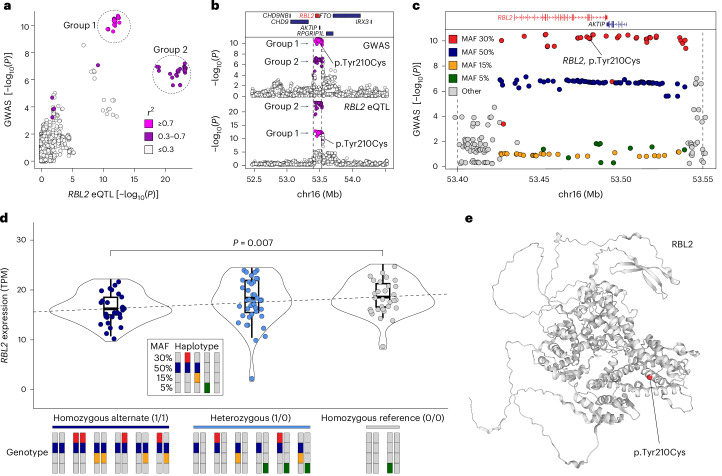
Age at onset of walking is an important early childhood milestone which is used clinically and in public health screening. In this genome-wide association study meta-analysis of age at onset of walking (N = 70,560 European-ancestry infants), we identified 11 independent genome-wide significant loci. SNP-based heritability was 24.13% (95% confidence intervals = 21.86-26.40) with ~11,900 variants accounting for about 90% of it, suggesting high polygenicity. One of these loci, in gene RBL2, co-localized with an expression quantitative trait locus (eQTL) in the brain. Age at onset of walking (in months) was negatively genetically correlated with ADHD and body-mass index, and positively genetically correlated with brain gyrification in both infant and adult brains. The polygenic score showed out-of-sample prediction of 3-5.6%, confirmed as largely due to direct effects in sib-pair analyses, and was separately associated with volume of neonatal brain structures involved in motor control. This study offers biological insights into a key behavioural marker of neurodevelopment.


Conflict of interest statement

Competing interests: O.A.A. is a consultant to cortechs.ai and Precision Health, and receives speaker honoraria from Janssen, Lundbeck, Sunovion, Lilly, and Otsuka. S.J.S. receives research funding from BioMarin Pharmaceutical. The other authors declare no competing interests.

Figures

Fig. 1
Fig. 1. Manhattan plot of the GWAS meta-analysis of age at onset of walking.
The x axis shows genomic position (chromosomes 1–22) and the y axis shows statistical significance as −log10(P value). P values are two-sided and based on an inverse-variance standard-error-weighted fixed-effects meta-analysis. N = 70,560. The horizontal red line indicates the P-value threshold for genome-wide statistical significance (P = 5 × 10−8). P values were not adjusted for multiple comparisons. The lead SNP for each genome-wide significant locus is labelled and indicated with a yellow diamond. The inflation factor λGC for this GWAS was 1.27 and LDSC intercept was 1.00 (s.e. = 0.01), suggesting that inflation was due to polygenicity of AOW (see Supplementary Note A for a discussion). The meta-GWAS QQ plot by allele frequency is presented in Supplementary Fig. 9. SNPs with P-values < 0.001 (corresponding to −log10(P) > 3) are presented as data points.
Fig. 2
Fig. 2. Co-localization of variants in genomic locus 2.
Genomic locus 2 overlaps with a region in which SNPs are predicted to alter RBL2 expression in the human brain (eQTLs). a, The GWAS evidence for association with age at onset of walking [−log10(P value), y axis] is plotted against the statistical evidence of being an eQTL for RBL2 in human adult cerebellum [−log10(P value), x axis] for each SNP (points) within a 2-Mb window around the GWAS peak. Points are coloured by linkage disequilibrium (LD) correlation with the lead SNP (rs17800727) and these values were used to define two groups. b, The SNPs from a are shown in the 2-Mbp genomic region (x axis, GRCh37) with protein-coding genes (top), GWAS evidence for association with age at onset [−log10(P value), middle] and statistical evidence for RBL2 expression in human cerebellum [−log10(P value), y axis, bottom]. Point colour matches a. c, A zoomed-in view of the peak indicated by dashed vertical lines in b shows the GWAS evidence for association with age at onset of walking [−log10(P value), y axis] by genomic position (x axis, GRCh37). Colour indicates the MAF of each SNP. The locations of protein-coding genes in the region are indicated at the top. An SNP (rs17800727) that results in a missense variant (p.Tyr210Cys) in RBL2 is marked. d, Swarm, violin and boxplots showing the distribution of RBL2 expression in the prefrontal cortex (transcripts per million (TPM), y axis). Each point represents the expression of RBL2 in 1 of 87 prenatal human cortices (BrainVar) split by genotype into 3 groups on the basis of zygosity for the Group 2 50% MAF SNPs. The P value represents the difference between the homozygous alternate (N = 28) and homozygous reference (N = 30) groups. The centre is the median expression value. The lower and upper bounds of the box correspond to the first and third quartiles (the 25th and 75th percentiles). The upper/lower whiskers extend from the upper/lower bound to the largest/smallest value no further than 1.5× the interquartile range. Data beyond the end of the whiskers are outlying points and are plotted individually. Bars at the bottom indicate pairs of haplotypes (derived from the data shown in c making up each genotype). e, Structure of the RBL2 protein predicted by AlphaFold with the location of rs17800727, p.Tyr210Cys in red.
Fig. 3
Fig. 3. Beta estimates of the prediction of age at onset of walking for the five MoBa subsamples, Lifelines, NSHD, NTR between- and NTR within-sib-pair polygenic score analyses.
Data are presented as beta estimates ±s.e. of the beta estimate of a linear regression model testing the association between age at onset of walking and the polygenic score (two-tailed P values). N = 11,660 (MoBa-1, MoBa-2, Moba-3), N = 11,661 (MoBa-4, MoBa-5), N = 3,415 (Lifelines), N = 2,592 (NSHD); N = 2,508, N pairs = 1,254 (NTR between- and NTR within-sib-pair).
Fig. 4
Fig. 4. Genetic overlap between age at onset of walking and other complex traits.
a, Genetic correlation between AOW and physical health (purple), cognitive traits (blue), neurodevelopmental conditions and psychiatric disorders (orange), cortical phenotypes (grey) and non-preregistered motor phenotypes (green). Data are presented as correlation coefficients ± 95% CIs. Filled circles indicate significant correlations based on CIs. Filled squares indicate the traits that remain significantly genetically correlated with age at onset of walking after adjusting the two-sided P values obtained from LDSC for multiple testing using Bonferroni correction. The maximum GWAS sample sizes for each of the traits included in the LDSC analysis are as follows: age at onset of walking N = 70,560; childhood BMI N = 61,111; birth weight N = 42,212; adult BMI N = 795,640; educational attainment N = 765,283; cognitive performance N = 269,867; autism Ncases = 18,382, Ncontrols = 27,969; ADHD Ncases = 38,691, Ncontrols = 186,843; schizophrenia Ncases = 67,390, Ncontrols = 94,015; cross-disorders Ncases = 232,964, Ncontrols = 494,162,; major depression Ncases = 170,756, Ncontrols = 329,443; bipolar disorder Ncases = 41,917, Ncontrols = 371,549; cortical phenotypes (fractional anisotropy, mean diffusivity, intracellular volume fraction, orientation dispersion index, isotropic volume fraction, cortical thickness, folding index, Gaussian curvature, intrinsic curvature index, local gyrification index, mean curvature, cortical surface area, grey matter volume) N = 36,663; muscle weakness in the pincer grip Ncases = 48,596, Ncontrols = 207,927; self-reported walking pace N = 450,967; early motor coordination N = 31,797; Parkinson’s disease Ncases = 26,421, Ncontrols = 442,271. b, Venn diagrams representing MiXeR bivariate analyses between AOW and the 6 other phenotypes with which it has Bonferroni-significant genetic correlations. The size of the circles and the numbers within them represent the relative polygenicity of each trait (that is, how many genetic variants contribute to 90% of the SNP heritability). The overlap between each pair of circles represents the degree of genetic overlap between the two phenotypes, that is, the number of shared variants in thousands, along with the standard error. Numbers and standard errors in sections of the circles that do not overlap represent the number of variants unique to that phenotype. The corresponding rg, estimated using LDSC, is shown below each Venn diagram.
Fig. 5
Fig. 5. Brain regions with statistically significant positive correlation between tissue volume and age at onset of walking polygenic score in the Developing Human Connectome Project cohort.
Thresholding t-statistic image at t > 0.95 (two-sided statistical test). Significant voxels were overlaid on the 40-week neonatal brain template in sagittal, coronal and axial planes. White arrows indicate significant brain structures involved in motor control. N = 264.
Extended Data Fig. 1
Extended Data Fig. 1. Partitioned heritability enrichment by functional annotation.
Enrichment of age at onset of walking GWAS signal by functional genomic annotation. Points represent the heritability enrichment estimate +/− standard errors of the enrichment estimates, obtained in LDSC (two-sided test). The dashed horizontal line represents statistical significance based on Bonferroni correction for multiple testing (Supplementary Table 12). Genomic annotations with significant enrichment for age at onset of walking are labelled. Dots are colored using a spectrum of colors based on alphabetical order.
Extended Data Fig. 2
Extended Data Fig. 2. Partitioned heritability enrichment by cell type.
Tissue enrichment based on LDSC partitioned heritability analysis. Statistically significant enrichments after correcting two-sided p-values for multiple comparisons using the Bonferroni method are highlighted as yellow bars.

References

    1. Langendonk, J. M. et al. Assessment of motor milestones in twins. Twin Res. Hum. Genet.10, 835–839 (2007). - PubMed
    1. Help your child grow and thrive. Centers for Disease Control and Preventionhttps://www.cdc.gov/ncbddd/actearly/index.html (2025).
    1. WHO Multicentre Growth Reference Study Group WHO Motor Development Study: windows of achievement for six gross motor development milestones. Acta Paediatr. 95, 86–95 (2006). - PubMed
    1. Bowler, A., Arichi, T., Austerberry, C., Fearon, P. & Ronald, A. A systematic review and meta-analysis of the associations between motor milestone timing and motor development in neurodevelopmental conditions. Neurosci. Biobehav. Rev.167, 105825 (2024). - PubMed
    1. Kim, S. W. et al. Clinical characteristics of developmentally delayed children based on interdisciplinary evaluation. Sci. Rep.10, 8148 (2020). - PMC - PubMed

Publication types

Grants and funding

LinkOut - more resources