. 2025 May 7;31(1):177.
doi: 10.1186/s10020-025-01202-9.

COX-2 inhibition as a therapeutic strategy for bone loss in Staphylococcus aureus osteomyelitis

Affiliations

COX-2 inhibition as a therapeutic strategy for bone loss in Staphylococcus aureus osteomyelitis

Yuhui Chen et al. Mol Med. .

Abstract

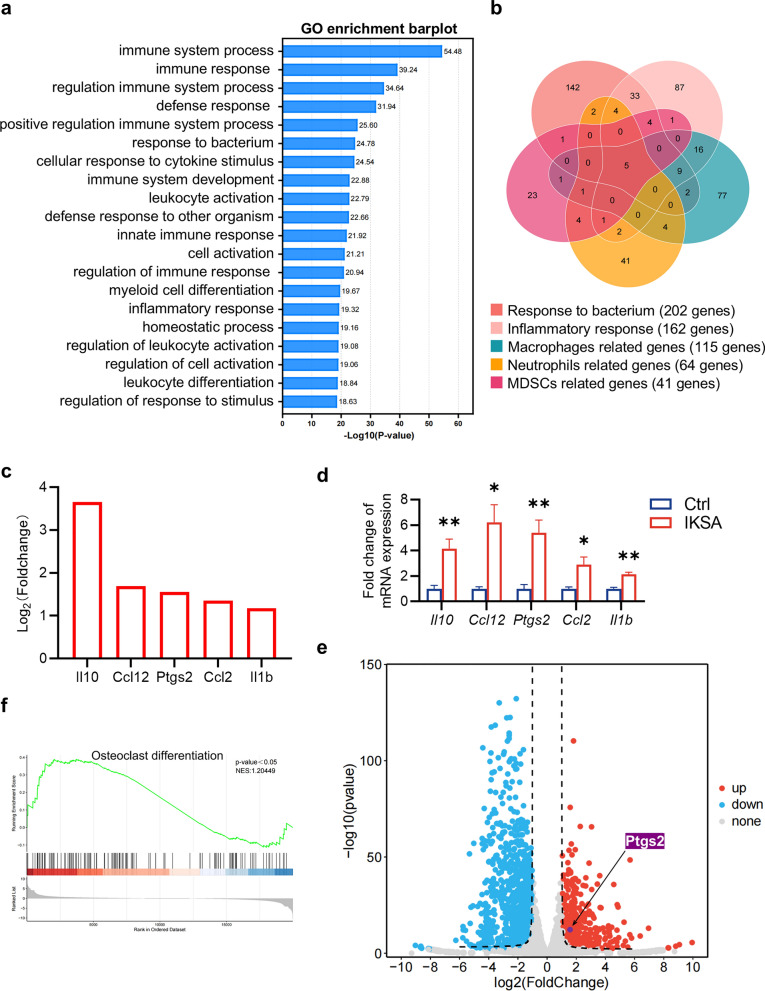
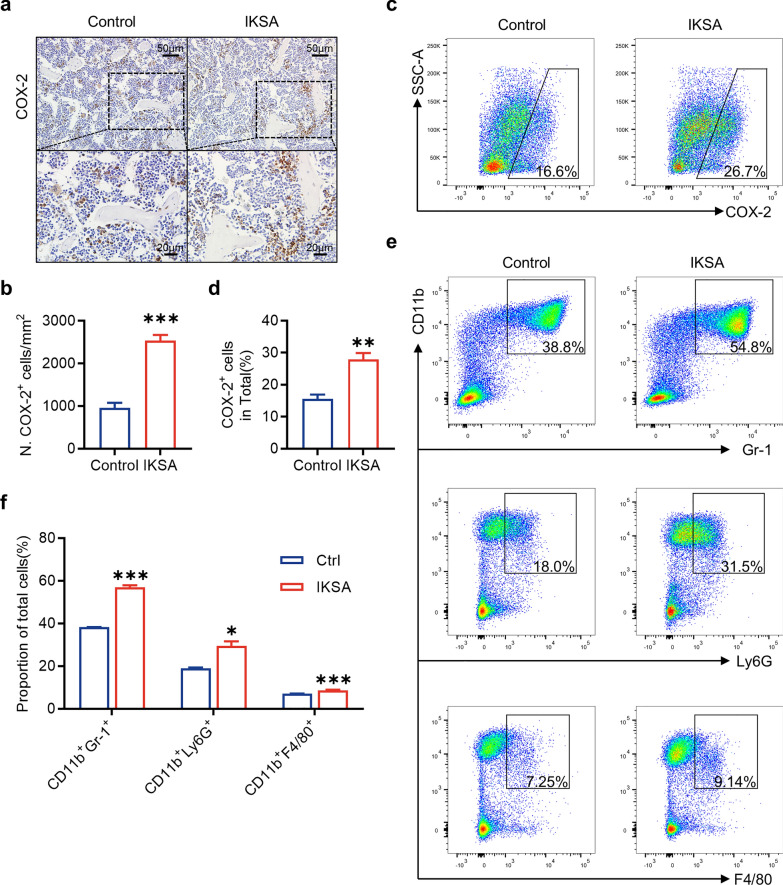
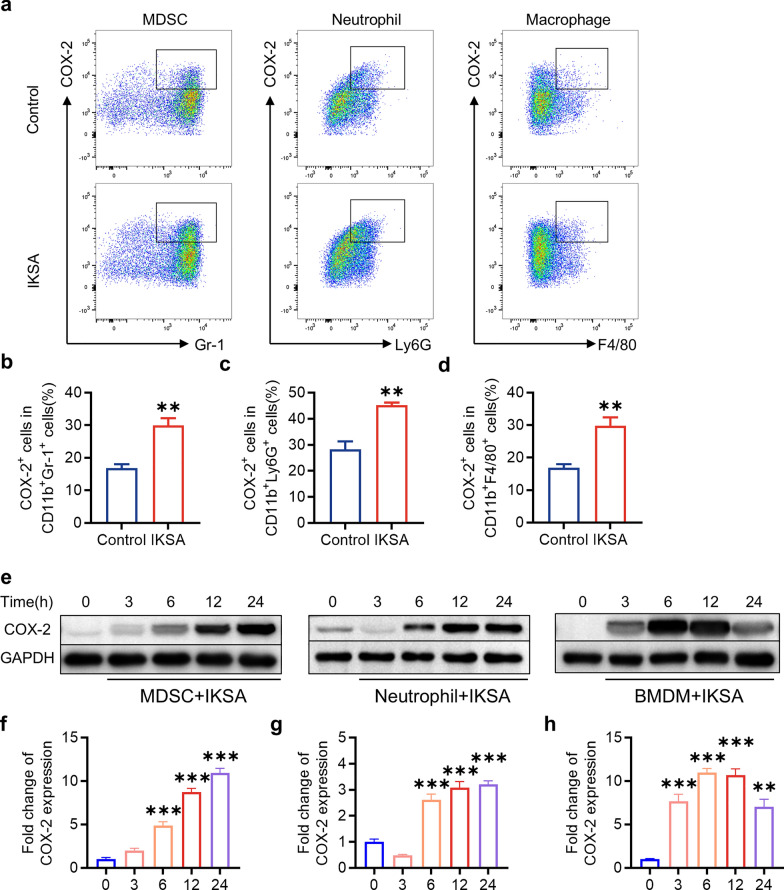
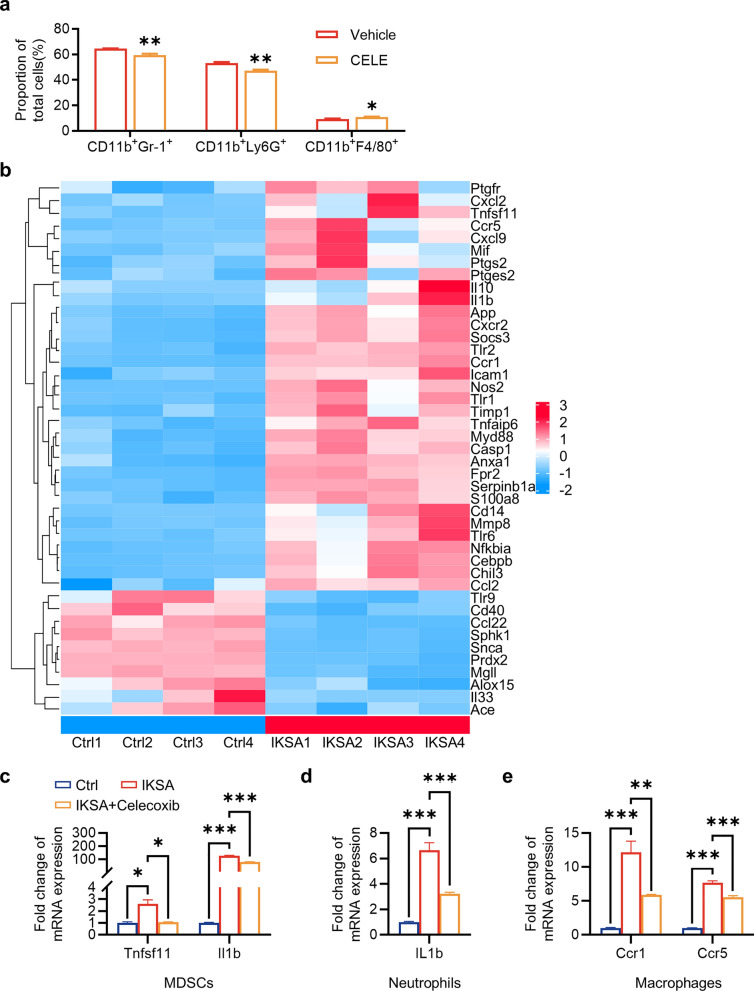
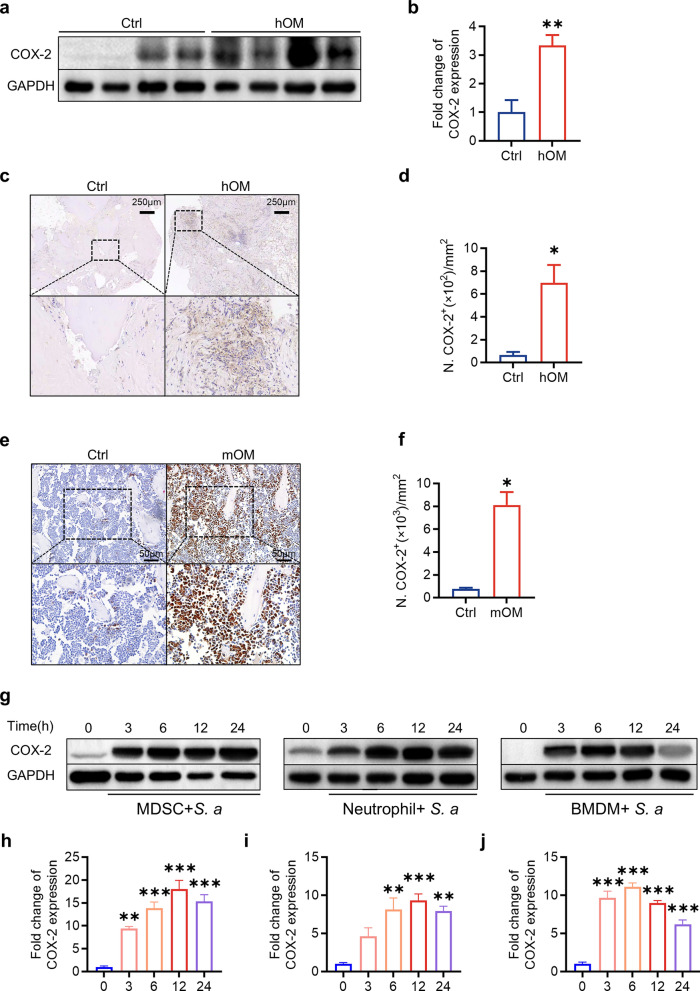
Bone loss in Staphylococcus aureus (S. aureus) osteomyelitis poses a serious challenge to orthopedic treatment, but the underlying mechanism of systemic osteoporosis caused by chronic infection is not completely clear. In this study, γ-irradiation-killed S. aureus (IKSA) was applied to simulate the inflammation and explore the mechanism of systemic bone loss caused by it. In this study, we found that the systemic application of IKSA caused bone loss in mice through increasing osteoclasts and decreasing osteoblasts. An immune response profile with up-regulated COX-2 is identified based on our transcriptional data from IKSA mice bone marrow cells. COX-2 expression is widely up-regulated in bone marrow immune cells, such as myeloid-derived suppressor cells (MDSCs), neutrophils and macrophages in the IKSA-treated mice. Mechanistically, COX-2 stimulated the increasing proportion of MDSCs and neutrophils and the inflammatory response of the bone marrow immune cells, that may regulate bone metabolism. Importantly, COX-2 inhibitor, celecoxib could rescue the bone loss induced by IKSA, which may reason from decrease of inflammatory gene expression in MDSCs, neutrophils and macrophages. Excitingly, COX-2 expression is also increased in bone marrow from mice and patients with S. aureus osteomyelitis. These findings suggested a therapeutic potential for inhibiting COX-2 in combating bone loss in S. aureus osteomyelitis.


Conflict of interest statement

Declarations. Ethics approval and consent to participate: The research was ethically sanctioned by the Ethics Committee at Nanfang Hospital. Each participant in this research provided informed consent before taking part. (Approval Number: NFEC-2020-074). All procedures involving animals received approval from the Institutional Animal Care and Use Committee of Nanfang Hospital and were conducted according to the guidelines of the National Regulations on the Management of Laboratory Animals. (Approval Number: NFYY-2022-01037). Consent for publication: Not applicable. Competing interests: The authors declare no competing interests.

Figures

Fig. 1
Fig. 1
IKSA induced bone loss by suppressing bone formation and activating bone resorption in mice. Micro-CT reconstruction images showcased both trabecular and cortical bone structures (a), quantitative evaluation was conducted on the trabecular bone fraction (BV/TV) (b), number of trabeculae (Tb. N) (c), thickness of trabeculae (Tb. Th) (d), separation between trabeculae (e), trabecular bone pattern factor (Tb. Pf) (f), cortical bone thickness (Ct. Th) (g) and cortical bone crosssectional area (Ct. Ar) (h) of the femurs from IKSA-treated and control mice. n = 6/group, * p < 0.05, ** p < 0.01, *** p < 0.001. i Typical H&E-stained femoral sections from IKSA-treated and control mice are shown. Scale bars, 200 μm. Typical images (j) and quantitative analysis (k) of OCN immunohistochemical staining on the trabecular bone and cortical bone of femurs from IKSA-treated and control mice. n = 3/group, ** p < 0.01. Scale bars, 50 μm. Red arrows indicate OCN+ cells. Representative TRAP staining images (l) and quantification (m) of the trabecular bone and cortical bone in femurs of IKSA-treated and control mice. Scale bars, 100 μm. n = 3/group, * p < 0.05
Fig. 2
Fig. 2
Transcriptome analysis of bone loss induced by IKSA. a Gene Ontology (GO) analysis of DEGs in bone marrow cells from mice that were administered IKSA intraperitoneally for 6 weeks. n = 4/group. GO enrichment analysis was performed with the help of the clusterProfiler package in R, with p value adjustments applied via the Benjamini‒Hochberg method. GO categories with an adjusted p value less than 0.05 were considered significantly enriched. b Venn diagram illustrating DEGs involved in the response to bacterium and the inflammatory response among macrophages, neutrophils and MDSCs. c A subset of inflammatory molecules notably increased in the femurs of mice treated with IKSA. d Quantitative analysis of the mRNA expression of Il10, Ccl12, Ptgs2, Ccl2 and Il1b in mice treated with IKSA. n = 4/group. e Volcano plot of genes upregulated in the femurs of mice treated with IKSA. f GSEA of the “osteoclast differentiation” gene module among the DEGs
Fig. 3
Fig. 3
The expression of COX-2 was upregulated, and the proportions of immune cells in the bone marrow of IKSA-treated mice were increased. Typical images (a) and quantitative analysis (b) of COX-2 immunohistochemical staining in the femurs of control and IKSA-treated mice. Scale bars, 50 μm. n = 3/group, *** p < 0.001. Typical images (c) of flow cytometry and quantitative analysis (d) of COX-2+ cell proportions in the bone marrow of IKSA-treated and control mice. n = 4/group, ** p < 0.01. Typical images (e) of flow cytometry and quantitative analysis (f) of the proportions of MDSCs (CD11b+Gr-1+), neutrophils (CD11b+Ly6G+) and macrophages (CD11b+F4/80.+) in the bone marrow of control and IKSA-treated mice. n = 4/group, * p < 0.05, *** p < 0.001
Fig. 4
Fig. 4
COX-2 expression in immune cells was upregulated by IKSA in vivo and in vitro. Typical flow cytometry images (a) and quantitative analysis of the proportions of COX-2.+ cells among MDSCs (b), neutrophils (c) and macrophages (d) from the bone marrow of IKSA-treated and control mice. n = 4/group, ** p < 0.01. Typical images of western blots (e) and quantitative analysis of the protein levels of COX-2 in MDSCs (f), neutrophils (g) and BMDMs (h) infected with IKSA (MOI = 10) for various durations (3, 6, 12 and 24 h). n = 3/group, ** p < 0.01, *** p < 0.001
Fig. 5
Fig. 5
The bone loss induced by IKSA can be relieved by the COX-2 selective inhibitor celecoxib in mice. Micro-CT reconstruction images showcasing both trabecular and cortical bone structures (a), quantitative analysis of BV/TV (b), Tb. N (c), Tb. Th (d), Tb. Sp (e), Tb. Pf (f), Ct. Th (g) and Ct. Ar (h) of femurs from vehicle control mice and IKSA-treated mice with intragastric administration of vehicle or celecoxib. n = 5/group, * p < 0.05, ** p < 0.01. i Typical H&E-stained femoral sections from vehicle control mice and IKSA-treated mice with intragastric administration of vehicle or celecoxib. Scale bars, 200 μm. Typical images (j) and quantitative analysis (k) of OCN immunohistochemical staining on the trabecular bone and cortical bone of femurs from vehicle control mice and IKSA-treated mice with intragastric administration of vehicle or celecoxib. n = 3/group, * p < 0.05. Red arrows indicate OCN+ cells. Scale bars, 50 μm. Typical TRAP staining images (l) and quantitative analysis (m) of the trabecular bone and cortical bone in femurs of vehicle control mice and IKSA-treated mice with intragastric administration of vehicle or celecoxib. Scale bars, 100 μm. n = 3/group, ** p < 0.01
Fig. 6
Fig. 6
Celecoxib reduced the proportion of MDSCs and neutrophils and impaired osteoclast function through decreasing the expression of some genes associated with inflammation. a Quantitative analysis of the proportions of MDSCs, neutrophils and macrophages in the bone marrow of IKSA-treated mice treated intragastrically with vehicle or celecoxib. n = 4/group, * p < 0.05, ** p < 0.01. b Heatmap of 43 DEGs associated with COX-2 in the STRING database. c Quantitative analysis of Tnfsf11 and Il1b mRNA expression in MDSCs treated with IKSA (MOI = 10) or IKSA + celecoxib for 12 h. n = 3/group, * p < 0.05, *** p < 0.001. d Quantitative analysis of Il1b mRNA expression in neutrophils treated with IKSA (MOI = 10) or IKSA + celecoxib for 12 h. n = 3/group, *** p < 0.001. e Quantitative analysis of the mRNA expression of Ccr1 and Ccr5 in macrophages treated with IKSA (MOI = 10) or IKSA + celecoxib for 12 h. n = 3/group, ** p < 0.01, *** p < 0.001
Fig. 7
Fig. 7
COX-2 expression was found to be upregulated in the bone marrow of osteomyelitis-affected patients and mice, as well as in immune cells infected with S. aureus in vitro. Typical images (a) of western blots and quantitative analysis (b) of COX-2 in the bone marrow of patients with osteomyelitis compared with controls. n = 4/group, ** p < 0.01. Typical images (c) and quantitative analysis (d) of COX-2 immunohistochemical staining in the bone marrow of patients with osteomyelitis compared with controls. Scale bars, 50 μm. n = 3/group, *** p < 0.001. Typical images (e) and quantitative analysis (f) of COX-2 immunohistochemical staining in the bone marrow of osteomyelitis mice compared with that of control mice. Scale bars, 50 μm. n = 3/group, * p < 0.05. Typical images (g) and quantitative analysis (j) of western blots for COX-2 protein levels in MDSCs (h), neutrophils (i) and BMDMs (j) infected with S. aureus (MOI = 10) for various durations (3, 6, 12 and 24 h). n = 3/group, ** p < 0.01, *** p < 0.001
Fig. 8
Fig. 8
Schematic representation of bone loss induced by IKSA. IKSA treatment led to the amplification of immune cells, including MDSCs, neutrophils, and macrophages, in the bone marrow, concurrently increasing COX-2 expression in these immune populations. The increased COX-2 levels may, in turn, drive the upregulation of Tnfsf11 in MDSCs, Il1b in neutrophils, and Ccr1/Ccr5 in macrophages. This signaling cascade is likely to contribute to a reduction in bone mass by promoting osteoclast activity while inhibiting osteogenesis

Similar articles

Cited by

References

    1. Al-Waeli H, Reboucas AP, Mansour A, Morris M, Tamimi F, Nicolau B. Non-steroidal anti-inflammatory drugs and bone healing in animal models-a systematic review and meta-analysis. Syst Rev. 2021;10(1):201. 10.1186/s13643-021-01690-w. - PMC - PubMed
    1. Arfeen M, Srivastava A, Srivastava N, Khan RA, Almahmoud SA, Mohammed HA. Design, classification, and adverse effects of NSAIDs: a review on recent advancements. Bioorg Med Chem. 2024;112: 117899. 10.1016/j.bmc.2024.117899. - PubMed
    1. Berendt T, Byren I. Bone and joint infection. Clin Med (Lond). 2004;4(6):510–8. 10.7861/clinmedicine.4-6-510. - PMC - PubMed
    1. Byrd AL, Deming C, Cassidy SKB, Harrison OJ, Ng WI, Conlan S, et al. Staphylococcus aureus and Staphylococcus epidermidis strain diversity underlying pediatric atopic dermatitis. Sci Transl Med. 2017;9(397):eaal4651. 10.1126/scitranslmed.aal4651. - PMC - PubMed
    1. Cai B, Lin D, Li Y, Wang L, Xie J, Dai T, et al. N2-polarized neutrophils guide bone mesenchymal stem cell recruitment and initiate bone regeneration: a missing piece of the bone regeneration puzzle. Adv Sci. 2021;8(19): e2100584. 10.1002/advs.202100584. - PMC - PubMed

MeSH terms