

Changes of intestinal microbiome and its relationship with painful diabetic neuropathy in rats
- PMID: 40335921
- PMCID: PMC12060437
- DOI: 10.1186/s12866-025-04015-2
Changes of intestinal microbiome and its relationship with painful diabetic neuropathy in rats
Abstract
Objective: To analyze the gut bacterial microbiome in rats with painful diabetic neuropathy (PDN) compared to normal rats.
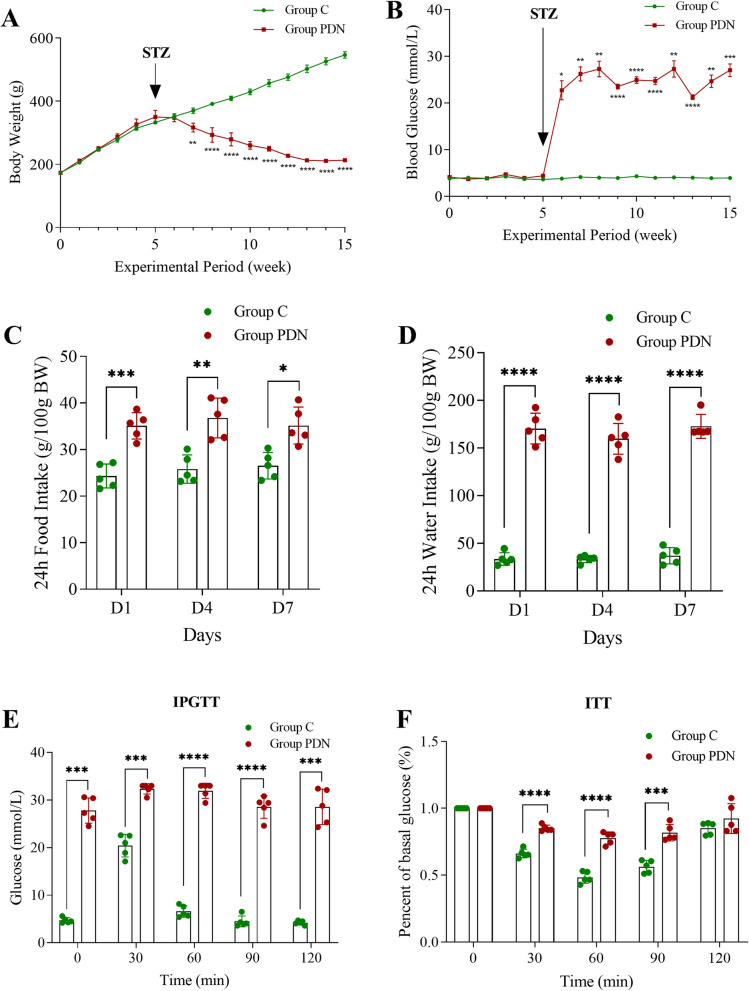
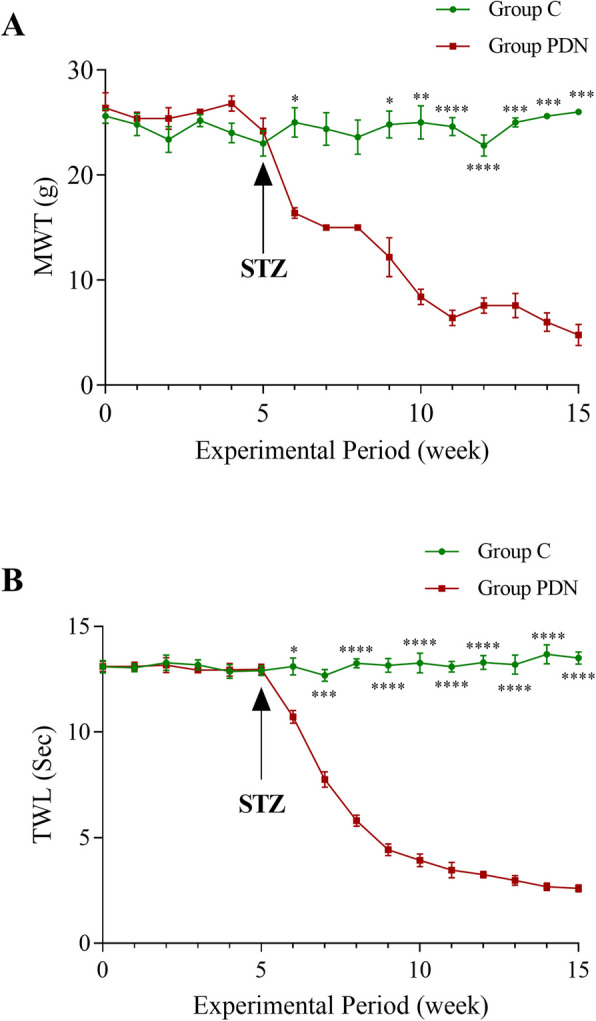
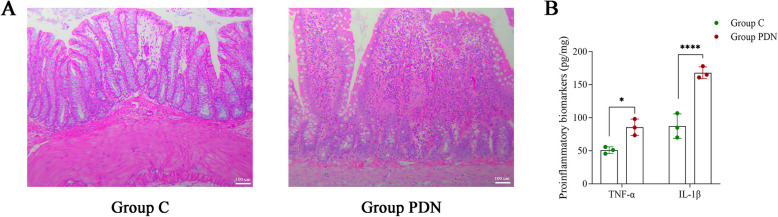
Methods: Type 2 diabetes was induced in rats via a high-fat and high-sugar diet combined with a low dose of streptozotocin. Glucose metabolism and insulin sensitivity were evaluated using intraperitoneal glucose tolerance tests and insulin tolerance tests. The progression of peripheral neuropathy was assessed using the mechanical withdrawal threshold and thermal withdrawal latency. Histopathological analysis of rat colon tissues was performed using hematoxylin-eosin staining to observe morphological changes. The expression levels of pro-inflammatory cytokines TNF-α and IL-1β in spinal cord tissues were measured using enzyme-linked immunosorbent assay (ELISA). Fecal samples were then collected for metagenomic sequencing and analysis.
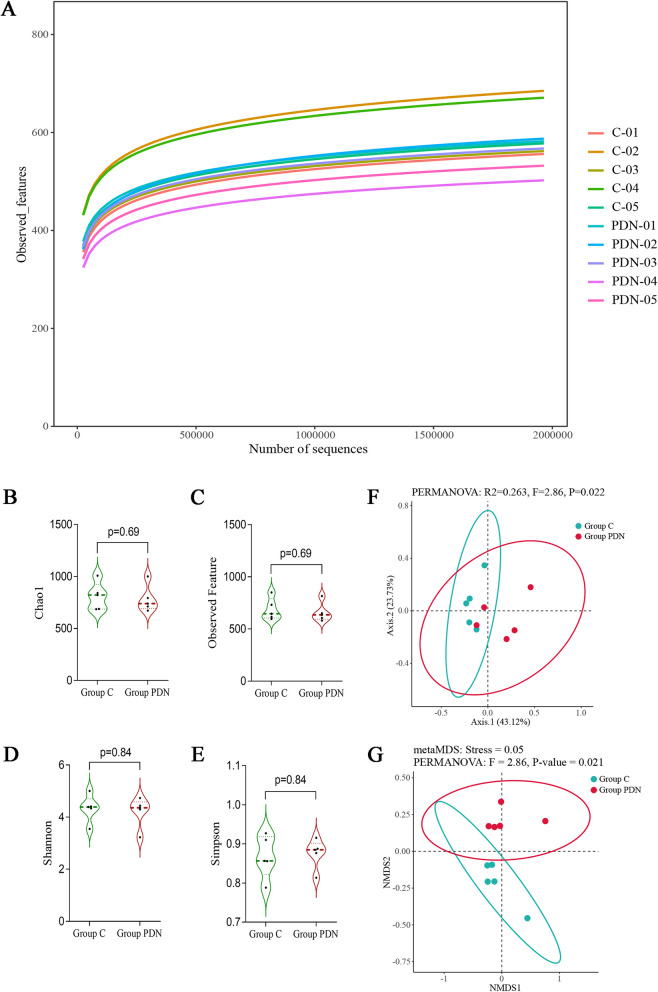
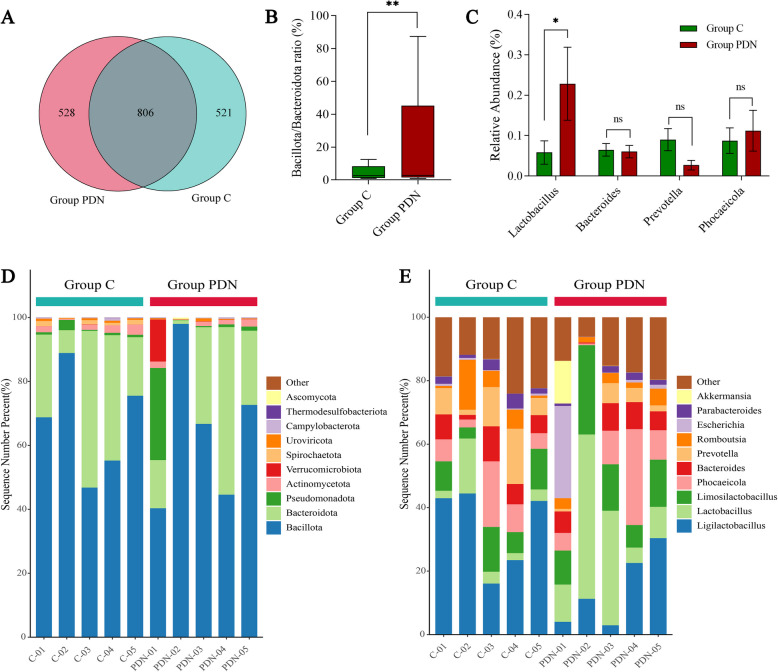
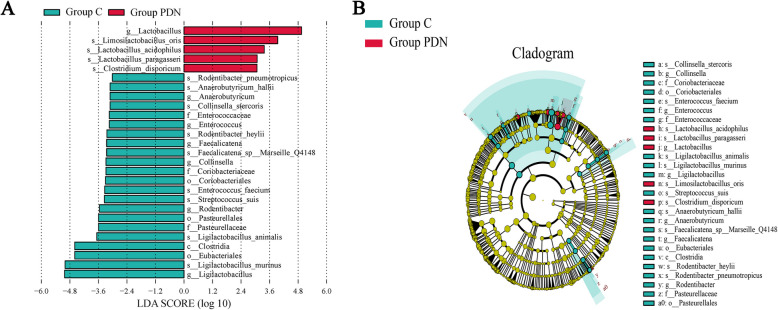
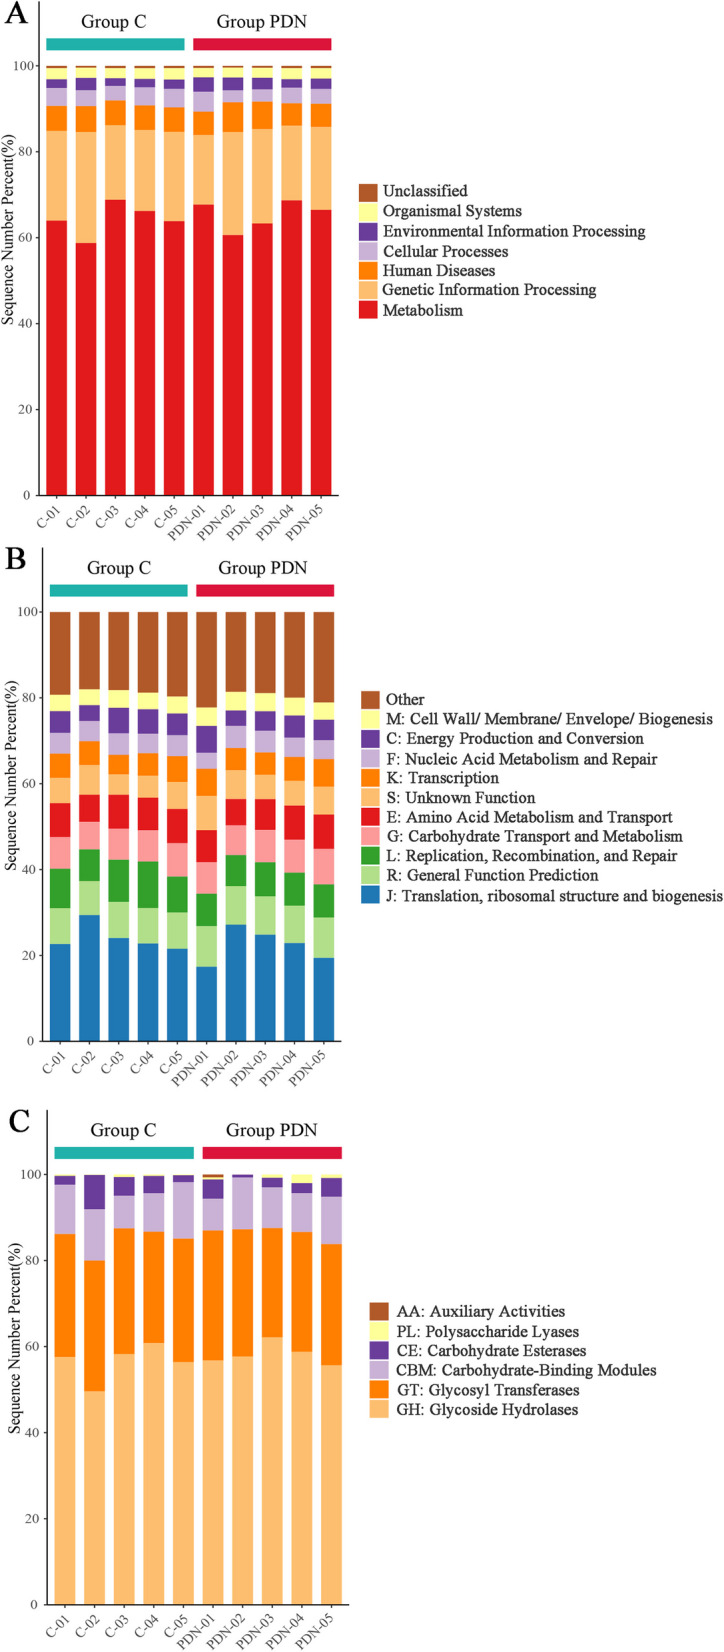
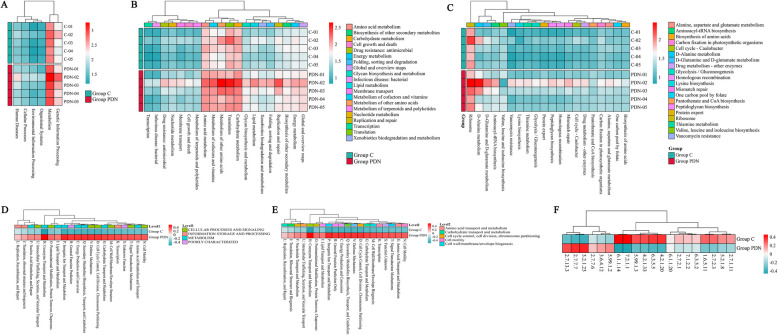
Result: Behavioral tests revealed reduced mechanical withdrawal threshold and thermal withdrawal latency in PDN rats. Histological analysis showed significant colonic mucosal damage and inflammatory cell infiltration, suggesting impaired intestinal barrier function. Elevated TNF-α and IL-1β levels in spinal cord tissues further highlight peripheral inflammation's role in PDN. Sequencing analysis revealed significant differences in gut microbiota composition between PDN and control rats, with altered Bacillota/Bacteroidota ratios and increased Lactobacillus abundance. Functional annotation analysis, based on the KEGG, EggNOG, and CAZy databases, indicated significant enrichment of metabolic pathways related to carbohydrate and amino acid metabolism, energy metabolism, and cell structure biogenesis in PDN rats. Cluster analysis identified higher functional clustering in Metabolism and Genetic Information Processing pathways in PDN rats.
Conclusion: This study demonstrates that PDN leads to altered gut microbiota composition, disrupted metabolic pathways, and increased inflammation, contributing to the pathological progression of diabetic neuropathy. This study provides new insights into the interplay between gut microbiota and diabetic neuropathy, offering potential avenues for therapeutic interventions targeting microbiome and metabolism.
Keywords: Collinsella; Fecal metagenomic sequencing; Gut microbiota; Lactobacillus; Neuropathic pain; Painful diabetic neuropathy.
© 2025. The Author(s).
Conflict of interest statement
Declarations. Ethics approval and consent to participate: This experiment involved SD rats provided by the Experimental Animal Center of North Sichuan Medical College. All experimental procedures were approved by the Institutional Ethics Committee of North Sichuan Medical College (authorization number: 2024[071]). All procedures adhered strictly to the ARRIVE guidelines for the Care and Use of Experimental Animals. Consent for publication: Not applicable. Competing interests: The authors declare no competing interests.
Figures
Similar articles
-
Ginger alleviates mechanical hypersensitivity and anxio-depressive behavior in rats with diabetic neuropathy through beneficial actions on gut microbiome composition, mitochondria, and neuroimmune cells of colon and spinal cord.Nutr Res. 2024 Apr;124:73-84. doi: 10.1016/j.nutres.2024.01.014. Epub 2024 Feb 1. Nutr Res. 2024. PMID: 38402829 Free PMC article.
-
Probiotics alleviate painful diabetic neuropathy by modulating the microbiota-gut-nerve axis in rats.J Neuroinflammation. 2025 Feb 2;22(1):30. doi: 10.1186/s12974-025-03352-3. J Neuroinflammation. 2025. PMID: 39894793 Free PMC article.
-
Loganin Ameliorates Painful Diabetic Neuropathy by Modulating Oxidative Stress, Inflammation and Insulin Sensitivity in Streptozotocin-Nicotinamide-Induced Diabetic Rats.Cells. 2021 Oct 8;10(10):2688. doi: 10.3390/cells10102688. Cells. 2021. PMID: 34685668 Free PMC article.
-
Rodent Models of Diabetic Neuropathy, Role of Calcium Homeostasis in Pain and KB-R7943 as a Potential Therapeutic.Int J Mol Sci. 2025 Feb 27;26(5):2094. doi: 10.3390/ijms26052094. Int J Mol Sci. 2025. PMID: 40076715 Free PMC article. Review.
-
Diabetic neuropathy: understanding the nexus of diabetic neuropathy, gut dysbiosis and cognitive impairment.J Diabetes Metab Disord. 2024 Jun 6;23(2):1589-1600. doi: 10.1007/s40200-024-01447-x. eCollection 2024 Dec. J Diabetes Metab Disord. 2024. PMID: 39610501 Free PMC article. Review.
References
-
- Zimmet P, Alberti KG, Magliano DJ, Bennett PH. Diabetes mellitus statistics on prevalence and mortality: facts and fallacies. Nat Rev Endocrinol. 2016;12(10):616–22. - PubMed
-
- Gylfadottir SS, Christensen DH, Nicolaisen SK, Andersen H, Callaghan BC, Itani M, Khan KS, Kristensen AG, Nielsen JS, Sindrup SH, et al. Diabetic polyneuropathy and pain, prevalence, and patient characteristics: a cross-sectional questionnaire study of 5,514 patients with recently diagnosed type 2 diabetes. Pain. 2020;161(3):574–83. - PMC - PubMed
MeSH terms
Substances
Grants and funding
- 22SXQT0125/Bureau of Science and Technology Nanchong Municipality
- 22SXQT0125/Bureau of Science and Technology Nanchong Municipality
- 22SXQT0125/Bureau of Science and Technology Nanchong Municipality
- 22SXQT0125/Bureau of Science and Technology Nanchong Municipality
- 22SXQT0125/Bureau of Science and Technology Nanchong Municipality
- 22SXQT0125/Bureau of Science and Technology Nanchong Municipality
- CBY22-ZDA09/School-level Key Scientific Research Project of North Sichuan Medical College
- CBY22-ZDA09/School-level Key Scientific Research Project of North Sichuan Medical College
- CBY22-ZDA09/School-level Key Scientific Research Project of North Sichuan Medical College
- CBY22-ZDA09/School-level Key Scientific Research Project of North Sichuan Medical College
- CBY22-ZDA09/School-level Key Scientific Research Project of North Sichuan Medical College
- CBY22-ZDA09/School-level Key Scientific Research Project of North Sichuan Medical College
LinkOut - more resources
Full Text Sources
Medical
