. 2025 May 8;25(1):276.
doi: 10.1186/s12866-025-03960-2.

Soil microorganism colonization influenced the growth and secondary metabolite accumulation of Bletilla striata (Thunb.) Rchb. F

Affiliations

Soil microorganism colonization influenced the growth and secondary metabolite accumulation of Bletilla striata (Thunb.) Rchb. F

Qingqing Xu et al. BMC Microbiol. .

Abstract

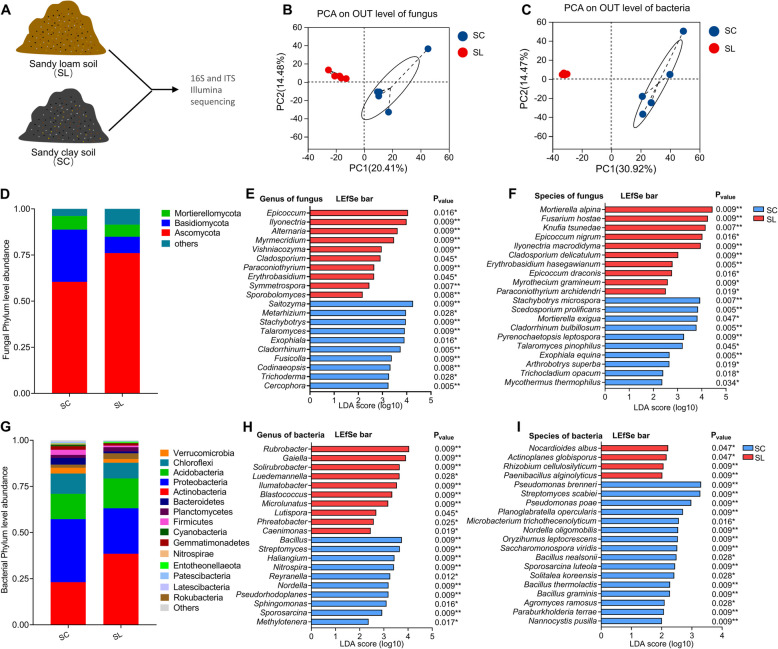
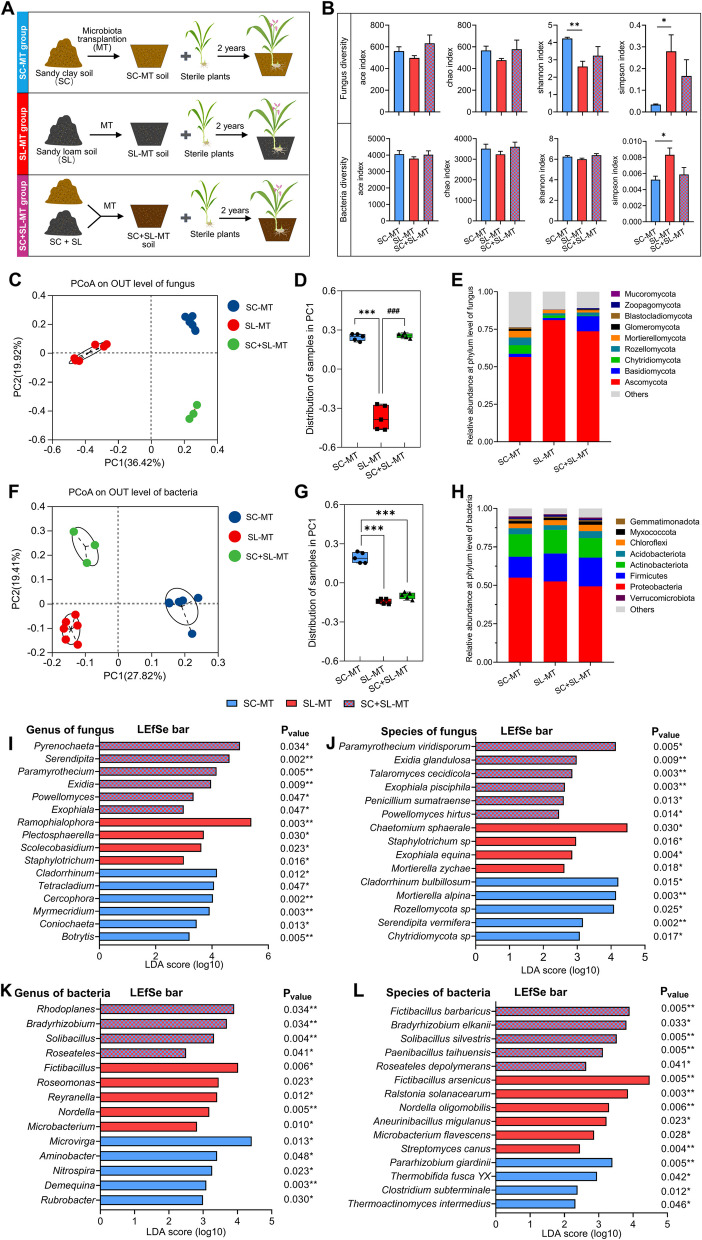
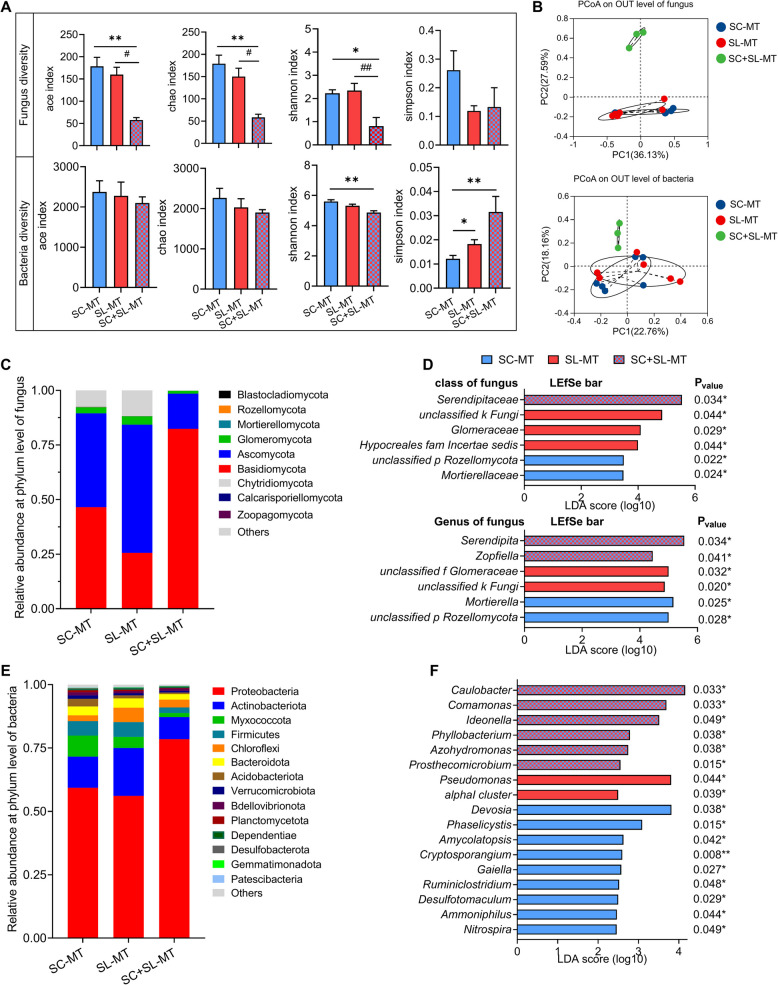
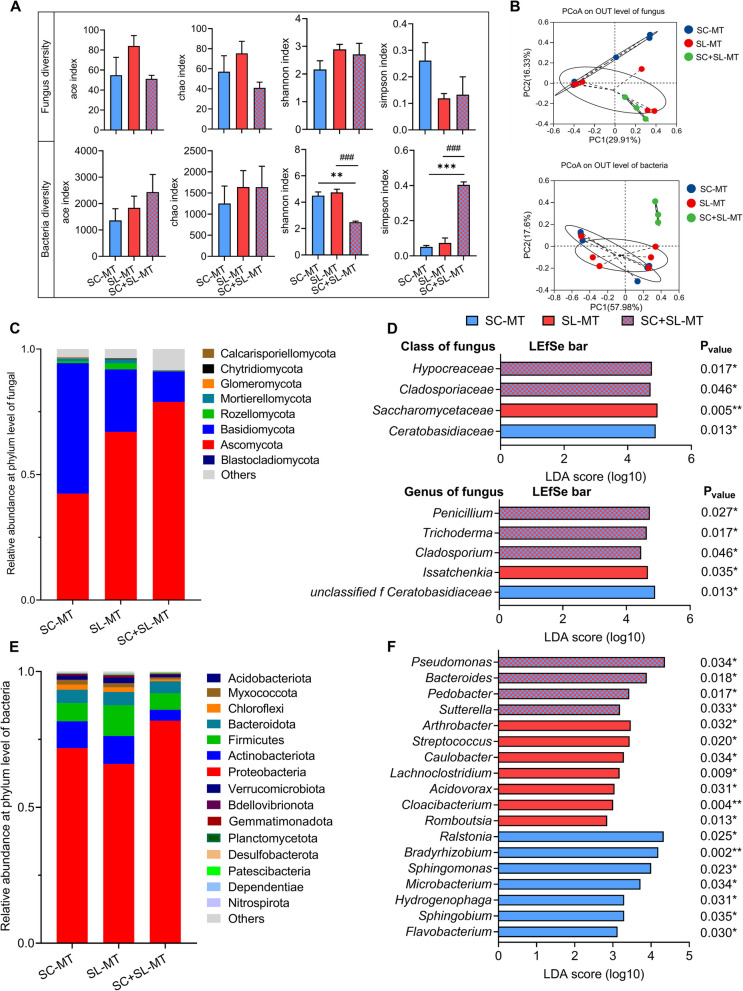
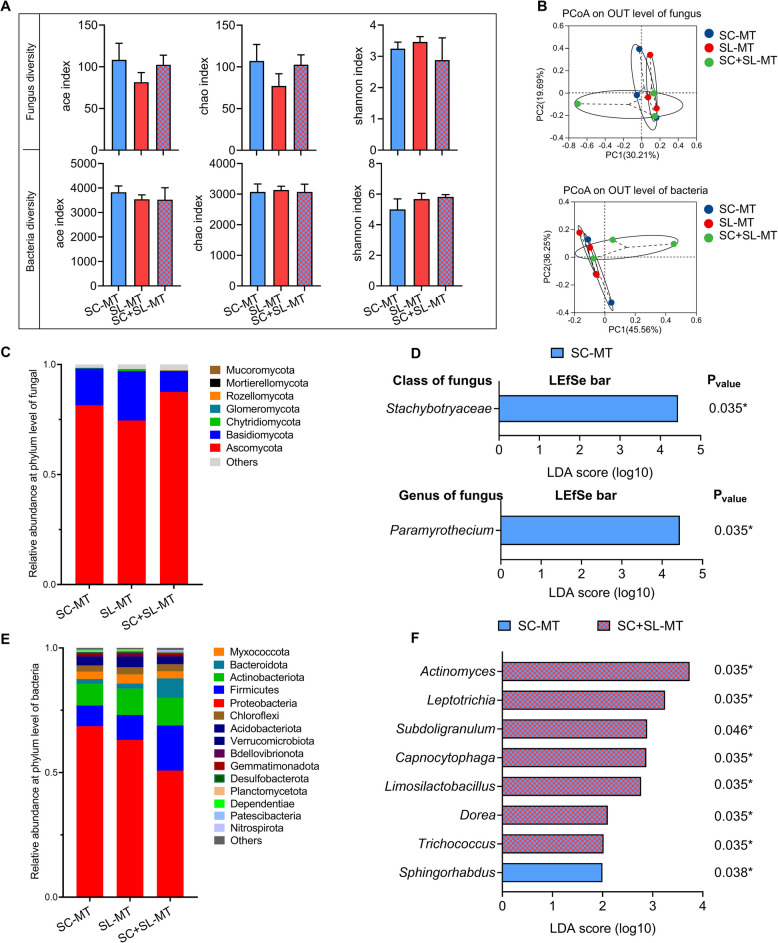
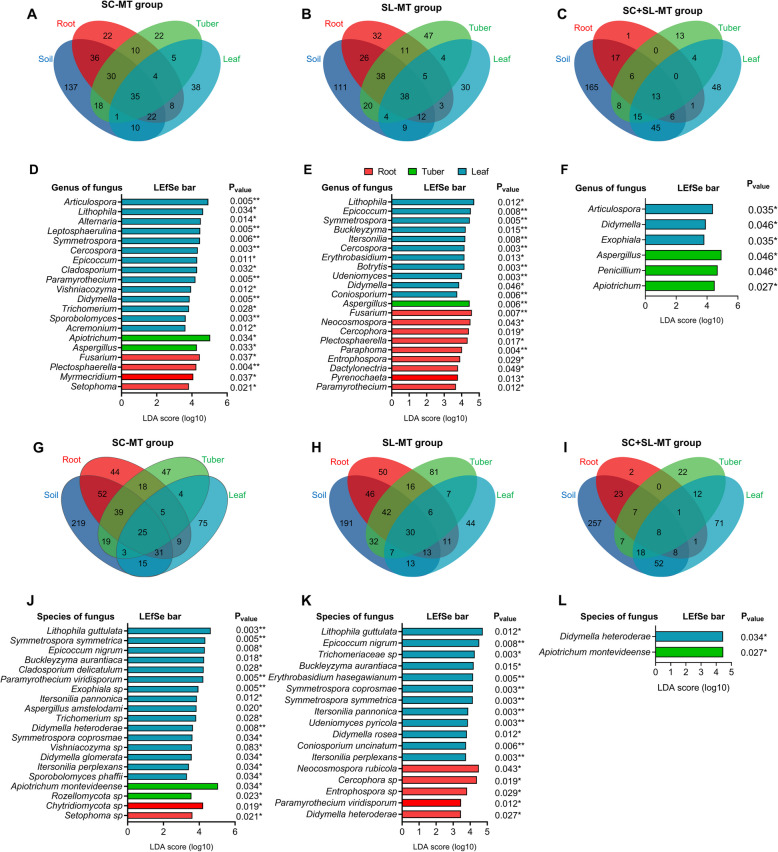
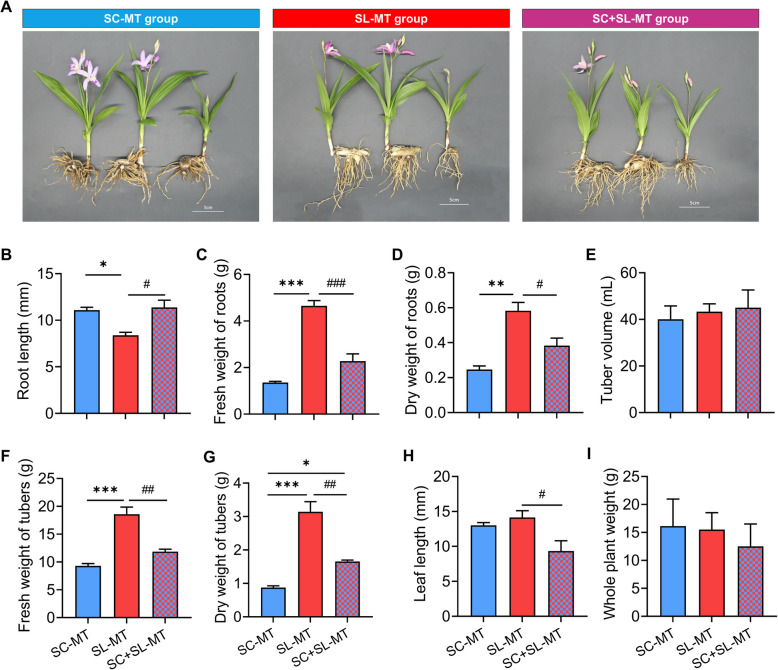
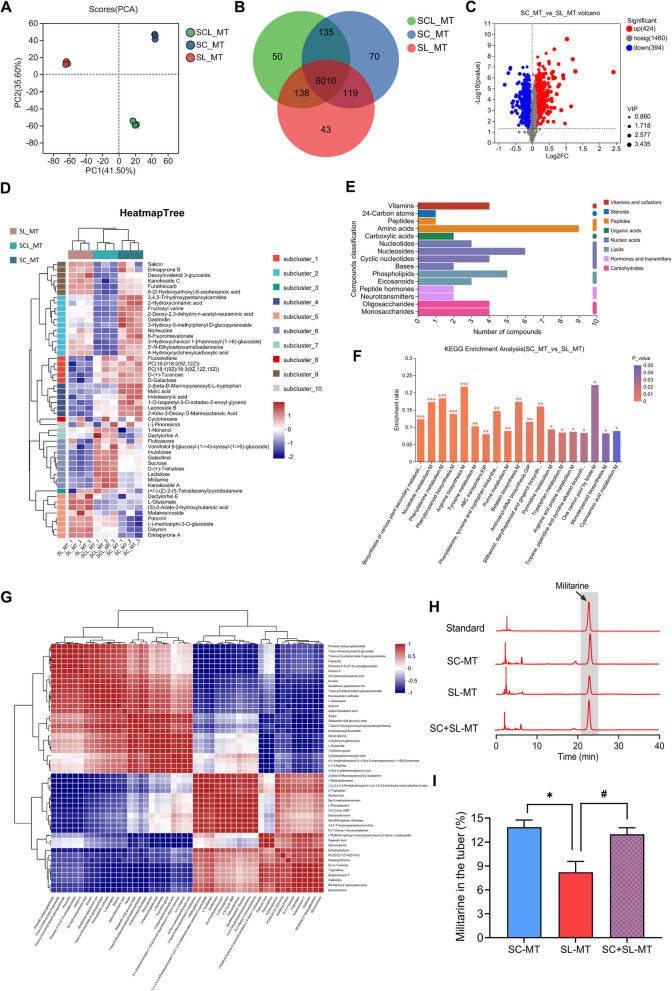
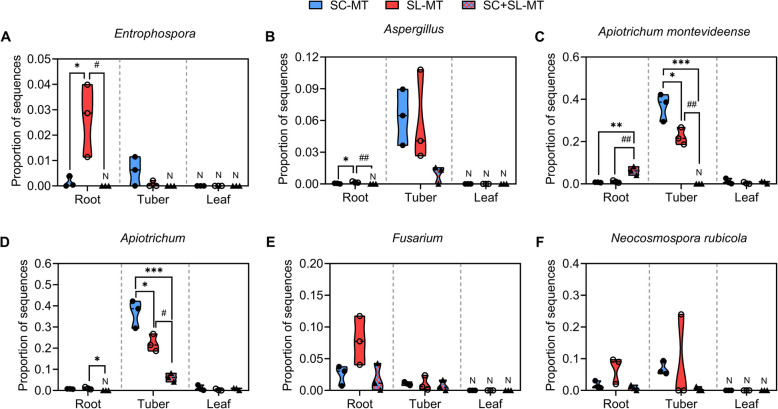
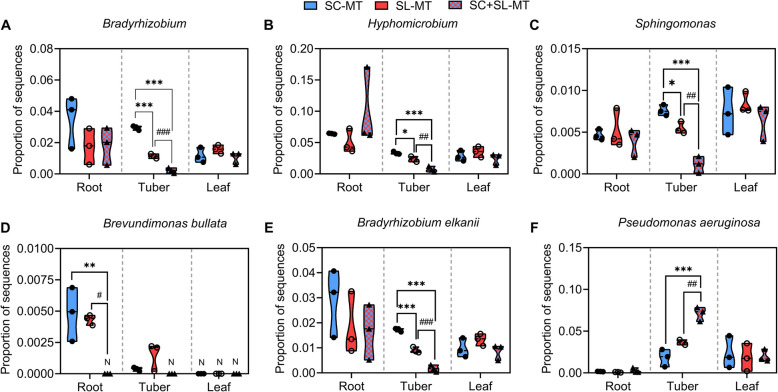
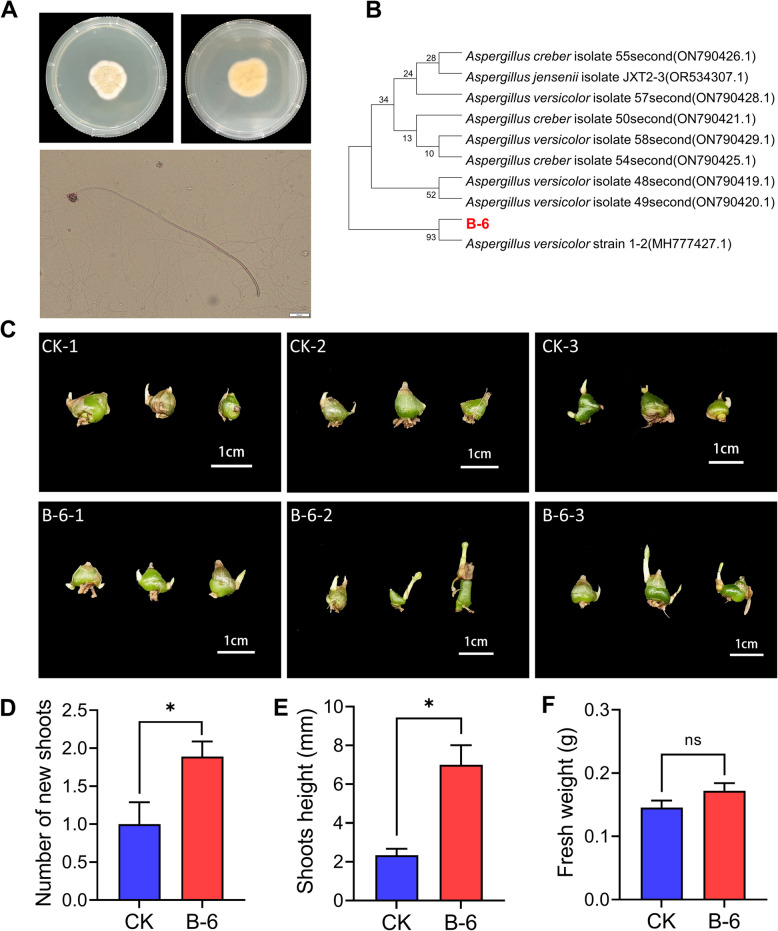
Bletilla striata (Thunb.) Rchb. F., a perennial herbaceous plant renowned for its medicinal properties, exhibits growth and secondary metabolite production that are significantly influenced by soil microorganisms. Exploring how soil microorganisms influence the growth and secondary metabolites of B. striata, we cultivated sterile seedlings in radiation-sterilized soil inoculated with microbiota from either sandy clay or sandy loam soils. Following a two-year growth period, we employed 16S and ITS Illumina sequencing to analyze the bacterial and fungal communities colonizing the rhizosphere soil, roots, tubers, and leaves of B. striata. Concurrently, we assessed the growth indices of the plants and utilized UHPLC-MS/MS to quantify the metabolites in the tubers, with a particular focus on the index component militarine and single bacteria were isolated for verification. Our findings revealed significant variations in the metabolite profiles and growth of B. striata across different soil microbial treatments. Specifically, sandy loam microorganisms were found to enhance plant growth, whereas sandy clay microorganisms increased the concentration of secondary metabolites. We identified specific microbes predominantly in loam soil that colonized roots and promoted growth (e.g., Entrophospora, Aspergillus, Fusarium). Similarly, certain microbes in loam soil colonized tubers and enhanced their growth (e.g., Sphingomonas, Hyphomicrobium). Additionally, microbes predominantly found in sandy soil colonized tubers and stimulated the synthesis of secondary metabolites (e.g., Myrmecridium, Apiotrichum montevideense). Notably, Aspergillus versicolor (B-6), isolated from the rhizosphere soil of B. striata after the introduction of sandy loam microorganisms, demonstrated a growth-promoting effect on sterile seedlings upon inoculation. This study elucidates the role of soil microorganisms in colonizing various regions of B. striata, thereby modulating its growth and secondary metabolite production. These insights have significant implications for optimizing the yield and quality of B. striata in both medicinal and agricultural applications.

Keywords: Bletilla striata; Growth and development; Microbial colonization; Secondary metabolites; Soil microbiota.


Conflict of interest statement

Declarations. Ethics approval and consent to participate: This study did not involve animal or human trials. Consent for publication: Not applicable. Competing interests: The authors declare no competing interests.

Figures

Fig. 1
Fig. 1
Different microbial communities in sandy clay soil or sandy loam soil. A Analysis of 16S RNA and ITS sequences to characterize microbial communities. B-C Analysis of principal components (PCs) of Bray–Curtis distances in (B) fungal and (C) bacterial communities based on operational taxonomic units (OTUs) as an index of beta diversity. D Relative abundances of fungal phyla. E–F Fungal taxa differing significantly between the soil types based on linear discriminant analysis (LDA) score log10 > 2.0 and P < 0.05. LEfSe, linear discriminant analysis effect size. G Relative abundances of bacterial phyla. H-I Bacterial taxa differing significantly between the soil types based on the same criteria as in panels E–F
Fig. 2
Fig. 2
Microbial communities in soil after transplantation of microbiota from different types of soil. Schematic of microbiota transplantation experiments. B Alpha diversity in fungal and bacterial communities based on operational taxonomic units (OTUs). Data are mean ± SEM. *p < 0.05, **p < 0.01 vs. SC-MT group, based on two-way ANOVA with Tukey's multiple-comparisons test. C-D Analysis of principal components (PCs) of Bray–Curtis distances in fungal communities based on operational taxonomic units (OTUs) as an index of beta diversity. The box-and-whiskers histogram on the right represents the distribution of the sample on PC 1. ***p < 0.001 vs. SC-MT and ###p < 0.001 vs. SL-MT, based on one-way ANOVA with Tukey's multiple-comparisons test. E Relative abundances of fungal phyla. F-G Analysis of principal components (PCs) of Bray–Curtis distances in bacterial communities based on operational taxonomic units (OTUs) as an index of beta diversity. The box-and-whiskers histogram on the right represents the distribution of the sample on PC 1. **p < 0.01 vs. SC-MT and ###p < 0.001 vs. SL-MT, based on one-way ANOVA with Tukey's multiple-comparisons test. H Relative abundances of bacterial phyla. I-J Fungal taxa differing significantly between the soil types based on linear discriminant analysis (LDA) score log10 > 2.0 and p < 0.05. LEfSe, linear discriminant analysis effect size. K-L Bacterial taxa differing significantly between the soil types based on the same criteria as in panels I-J
Fig. 3
Fig. 3
Differential colonization of B. striata roots by microbiota transplanted from sandy clay soil (SC) or sandy loam soil (SL). A Alpha diversity in fungal and bacterial communities based on operational taxonomic units (OTUs). Data are mean ± SEM. *p < 0.05, **p < 0.01 vs. SC-MT group, based on two-way ANOVA with Tukey's multiple-comparisons test. B Analysis of principal components (PCs) of Bray–Curtis distances in fungal communities based on OTUs as an index of beta diversity. The box-and-whiskers histogram on the right represents the distribution of the sample on PC 1. ***p < 0.001 vs. SC-MT and ###p < 0.001 vs. SL-MT, based on one-way ANOVA with Tukey's multiple-comparisons test. C Relative abundances of fungal phyla. D Fungal taxa differing significantly between the soil types based on linear discriminant analysis (LDA) score log10 > 2.0 and p < 0.05. LEfSe, linear discriminant analysis effect size. E Relative abundances of bacterial phyla. F Bacterial taxa differing significantly between the soil types based on the same criteria as in panel D
Fig. 4
Fig. 4
Differential colonization of B. striata tuber by microbiota transplanted from sandy clay soil (SC) or sandy loam soil (SL). Alpha diversity in fungal and bacterial communities based on operational taxonomic units (OTUs). Data are mean ± SEM. *p < 0.05, **p < 0.01 vs. SC-MT group, based on two-way ANOVA with Tukey's multiple-comparisons test. B Analysis of principal components (PCs) of Bray–Curtis distances in fungal communities based on OTUs as an index of beta diversity. The box-and-whiskers histogram on the right represents the distribution of the sample on PC 1. ***p < 0.001 vs. SC-MT and ###p < 0.001 vs. SL-MT, based on one-way ANOVA with Tukey's multiple-comparisons test. C Relative abundances of fungal phyla. D Fungal taxa differing significantly between the soil types based on linear discriminant analysis (LDA) score log10 > 2.0 and p < 0.05. LEfSe, linear discriminant analysis effect size. E Relative abundances of bacterial phyla. F Bacterial taxa differing significantly between the soil types based on the same criteria as in panel D
Fig. 5
Fig. 5
Differential colonization of B. striata leaves by microbiota transplanted from sandy clay soil (SC). A Alpha diversity in fungal and bacterial communities based on operational taxonomic units (OTUs). Data are mean ± SEM. *p < 0.05, **p < 0.01 vs. SC-MT group, based on two-way ANOVA with Tukey's multiple-comparisons test. B Analysis of principal components (PCs) of Bray–Curtis distances in fungal communities based on OTUs as an index of beta diversity. The box-and-whiskers histogram on the right represents the distribution of the sample on PC 1. ***p < 0.001 vs. SC-MT and ###p < 0.001 vs. SL-MT, based on one-way ANOVA with Tukey's multiple-comparisons test. C Relative abundances of fungal phyla. D Fungal taxa differing significantly between the soil types based on linear discriminant analysis (LDA) score log10 > 2.0 and p < 0.05. LEfSe, linear discriminant analysis effect size. E Relative abundances of bacterial phyla. F Bacterial taxa differing significantly between the soil types based on the same criteria as in panel D
Fig. 6
Fig. 6
Differential colonization of B. striata tissues by different fungal taxa from different soil types. A-C Venn charts of fungal genera in soil, roots, tubers, and leaves. D-F Fungal genera whose abundance differed significantly among the three plant tissues within each microbiota transplant condition: (D) SC-MT, (E) SL-MT, (F) SC + SL-MT. The cutoff for significant differences is defined in the legend to Fig. 1E-F. G-I Venn charts of fungal species in soil and roots, tubers, and leaves. J-L Histograms of fungal species whose abundance differed significantly across B. striata roots, tubers and leaves after cultivation in (J) SC-MT, (K) SL-MT or (L) SC + SL-MT soil. The criteria for significant differences were a linear discriminant analysis (LDA) score log10 > 2.0 and p < 0.05
Fig. 7
Fig. 7
Influence of microbiota from sandy clay or loam soil on B. striata growth. A Representative photographs of B. striata. B-I Assessment of various indicators of plant growth. Data are mean ± SEM. * p < 0.05, ** p < 0.01, *** p < 0.001 vs. SC-MT. # p < 0.05, ## p < 0.01, ### p < 0.001 vs. SL-MT. All tests were one-way ANOVA with Tukey's multiple-comparisons test
Fig. 8
Fig. 8
Metabolic profiling of B. striata by microbial community transplantation: A comparative analysis. A Plots of principal component analysis (PCA) scores for plant samples, with PC1 representing the first principal component and PC2 representing the second principal component. B Venn chart of B. striata metabolites after microbial transplantation. C Volcano plot of SC-MT and SL-MT, in which blue dots indicate significant and down-regulated differential metabolites, red dots indicate significant but up-regulated differential metabolites, and gray dots indicate that they can be detected in the sample but the difference is not significant. D Heatmap of hierarchical clustering analysis. The abscissa is used to show the sample name, and the ordinate on the right is used to show the metabolite name. The darker the color, the higher the content of metabolites. The darker the blue, the lower the metabolite content. E KEGG metabolite classification. The ordinate is the KEGG compound secondary classification category, and the abscissa is the number of metabolites annotated to this classification. F KEGG enrichment map of differential metabolites. The abscissa represents the pathway name and the ordinate represents the enrichment rate. The column color gradient indicates the significance of enrichment. The darker the default color, the more significantly enriched the KEGG term, where Pvalue or FDR < 0.001 is marked as ***, Pvalue or FDR < 0.01 is marked as **, and P value or FDR < 0.05 is marked as *. G Color-coded correlation heatmaps of the metabolites of the B. striata using the strength of Spearman's correlation coefficient (r). Red indicates positive correlation and blue indicates negative correlation. H Representative chromatograms of militarine in tubers. I Quantitation of levels of militarine in tubers. Data are mean ± SEM. * p < 0.05 vs. SC-MT and # p < 0.05 vs. SL-MT, based on one-way ANOVA with Tukey's multiple-comparisons test
Fig. 9
Fig. 9
Relative abundances of fungi in different B. striata tissues
Fig. 10
Fig. 10
Relative abundances of bacterial in different B. striata tissues
Fig. 11
Fig. 11
Isolation of B- 6 and its effect on B. striata sterile seedlings growth and development. A Growth of B- 6 strains identified from sandy loam soil after 7 days of incubation in nutrient medium of PDA, and micrograph of mycelium of strain B- 6 (fold 20 × 10). The diameter of the Petri dish was 60 mm. B The phylogenetic tree of B- 6 was constructed. The fungal DNA sequence fragment of the same genus (bp 500–600) was downloaded from NCBI to construct the phylogenetic tree, and the similarity homology alignment was greater than 90%. C B. striata sterile seedlings were grown under MS medium conditions and inoculated with B- 6 (20 d). (D-F) Assessment of various indicators of plant growth. Data are mean ± SEM. * p < 0.05, ** p < 0.01, *** p < 0.001. All tests were one-way ANOVA with Tukey's multiple-comparisons test

Similar articles

References

    1. Marchesi JR, Ravel J. The vocabulary of microbiome research: a proposal. MicrobiomE. 2015;3:31. - PMC - PubMed
    1. Muller DB, Vogel C, Bai Y, Vorholt JA. The Plant Microbiota: Systems-Level Insights and Perspectives. Annu Rev Genet. 2016;50:211–34. - PubMed
    1. Trivedi P, Leach JE, Tringe SG, Sa T, Singh BK. Plant-microbiome interactions: from community assembly to plant health. Nat Rev Microbiol. 2020;18(11):607–21. - PubMed
    1. Shimizu K, Hossain MM, Kato K, Kubota M, Hyakumachi M. Induction of defense responses in cucumber plants by using the cell-free filtrate of the plant growth-promoting fungus Penicillium simplicissimum GP17-2. J Oleo Sci. 2013;62(8):613–21. - PubMed
    1. Lin Y, Zhang H, Li P, Jin J, Li Z. The bacterial consortia promote plant growth and secondary metabolite accumulation in Astragalus mongholicus under drought stress. BMC Plant Biol. 2022;22(1):475. - PMC - PubMed

MeSH terms

LinkOut - more resources