. 2025 May 7;13(1):93.
doi: 10.1186/s40478-025-02013-z.

Temporal transcriptomic changes in the THY-Tau22 mouse model of tauopathy display cell type- and sex-specific differences

Affiliations

Temporal transcriptomic changes in the THY-Tau22 mouse model of tauopathy display cell type- and sex-specific differences

Muhammad Ali et al. Acta Neuropathol Commun. .

Abstract

Background: Tauopathies, including Alzheimer's disease (AD) and frontotemporal dementia (FTD), display sex-specific differences in prevalence and progression, but the underlying molecular mechanisms remain unclear. Single-cell transcriptomic analysis of animal models can reveal how AD pathology affects different cell types across sex and age.

Objective: To understand sex-specific and sex-dimorphic transcriptomic changes in different cell types and their age-dependence in the THY-Tau22 mouse model of AD-linked tauopathy.

Methods: We applied single-cell RNA sequencing (scRNA-seq) to cortical tissue from male and female THY-Tau22 and wild-type mice at 17 months of age, when they had prominent tau inclusion pathology, and compared the results with corresponding data previously obtained at 7 months of age. Using differential statistical analysis for individual genes, pathways, and gene regulatory networks, we identified sex-specific, sex-dimorphic, and sex-neutral changes, and looked at how they evolved over age. To validate the most robust findings across distinct mouse models and species, the results were compared with cortical scRNA-seq data from the transgenic hAPP-based Tg2576 mouse model and human AD.

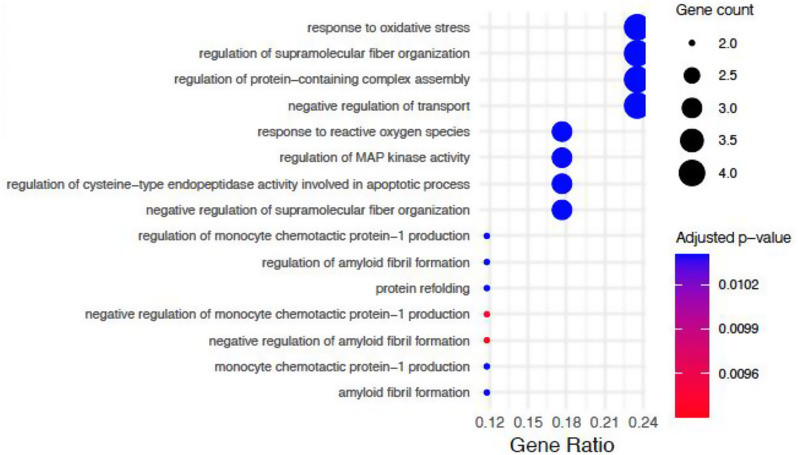
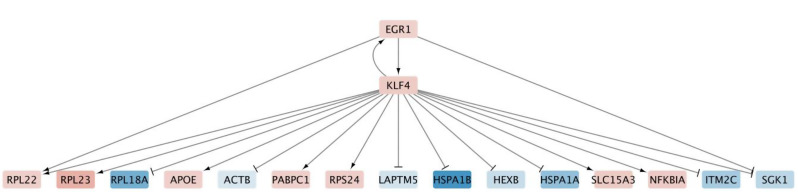
Results: We identified several significant sex-specific and sex-dimorphic differentially expressed genes in neurons, microglia, astrocytes and oligodendrocytes, including both cross-sectional changes and alterations from 7 months to 17 months of age. Key pathways affected in a sex-dependent manner across age included neurotransmitter signaling, RNA processing and splicing, stress response pathways, and protein degradation pathways. In addition, network analysis revealed the AD-associated genes Clu, Mbp, Fos and Junb as relevant regulatory hubs. Analysis of age-dependent changes highlighted genes and pathways associated with inflammatory response (Malat1, Cx3cr1), protein homeostasis (Cst3), and myelin maintenance (Plp1, Cldn11, Mal) that showed consistent sex-dependent changes as the THY-Tau22 mice aged. Multiple genes with established implications in AD, including the long non-coding RNA gene Malat1, displayed concordant sex-specific changes in mouse models and human AD.

Conclusions: This study provides a comprehensive single-cell transcriptomic characterization of sex-linked and age-dependent changes in the THY-Tau22 tauopathy model, revealing new insights into the interplay between age-dependent AD-like pathologies and sex. The identified sex-specific changes and their conservation across models and human AD highlight molecular targets for further preclinical investigation of sex-specific therapeutic strategies in AD.

Keywords: Age differences; Alzheimer's disease; Sex differences; Single-cell RNA sequencing; THY-Tau22 mouse model; Tauopathy; Transcriptomics.


Conflict of interest statement

Declarations. Ethics approval: The animal experiments adhered to the European FELASA guidelines for animal research and were granted ethical approval by the local Institutional Animal Experimentation Ethics Committee. Furthermore, these experiments were endorsed by the relevant Luxembourg government bodies, including the Ministries of Agriculture and Health. This research did not involve any human subjects. Consent to participate: Does not apply to this study. Competing interests: The authors declare no competing interests.

Figures

Fig. 1
Fig. 1
Overview of study design and analytical workflow for single cell analyses. Schematic showing the comparison of newly generated data from 17-month-old THY-Tau22 mice (n = 4 male THY-Tau22, n = 4 male wildtype, n = 5 female THY-Tau22, n = 3 female wildtype) with previously published data from 7-month-old mice (n = 5 per group) and data from the Tg2576 mouse model (n = 9 per group) and human AD cortical tissue (n = 3 per group). Green dashed line indicates age-dependent analyses; blue dashed line indicates cross-model comparisons with Tg2576 mice and human AD data. The workflow includes tissue processing, sequencing, data analysis, and comparative analyses
Fig. 2
Fig. 2
Sex-specific differences in exploratory activity and working memory in THY-Tau22 mice (Y-maze). (A) Number of arm entries in 17-month-old mice (n = 17 male THY-Tau22, n = 11 male WT, n = 11 female THY-Tau22, n = 13 female WT). (B) Percentage of alternations (*: p < 0.05, ***: p < 0.001)
Fig. 3
Fig. 3
Tau pathology markers and correlation with cognitive function in THY-Tau22 mice at 17 months (n = 7 mice per sex). (A) Cortical region showing Thioflavin-S (green) and AT8 (red) staining (left), quantification (middle column), and correlation with alternation behavior (right). Scale bar: 50 µM. (B) Corresponding analyses for hippocampal CA1 region. Data shown as mean ± standard error of the mean (SEM) with individual data points in correlation plots
Fig. 4
Fig. 4
UMAP visualization of the scRNA-seq data clustering at 17 months. Annotation of cell clusters representing distinct cell types was performed using SCType on pooled data from all experimental groups (n = 16 mice total). The corresponding figure for 7-month data is shown in Suppl. Figure 1
Fig. 5
Fig. 5
Sex-dependent gene expression patterns in 17-months old mice. Dot plot showing expression of key differentially expressed genes across the four experimental groups. Dot size indicates percentage of cells expressing each gene; color intensity represents average expression level (red = high, blue = low). Selected genes include female-specific (Hsp90aa1), male-specific (Scd2, Trf, Zc3h13), and sex-dimorphic (Cst3, Mbp, Apod) DEGs
Fig. 6
Fig. 6
Top 5 sex-dimorphic differentially expressed genes across major brain cell types in 17-month-old THY-Tau22 mice. Bar plots show log2 fold changes between THY-Tau22 and wild-type mice. Blue bars = male changes; pink bars = female changes. All genes shown had significant differential expression (FDR < 0.05) with opposing directions of change between sexes
Fig. 7
Fig. 7
Cell type-specific overlaps of differentially expressed genes across mouse models and human AD data. Venn diagrams showing intersections of DEGs in human AD cortical tissue, Tg2576 model, and THY-Tau22 mice at 7 and 17 months in (A) microglial cells, (B) oligodendrocytes, (C) neurons, and (D) astrocytes. Numbers indicate DEG counts in each intersection set
Fig. 8
Fig. 8
Gene regulatory network of male-specific differentially expressed genes in 17-month-old THY-Tau22 mice (global analysis across cell types). Nodes represent genes (red = increased expression, blue = decreased expression); edges show regulatory interactions (green arrows = activation, red lines = inhibition). The network comprises 28 nodes and 32 interactions (20 activations, 12 inhibitions). Key regulatory genes appear in the upper part with downstream targets below
Fig. 9
Fig. 9
Gene regulatory network of sex-dimorphic differentially expressed genes in 17-month-old THY-Tau22 mice (global analysis across cell types). Nodes represent genes (red = increased expression, blue = decreased expression); edges show regulatory interactions (green arrows = activation, red lines = inhibition). The network comprises 22 nodes and 49 interactions (26 activations, 14 inhibitions). Key regulatory genes appear in the upper part with downstream targets below
Fig. 10
Fig. 10
Gene Ontology biological processes enriched in age-dependent sex-dimorphic changes in astrocytes. Dot size indicates number of genes in each pathway; color represents statistical significance (red = more significant). Gene ratio (x-axis) shows proportion of pathway genes differentially expressed. Only pathways with FDR < 0.05 are shown
Fig. 11
Fig. 11
Gene Ontology biological processes enriched in age-dependent sex-dimorphic changes in oligodendrocytes. Dot size indicates number of genes in each pathway; color represents statistical significance (red = more significant). Gene ratio (x-axis) shows proportion of pathway genes differentially expressed. Only pathways with FDR < 0.05 are shown
Fig. 12
Fig. 12
Gene regulatory network of age-dependent transcriptional changes in microglial cells. Network shows relationships between differentially expressed genes in THY-Tau22 mice between 7 and 17 months of age. Node colors indicate expression changes (red = increased, blue = decreased). Edges show regulatory interactions (arrows = activation, perpendicular lines = inhibition). Only the 16 gene interaction partners of Klf4 with lowest p-values are shown to ensure the interpretability of the network

References

    1. Snyder HM, Asthana S, Bain L, Brinton R, Craft S, Dubal DB et al (2016) Sex biology contributions to vulnerability to Alzheimer’s disease: A think tank convened by the women’s Alzheimer’s research initiative. Alzheimers Dement 12:1186–1196. 10.1016/j.jalz.2016.08.004 - PMC - PubMed
    1. Schwartz JB, Weintraub S (2021) Treatment for alzheimer Disease—Sex and gender effects need to be explicitly analyzed and reported in clinical trials. JAMA Netw Open 4:e2124386. 10.1001/jamanetworkopen.2021.24386 - PubMed
    1. Filon JR, Intorcia AJ, Sue LI, Vazquez Arreola E, Wilson J, Davis KJ et al (2016) Gender differences in alzheimer disease: brain atrophy, histopathology burden, and cognition. J Neuropathol Exp Neurol 75:748–754. 10.1093/jnen/nlw047 - PMC - PubMed
    1. Dubal DB (2020) Sex difference in Alzheimer’s disease: an updated, balanced and emerging perspective on differing vulnerabilities. Handb Clin Neurol 175:261–273. 10.1016/B978-0-444-64123-6.00018-7 - PubMed
    1. Ossenkoppele R, Lyoo CH, Jester-Broms J, Sudre CH, Cho H, Ryu YH et al (2020) Assessment of demographic, genetic, and imaging variables associated with brain resilience and cognitive resilience to pathological Tau in patients with alzheimer disease. JAMA Neurol 77:632. 10.1001/jamaneurol.2019.5154 - PMC - PubMed

Publication types

LinkOut - more resources