. 2025 May 7;15(5):e71264.
doi: 10.1002/ece3.71264. eCollection 2025 May.

Going With the Flow? Relative Importance of Riverine Hydrologic Connectivity Versus Tidal Influence for Spatial Structure of Genetic Diversity and Relatedness in a Foundational Submersed Aquatic Plant

Affiliations

Going With the Flow? Relative Importance of Riverine Hydrologic Connectivity Versus Tidal Influence for Spatial Structure of Genetic Diversity and Relatedness in a Foundational Submersed Aquatic Plant

Maile C Neel et al. Ecol Evol. .

Abstract

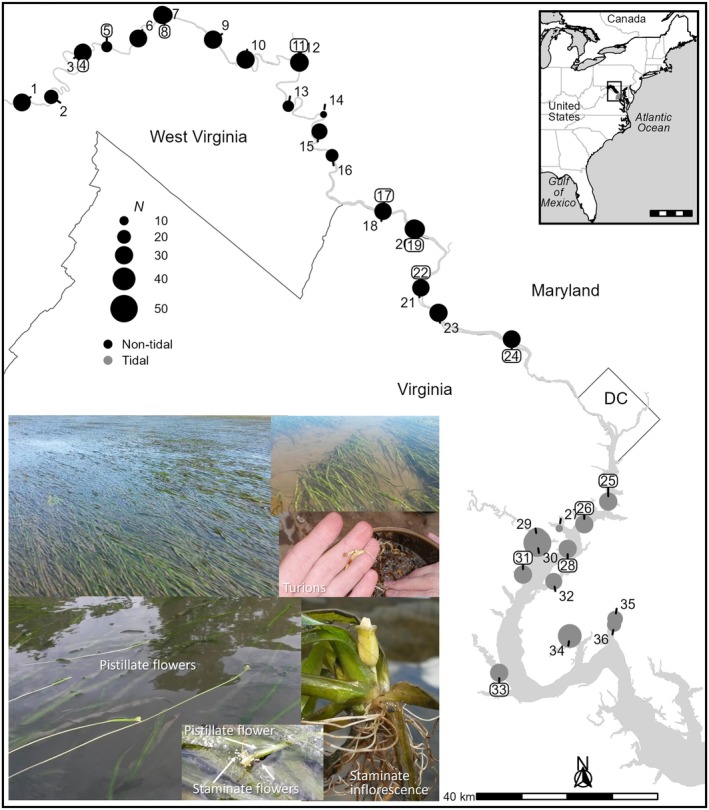
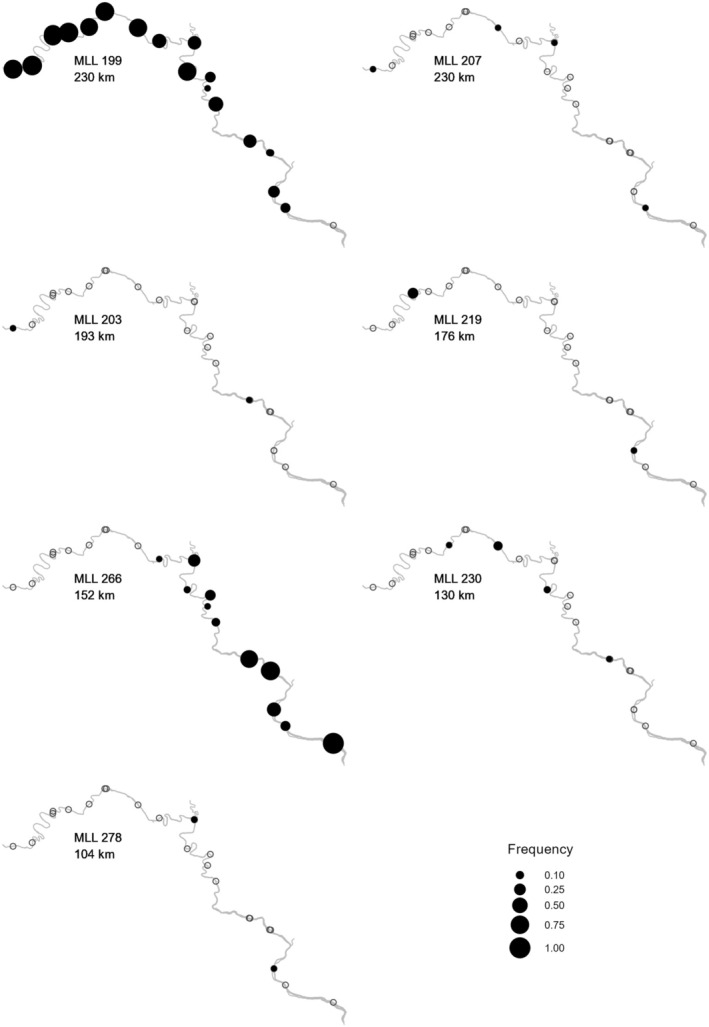
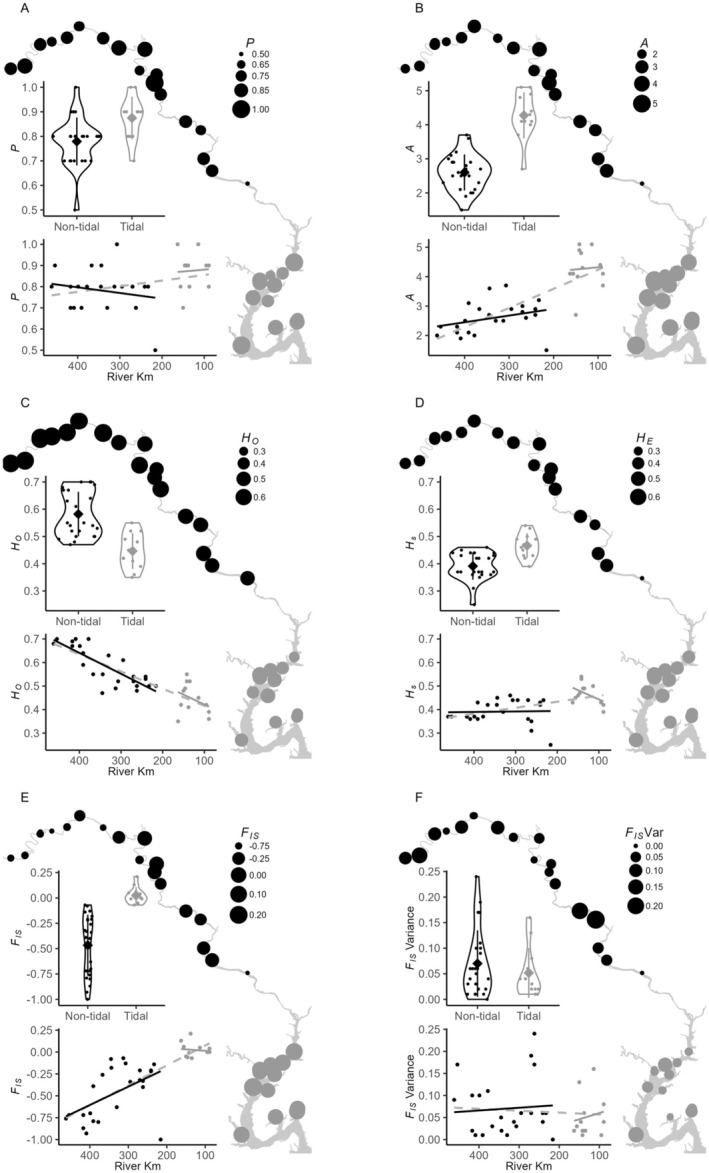
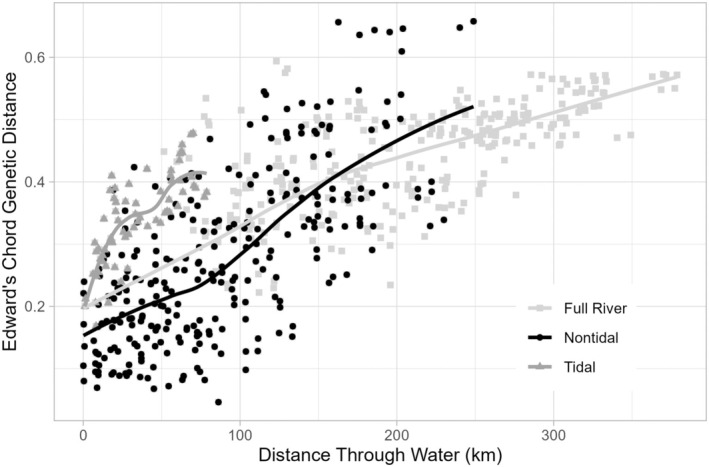
Genetic connectivity in rivers is generally high, and levels of genotypic and genetic diversity of riverine species are expected to accumulate in downstream locations. Genetic structure of marine and estuarine species is less predictable, even though hydrologic connectivity is also expected to be relatively high in those ecosystems. These observations have been generated across different species and locations such that our understanding of the effects of hydrologic connectivity in the same river, spanning tidal and nontidal habitats, remains incomplete. To control for species and location, we quantified diversity in 941 samples of Vallisneria americana Michx. (Hydrocharitaceae) collected from 36 sites along the species' entire distribution in the tidal and nontidal Potomac River of Maryland, Virginia, and the District of Columbia, USA. Using 10 microsatellite loci, we found 507 unique multilocus genotypes (MLGs) that were collapsed to 482 multilocus lineages (MLLs). Fifty-three MLLs were found multiple times across the riverscape, accounting for over 54% of the genotyped shoots. We found some evidence supporting connectivity throughout the river and stronger evidence that tidal regime drives genotypic and genetic structure within V. americana. Extensive clonality, including two MLLs spanning 230 and 152 km, limits diversity in the nontidal reaches and contrasts with very little evidence of clonal reproduction in tidal reaches. Genetic differentiation, structure, and pairwise relatedness of sampled shoots and MLLs also differed by tidal reach, with the nontidal Potomac having higher levels of relatedness, lower allelic diversity, and higher heterozygosity. The differences in spatial distribution of genetic diversity suggest very different outlooks for V. americana adaptation and acclimation to perturbations in tidal and nontidal regions of the Potomac, which lead to different recommendations for restoration of the same species in the same river.

Keywords: clonality; resilience; restoration ecology; spatial genetic structure; submersed aquatic vegetation.


Conflict of interest statement

The authors declare no conflicts of interest.

Figures

FIGURE 1
FIGURE 1
Thirty‐six Vallisneria americana sampling locations spanning the species distribution in the Potomac River, a major tributary of the Chesapeake Bay watershed. Site labels surrounded by a box are from Lloyd et al. (2011). The remaining sites are newly analyzed in this paper. Sample size (N) for each site is indicated by the size of the circle. Images show vegetative growth habit, pistillate (female) and staminate (male) inflorescences and flowers of V. americana . Photograph credits: Maile Neel. Political boundaries are from a dataset provided by the Commission for Environmental Cooperation (2022).
FIGURE 2
FIGURE 2
Accumulation curve showing power of different numbers of loci for detecting all 507 multilocus genotypes (MLGs) and 482 multilocus lineages (MLLs).
FIGURE 3
FIGURE 3
Site‐level genotypic richness (R) across the entire sample region of the Potomac River from nontidal (black circles) and tidal (gray circles) based on (A) the number of multilocus genotypes (MLLs), and the effective numbers of MLLs calculated from standardized (B) Shannon's index, (C) Simpson's index, and (D) Pareto β. Nontidal and tidal reaches are compared statistically using violin plots and correlations of R with river kilometer within each tidal reach (solid lines) and across the entire river (gray dashed line). Mean values among samples are indicated by the gray diamonds and error bars are one standard deviation.
FIGURE 4
FIGURE 4
Distribution of seven Vallisneria americana multilocus lineages (MLLs) that occur at multiple nontidal collection sites in the Potomac River. Sites with no instance of a given MLL are indicated with open circles.
FIGURE 5
FIGURE 5
Wang's pairwise relatedness among all samples (A, B) and among unique multilocus lineages (MLLs; C, D) within the same site (r W ; A, C) and at different sites (r A ; B, D) in tidal (gray) and nontidal (black) portions of the river. Nontidal and tidal reaches are compared statistically using violin plots and correlations of relatedness with river kilometer within each tidal reach (solid lines) and across the entire river (gray dashed line). Mean values among samples are indicated by the gray diamonds and error bars are one standard deviation. Y‐axis extents are standardized to allow comparison across statistics.
FIGURE 6
FIGURE 6
Within‐site genetic diversity statistics (A) P, (B) A, (C) H o , (D) H s , (E) mean F IS across loci, and (F) variance in F IS across loci in tidal (gray) and nontidal (black) portions of the river. Nontidal and tidal reaches are compared statistically using violin plots and correlations with river km within each tidal reach (solid lines) and across the entire river (gray dashed line). Values for each site are means of pairwise differences of that site to all other sites in the same tidal regime. Y‐axis extents are standardized to allow comparison across statistics.
FIGURE 7
FIGURE 7
(A) Comparison of H o , H s , and mean F IS calculated using all samples (triangles) and after clone correction (i.e., one sample of each MLL at each site; squares). The deviation between values at each sampled site (black lines and symbols are nontidal sites and gray tidal sites) highlight the extent to which each measure is affected by clonality. (B) Association between deviations and genotypic richness (R).
FIGURE 8
FIGURE 8
Among‐site genetic diversity statistics (A) F ST, (B) GST, and (C) D est by site and tidal regime in tidal (gray) and nontidal (black) portions of the river. Nontidal and tidal reaches are compared statistically using violin plots and correlations with river km within each tidal reach (solid lines) and across the entire river (gray dashed line). Mean values among samples are indicated by the gray diamonds and error bars are one standard deviation.
FIGURE 9
FIGURE 9
Scatterplot of Edward's chord genetic distance by geographic distance through water for the full river, nontidal sites, and tidal sites.
FIGURE 10
FIGURE 10
First and second axes of a correspondence analysis (CA) based on allele frequencies of all samples at 36 sites. Sites from 2007 to 2008 are from Lloyd et al. (2011). The interspersion of sites from different years indicates no large changes in allele frequencies across time.

References

    1. Alberte, R. S. , Suba G. K., Procaccini G., Zimmerman R. C., and Fain S. R.. 1994. “Assessment of Genetic Diversity of Seagrass Populations Using DNA‐Fingerprinting – Implications for Population Stability and Management.” Proceedings of the National Academy of Sciences of the United States of America 91, no. 3: 1049–1053. - PMC - PubMed
    1. Alberto, F. , Gouveia L., Arnaud‐Haond S., Perez‐Llorens J. L., Duarte C. M., and Serrao E. A.. 2005. “Within‐Population Spatial Genetic Structure, Neighbourhood Size and Clonal Subrange in the Seagrass Cymodocea nodosa .” Molecular Ecology 14, no. 9: 2669–2681. - PubMed
    1. Amos, W. , Wilmer J. W., Fullard K., et al. 2001. “The Influence of Parental Relatedness on Reproductive Success.” Proceedings of the Royal Society of London B: Biological Sciences 268, no. 1480: 2021–2027. 10.1098/rspb.2001.1751. - DOI - PMC - PubMed
    1. Arnaud‐Haond, S. , Duarte C. M., Alberto F., and Serrao E. A.. 2007. “Standardizing Methods to Address Clonality in Population Studies.” Molecular Ecology 16, no. 24: 5115–5139. 10.1111/j.1365-294X.2007.03535.x. - DOI - PubMed
    1. Arnaud‐Haond, S. , Duarte C. M., Diaz‐Almela E., Marba N., Sintes T., and Serrao E. A.. 2012. “Implications of Extreme Life Span in Clonal Organisms: Millenary Clones in Meadows of the Threatened Seagrass Posidonia oceanica .” PLoS One 7, no. 2: e30454. 10.1371/journal.pone.0030454. - DOI - PMC - PubMed

LinkOut - more resources