. 2025 Apr 23:16:1568145.
doi: 10.3389/fphys.2025.1568145. eCollection 2025.

Skeletal muscle microvascular hemodynamic responses during hyperinsulinemic-euglycemic clamp in a Zucker Diabetic Sprague Dawley rat model of type 2 diabetes

Affiliations

Skeletal muscle microvascular hemodynamic responses during hyperinsulinemic-euglycemic clamp in a Zucker Diabetic Sprague Dawley rat model of type 2 diabetes

Gaylene M Russell McEvoy et al. Front Physiol. .

Abstract

Objective: We sought to measure skeletal muscle microvascular hemodynamic responses in Sprague Dawley (SD) and Zucker Diabetic Sprague Dawley (ZDSD) rat model of type 2 diabetes (T2D) at rest and during a hyperinsulinemic-euglycemic clamp under resting conditions and during acute changes in local tissue oxygen concentration [(O2)].

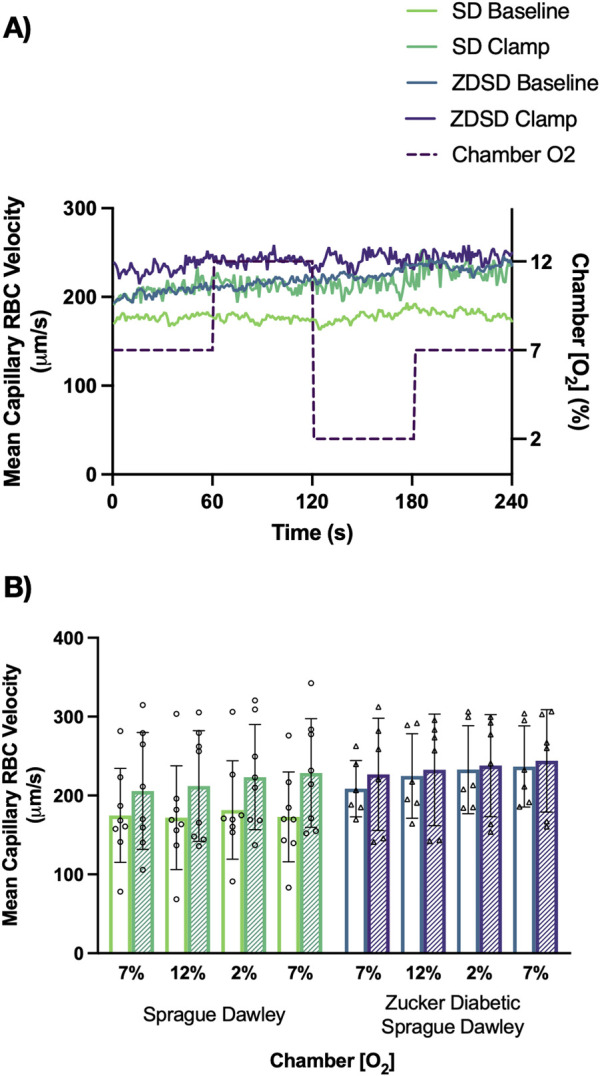
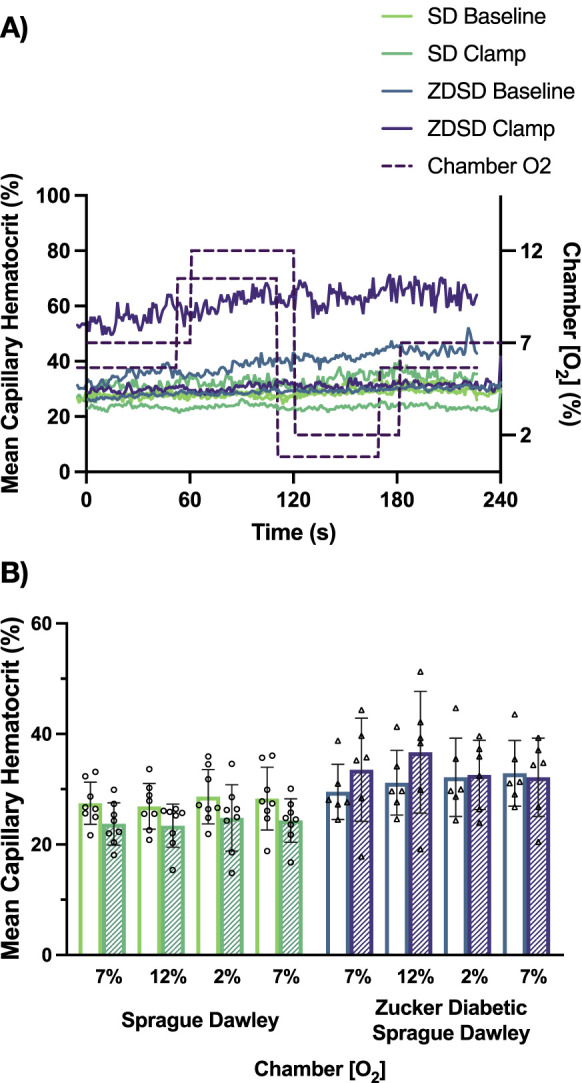
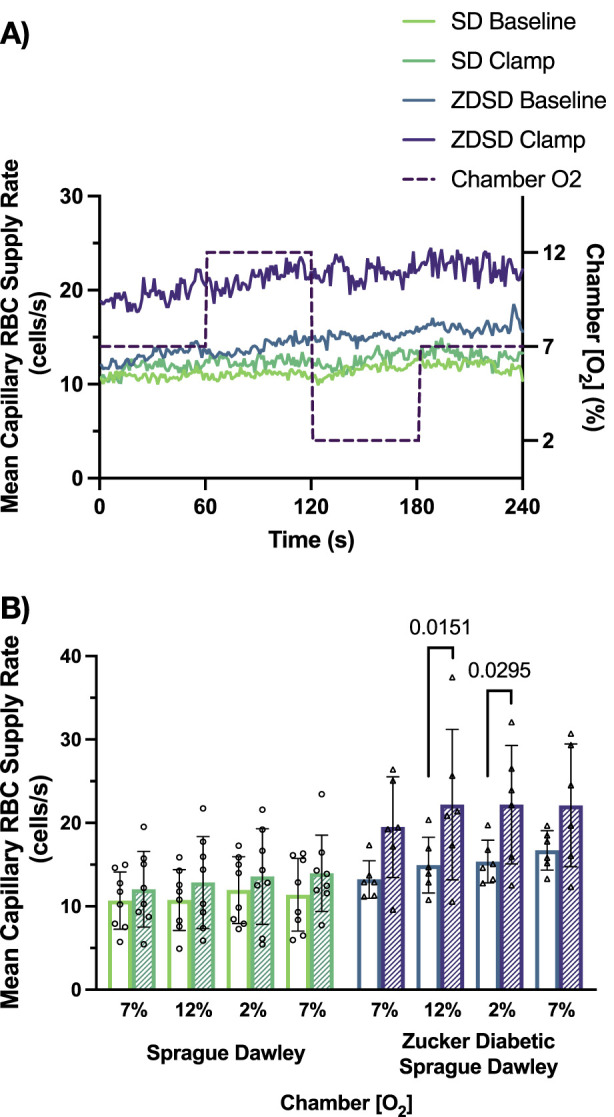
Methods: Male SD and ZDSD rats were fed a high-fat diet, transitioned to a high-fat high-sugar diet from 16-19 weeks old to induce T2D in the ZDSD strain, then returned to the high-fat diet until intravital video microscopy (IVVM). At 27 weeks of age animals were fasted overnight, and on the morning of the IVVM experiment animals were anaesthetized, instrumented, and mechanically ventilated. The extensor digitorum longus muscle was blunt dissected, isolated, and reflected over a glass coverslip or a gas exchange chamber (GEC) fitted in the stage of an inverted microscope. Microvascular hemodynamic responses were recorded during baseline and hyperinsulinemic-euglycemic clamp without perturbation (Protocol 1) and during sequential changes in GEC [O2] (7%-12%-2%-7%) (Protocol 2).

Results: In protocol 1, SD rats had a significant increase in red blood cell (RBC) velocity, RBC supply rate (SR), and RBC oxygen saturation (SO2) between baseline and euglycemia. However, ZDSD animals had no significant difference in hemodynamic responses and RBC SO2 between baseline and during hyperinsulinemic-euglycemic clamp. RBC SO2 was significantly higher in ZDSD than SD rats at baseline. In protocol 2, ZDSD rats had significantly higher RBC SO2 than their SD counterparts at 7% and 2% [O2]. RBC velocity, SR and capillary hematocrit showed no change from 7% in response to increased or decreased [O2] in either animal group. ZDSD rats had a significant increase between baseline and clamp in RBC SR at 12% as well as at 2% GEC [O2].

Conclusion: SD rats had a robust increase in capillary hemodynamics during hyperinsulinemic-euglycemic clamp whereas the capillary hemodynamics in ZDSD rats did not significantly change. Additionally, SD and ZDSD rats lacked expected hemodynamic responses in response to local [O2] changes during baseline and hyperinsulinemic-euglycemic clamp. This finding suggests that hyperglycemia in T2D and high-fat feeding alter microvascular hemodynamic responses to acute changes in muscle [O2].

Keywords: capillary hemodynamics; microvascular blood flow; oxygen mediated blood flow regulation; type 2 diabetes; zucker diabetic sprague dawley rat.


Conflict of interest statement

The authors declare that the research was conducted in the absence of any commercial or financial relationships that could be construed as a potential conflict of interest.

Figures

FIGURE 1
FIGURE 1
Timeline of the intravital video microscopy experimental protocol. Following an overnight fast, surgical preparation, and reflection of the extensor digitorum longus muscle on the microscope stage, animals were allowed to equilibrate for 30-min prior to data collection. Baseline 10X intravital videos were recorded followed by the hyperinsulinemic-euglycemic clamp. HumulinR was continuously infused at 2 U/mL/kg with simultaneous 50% glucose infusion at variable rates to achieve a stable blood glucose measurement between 5 and 7 mmol/L, as measured from a mixed tail clip blood sample. After reaching euglycemia, EDL intravital videos were recorded to allow comparison between the two conditions. All data was analyzed offline using custom MATLAB software.
FIGURE 2
FIGURE 2
Sprague Dawley and Zucker Diabetic Sprague Dawley growth chart and blood glucose measurements from 9 to 27 weeks of age. Weekly morning body weight measures were recorded from 9 to 17 weeks of age (A). Biweekly fasted saphenous blood glucose samples of Sprague Dawley (SD) and Zucker Diabetic Sprague Dawley (ZDSD) rats were collected biweekly from 9 to 27 weeks of age (B). ZDSD animals were separated by blood glucose phenotype following completion of the intravital video microscopy experiment. Error bars represent standard deviation. Shaded region indicates period of high-fat high-sugar feeding. N = 10 SD, 5 normoglycemic ZDSD, 13 Hyperglycemic ZDSD rats. *p < 0.05 ZDSD compared to SD, #p < 0.05 hyperglycemic ZDSD compared to normoglycemic ZDSD.
FIGURE 3
FIGURE 3
Blood glucose measurements and glucose infusion rates during hyperinsulinemic-euglycemic clamp in Sprague Dawley and Zucker Diabetic Sprague Dawley rats. Mean blood glucose (A) for each animal was determined using 3 sequential mixed blood samples from a tail clip. ZDSD animals were grouped by baseline blood glucose measurements during the intravital video microscopy experiment. Glucose infusion rates (GIR) were calculated based on mean infusion rate to achieve and maintain hyperinsulinemic-euglycemic clamp (B). Bars represent mean ± standard deviation. N = 6 Sprague Dawley, 4 Normoglycemic Zucker Diabetic Sprague Dawley (ZDSD), and 7 Hyperglycemic ZDSD animals. P values are indicated in the figure, p < 0.05 were considered significant.
FIGURE 4
FIGURE 4
Capillary hemodynamics and red blood cell oxygen saturation of Sprague Dawley and Zucker Diabetic Sprague Dawley rats at baseline and during hyperinsulinemic-euglycemic clamp. Capillary RBC velocity (A), RBC supply rate (B), hematocrit (C), and RBC SO2 (D). Symbols correspond to per animal means. p < 0.05 were considered significant. N = 6 Sprague Dawley (SD), 4 Normoglycemic Zucker Diabetic Sprague Dawley (ZDSD), and 7 Hyperglycemic ZDSD animals.
FIGURE 5
FIGURE 5
Functional capillary density measurements of Sprague Dawley and Zucker Diabetic Sprague Dawley rats. In focus capillaries with red blood cell (RBC) flow were determined to be continuous (A), intermittent with reversed or stopped flow for >5 s (B) or stopped (C) flow at baseline and during hyperinsulinemic euglycemic clamp. Symbols correspond to per animal means before and during hyperinsulinemic-euglycemia. Bars represent mean. N = 6 Sprague Dawley (SD), 4 Normoglycemic Zucker Diabetic Sprague Dawley (ZDSD), and 7 Hyperglycemic ZDSD animals.
FIGURE 6
FIGURE 6
Blood glucose measure of Sprague Dawley and Zucker Diabetic Sprague Dawley rats before and during hyperinsulinemic-euglycemic clamp with oxygen perturbations. Each symbol represents average of 3 baseline measurements and 3 measures from each animal taken immediately preceding hyperinsulinemic-euglycemic clamp recording (A). Glucose infusion rate (GIR), in mg/kg/min, was calculated beginning when euglycemia was achieved and throughout the duration of the hyperinsulinemic-euglycemic clamp recording period (B). Bars represent mean ± standard deviation. N = 8 SD and 8 ZDSD animals. p values less than 0.05 were considered significant and are included in the figures.
FIGURE 7
FIGURE 7
Mean capillary red blood cell oxygen saturation of Sprague Dawley and Zucker Diabetic Sprague Dawley rats in response to oxygen oscillations during baseline and hyperinsulinemic-euglycemic clamp. Time series of capillary red blood cell (RBC) oxygen saturation (SO2) (%) measurements from extensor digitorum longus muscle of Sprague Dawley (SD) and Zucker Diabetic Sprague Dawley (ZDSD) rats interfaced with a gas exchange chamber. Changes in oxygen concentration ([O2]) were oscillated from 7% to 12%–2% - 7% for 1 min each. Capillary data for each second from SD and ZDSD rats were calculated for 240s to create time transient plots (A). (B) indicates the per animal mean values of the last 15 s of each gas condition at baseline (empty bars) and during hyperinsulinemic-euglycemic clamp (hatched bars). N = 8 SD animals, 132 capillaries at baseline, 100 capillaries during clamp. N = 6 ZDSD animals, 124 capillaries at baseline, and 59 capillaries during clamp. Bars represent mean ± standard deviation. *p < 0.05, **p < 0.01, ****p < 0.0001.
FIGURE 8
FIGURE 8
Mean capillary red blood cell velocity of Sprague Dawley and Zucker Diabetic Sprague Dawley rats in response to oxygen oscillations during baseline and hyperinsulinemic-euglycemic clamp. Time series of capillary red blood cell (RBC) velocity, in µm/s, measurements from extensor digitorum longus muscle of Sprague Dawley (SD) and Zucker Diabetic Sprague Dawley (ZDSD) rats interfaced with a gas exchange chamber. Changes in oxygen concentration [(O2)] were oscillated from 7% to 12%–2% - 7% for 1 min each. Capillary data for each second from SD and ZDSD rats were calculated for 240s to create time transient plots (A). (B) indicates the per animal mean values of the last 15 s of each gas condition at baseline (empty bars) and during hyperinsulinemic-euglycemic clamp (hatched bars). N = 8 SD animals, 243 capillaries at baseline, 179 capillaries during clamp. N = 6 ZDSD animals, 225 capillaries at baseline, and 95 capillaries during clamp. Bars represent mean ± standard deviation.
FIGURE 9
FIGURE 9
Mean capillary hematocrit of Sprague Dawley and Zucker Diabetic Sprague Dawley rats in response to oxygen oscillations during baseline and hyperinsulinemic-euglycemic clamp. Time series of capillary hematocrit (%) measurements from extensor digitorum longus muscle of Sprague Dawley (SD) and Zucker Diabetic Sprague Dawley (ZDSD) rats interfaced with a gas exchange chamber. Changes in oxygen concentration ([O2]) were oscillated from 7% - 12% - 2% - 7% for 1 min each. Capillary data for each second from SD and ZDSD rats were calculated for 240s to create time transient plots (A). (B) indicates the per animal mean values of the last 15 s of each gas condition at baseline (empty bars) and during hyperinsulinemic-euglycemic clamp (hatched bars). N = 8 SD animals, 243 capillaries at baseline, 179 capillaries during clamp. N = 6 ZDSD animals, 225 capillaries at baseline, and 95 capillaries during clamp. Bars represent mean ± standard deviation.
FIGURE 10
FIGURE 10
Mean capillary red blood cell supply rate of Sprague Dawley and Zucker Diabetic Sprague Dawley rats in response to oxygen oscillations during baseline and hyperinsulinemic-euglycemic clamp. Time series of capillary red blood cell (RBC) supply rate, in cells/s, measurements from extensor digitorum longus muscle of Sprague Dawley (SD) and Zucker Diabetic Sprague Dawley (ZDSD) rats interfaced with a gas exchange chamber. Changes in oxygen concentration [(O2)] were oscillated from 7% - 12% - 2% - 7% for 1 min each. Capillary data for each second from SD and ZDSD rats were calculated for 240 s to create time transient plots (A). (B) indicates the per animal mean values of the last 15 s of each gas condition at baseline (empty bars) and during hyperinsulinemic-euglycemic clamp (hatched bars). N = 8 SD animals, 243 capillaries at baseline, 179 capillaries during clamp. N = 6 ZDSD animals, 225 capillaries at baseline, and 95 capillaries during clamp. Bars represent mean ± standard deviation. p values <0.05 were considered significant and are indicated in the figure.

Similar articles

References

    1. Akerstrom T., Goldman D., Nilsson F., Milkovich S. L., Fraser G. M., Brand C. L., et al. (2020). Hyperinsulinemia does not cause de novo capillary recruitment in rat skeletal muscle. Microcirc. (New York, N. Y. 1994) 27 (2), e12593. 10.1111/micc.12593 - DOI - PMC - PubMed
    1. Anderson S. I., Hudlicka O., Brown M. D. (1997). Capillary red blood cell flow and activation of white blood cells in chronic muscle ischemia in the rat. Am. J. Physiol. 272 (6 Pt 2), H2757–H2764. 10.1152/ajpheart.1997.272.6.H2757 - DOI - PubMed
    1. Baron A. D., Steinberg H. O., Chaker H., Leaming R., Johnson A., Brechtel G. (1995). Insulin-mediated skeletal muscle vasodilation contributes to both insulin sensitivity and responsiveness in lean humans. J. Clin. Invest. 96 (2), 786–792. 10.1172/JCI118124 - DOI - PMC - PubMed
    1. Bateman R. M., Jagger J. E., Sharpe M. D., Ellsworth M. L., Mehta S., Ellis C. G. (2001). Erythrocyte deformability is a nitric oxide-mediated factor in decreased capillary density during sepsis. Am. J. Physiol. Heart Circ. Physiol. 280 (6), H2848–H2856. 10.1152/ajpheart.2001.280.6.H2848 - DOI - PubMed
    1. Bateman R. M., Sharpe M. D., Goldman D., Lidington D., Ellis C. G. (2008). Inhibiting nitric oxide overproduction during hypotensive sepsis increases local oxygen consumption in rat skeletal muscle. Crit. Care Med. 36 (1), 225–231. 10.1097/01.CCM.0000295307.92027.2F - DOI - PubMed

LinkOut - more resources