. 2025 Apr 23:12:1510793.
doi: 10.3389/fmed.2025.1510793. eCollection 2025.

Integration of histopathological image features and multi-dimensional omics data in predicting molecular features and survival in glioblastoma

Affiliations

Integration of histopathological image features and multi-dimensional omics data in predicting molecular features and survival in glioblastoma

Yeqian Huang et al. Front Med (Lausanne). .

Abstract

Objectives: Glioblastoma (GBM) is a highly malignant brain tumor with complex molecular mechanisms. Histopathological images provide valuable morphological information of tumors. This study aims to evaluate the predictive potential of quantitative histopathological image features (HIF) for molecular characteristics and overall survival (OS) in GBM patients by integrating HIF with multi-omics data.

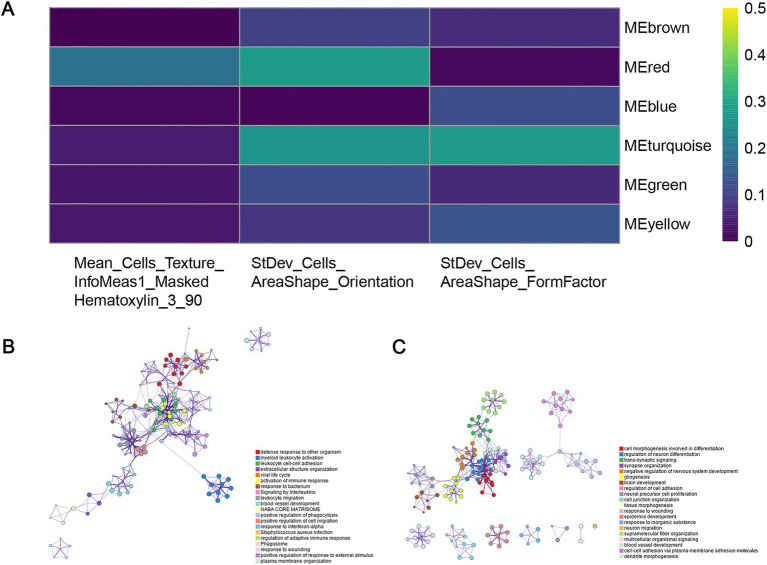
Methods: We included 439 GBM patients with eligible histopathological images and corresponding genetic data from The Cancer Genome Atlas (TCGA). A total of 550 image features were extracted from the histopathological images. Machine learning algorithms were employed to identify molecular characteristics, with random forest (RF) models demonstrating the best predictive performance. Predictive models for OS were constructed based on HIF using RF. Additionally, we enrolled tissue microarrays of 67 patients as an external validation set. The prognostic histopathological image features (PHIF) were identified using two machine learning algorithms, and prognosis-related gene modules were discovered through WGCNA.

Results: The RF-based OS prediction model achieved significant prognostic accuracy (5-year AUC = 0.829). Prognostic models were also developed using single-omics, the integration of HIF and single-omics (HIF + genomics, HIF + transcriptomics, HIF + proteomics), and all features (multi-omics). The multi-omics model achieved the best prediction performance (1-, 3- and 5-year AUCs of 0.820, 0.926 and 0.878, respectively).

Conclusion: Our study indicated a certain prognostic value of HIF, and the integrated multi-omics model may enhance the prognostic prediction of GBM, offering improved accuracy and robustness for clinical application.

Keywords: genomics; glioblastoma; histopathological image; prognosis; proteomics; transcriptomics.


Conflict of interest statement

The authors declare that the research was conducted in the absence of any commercial or financial relationships that could be construed as a potential conflict of interest.

Figures

Figure 1
Figure 1
The workflow of data analysis and prognostic model construction. (1) The whole-slide histopathological images of GBM were segmented into sub-images of 1,000 × 1,000 pixels. Through CellProfiler the histopathological image features (HIF) were extracted for subsequent analyses. (2) Image feature selection and molecular features prediction based on HIF using different combinations of machine learning algorithms. (3) Construction of prognostic models for overall survival in TCGA training set based on HIF genomics, transcriptomics and proteomics data. (4) Selection of prognostic histopathological image features (PHIF) by two machine learning methods. Identification of prognostic gene modules and gene pathway analysis were performed subsequently.
Figure 2
Figure 2
The predictive power of HIF in molecular features. Four machine learning algorithms (GBDT, LASSO, RF, and XGBoost) were applied for feature selection. Eight machine learning classifiers (RF, GBDT, Addaboost (ADABAG), LR, DT, SVM, NB, and KNN) were applied for molecular feature classification.
Figure 3
Figure 3
Univariate survival analyses based on HIF. GBM patients were assigned into high-risk and low-risk group according to the median value of each feature. (A) Hazard ratio of survival difference between two groups in univariate Cox regression. (B) Kaplan–Meier curves for groups with high-value and low-value “Median_Cells_AreaShape_Zernike_5_5,” “Mean_Cells_Texture_Contrast_3_45,” “Mean_Cells_Texture_DifferenceEntropy_3_45” and “StDev_Cells_Texture_SumAverage_3_0.” (C) Representative sub-images of high-risk and low-risk groups in both TCGA and TMA validation cohorts.
Figure 4
Figure 4
Prognostic models integrating HIF and genomics. (A) The waterfall plot of the top 15 most common somatic mutations in training set. (B) Kaplan–Meier curves of histopathological image features model (HIF), genomics model (G) and integrative histopathology + genomics model (HIF + G) in the validation set. (C–E) The (C) 1-year, (D) 3-year, and (E) 5-year area under the time-dependent receiver operating curve (AUC) of the three prognostic models in the validation set. (F) Kaplan–Meier curves of high-risk group and low-risk group in the TMA external validation cohort. (G) Time-dependent ROC of 1-year, 3-year, and 5-year OS in the TMA external validation cohort.
Figure 5
Figure 5
Prognostic models integrating HIF and transcriptomics (RNA). (A) Metascape enrichment network visualization cluster of genes and associated biological pathways based on training set. Each circled node represents a term and each color represents its cluster identification, showing the intra-cluster and inter-cluster similarities of enriched terms. (B) Kaplan–Meier curves of prognostic models (HIF, RNA, and HIF + RNA) in the validation set. (C–E). The (C) 1-year, (D) 3-year and (E) 5-year AUCs of the three prognostic models in the validation set.
Figure 6
Figure 6
Prognostic models integrating HIF with proteomics (P). (A–C) The (A) 1-year, (B) 3-year and (C) 5-year AUCs of the three prognostic models (HIF, P and HIF + P) in the validation set. (D) Kaplan–Meier curves of the three prognostic models in the validation set.
Figure 7
Figure 7
Prognostic models of survival integrating HIF and multiple omics features. (A) AUCs of multi-omics model in the validation set. Kaplan–Meier curve of multi-omics model (integrating HIF, radiomics, genomics, transcriptomics, proteomics) in the validation set. (B) Decision curves analysis for different models in the validation set. (C) The gray oblique line represented the net benefit of intervention for all patients, while the horizontal line represented the net benefit of no intervention. The multi-omics model achieved higher net benefit than single-omics models across the major range of threshold probability.
Figure 8
Figure 8
Selection of prognostic histopathological image features (PHIF). (A) Twelve image features were selected by SVM-RFE. (B) Five image features were selected by LASSO-COX regression model. Three image features within the overlap were defined as PHIF. Three image features within the overlap were defined as PHIF. (C) Representative sub-images of patients with high expressed and low expressed PHIF. The groups were defined by the median value of each image feature.
Figure 9
Figure 9
Identification of co-expressed gene modules. (A) Heatmap of the relationship between gene modules and prognostic histopathological image features (PHIF) through WGCNA. The red module and turquoise module showed the most significant correlation. (B) Metascape enrichment network of genes in the red module. Each circled node represents a term and each color represents its cluster identification, showing the intra-cluster and inter-cluster similarities of enriched terms. (C) Metascape enrichment network of genes in the turquoise module.

Similar articles

References

    1. Ye F, Gao Q, Cai MJ. Therapeutic targeting of EGFR in malignant gliomas. Expert Opin Ther Targets. (2010) 14:303–16. doi: 10.1517/14728221003598948, PMID: - DOI - PubMed
    1. Louis DN, Perry A, Reifenberger G, von Deimling A, Figarella-Branger D, Cavenee WK, et al. . The 2016 World Health Organization classification of tumors of the central nervous system: a summary. Acta Neuropathol. (2016) 131:803–20. doi: 10.1007/s00401-016-1545-1, PMID: - DOI - PubMed
    1. Ostrom Q, Cioffi G, Gittleman H, Patil N, Waite K, Kruchko C, et al. . CBTRUS statistical report: primary brain and other central nervous system tumors diagnosed in the United States in 2012–2016. Neuro-Oncol. (2019) 21:v1–v100. doi: 10.1093/neuonc/noz150, PMID: - DOI - PMC - PubMed
    1. Ostrom QT, Price M, Neff C, Cioffi G, Waite KA, Kruchko C, et al. . CBTRUS statistical report: primary brain and other central nervous system tumors diagnosed in the United States in 2015–2019. Neuro-Oncol. (2022) 24:v1–v95. doi: 10.1093/neuonc/noac202, PMID: - DOI - PMC - PubMed
    1. Stupp R, Mason WP, van den Bent MJ, Weller M, Fisher B, Taphoorn MJB, et al. . Radiotherapy plus concomitant and adjuvant temozolomide for glioblastoma. N Engl J Med. (2005) 352:987–96. doi: 10.1056/NEJMoa043330, PMID: - DOI - PubMed

LinkOut - more resources