. 2025 Apr 25:52:233-248.
doi: 10.1016/j.jot.2025.04.005. eCollection 2025 May.

SHP2-mediated ROS activation induces chondrocyte paraptosis in osteoarthritis and is attenuated by low-intensity pulsed ultrasound

Affiliations

SHP2-mediated ROS activation induces chondrocyte paraptosis in osteoarthritis and is attenuated by low-intensity pulsed ultrasound

Wenjie Hou et al. J Orthop Translat. .

Abstract

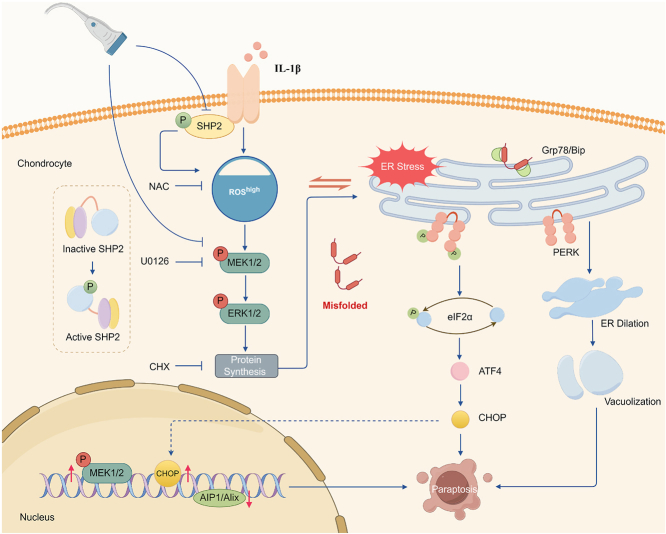
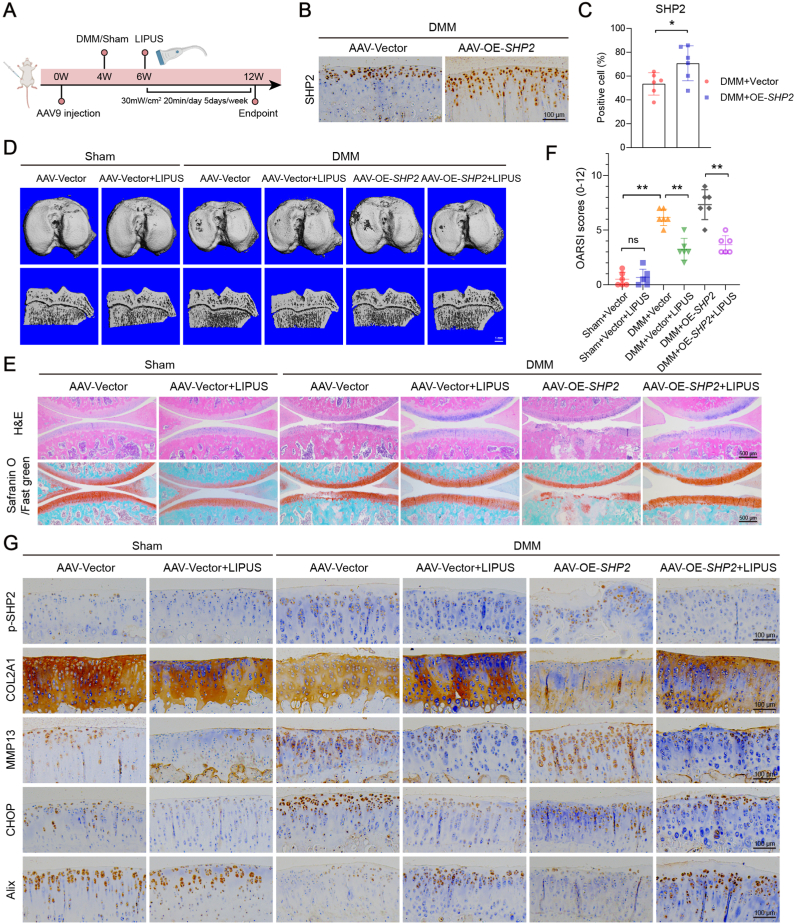
Background: Paraptosis is a novel form of programmed cell death, generally caused by disrupted proteostasis or alterations of redox homeostasis. However, its impact and underlying mechanisms on the pathology of osteoarthritis (OA) are still unclear. This study aimed to investigate the role and regulatory mechanism of SHP2 in chondrocyte paraptosis and the effects influenced by low-intensity pulsed ultrasound (LIPUS).

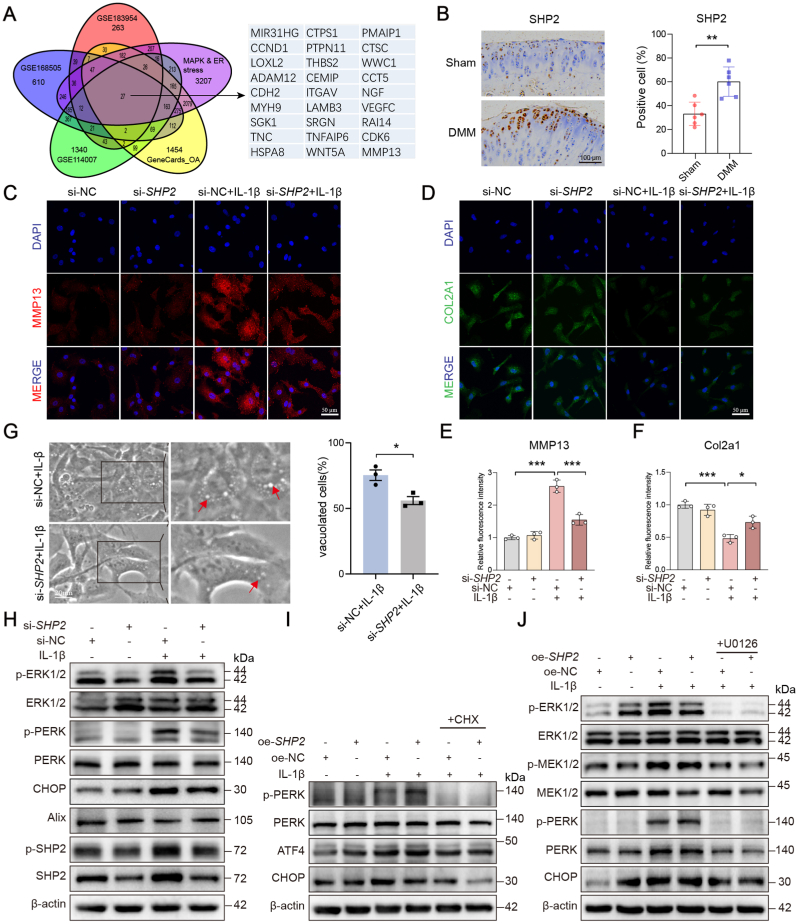
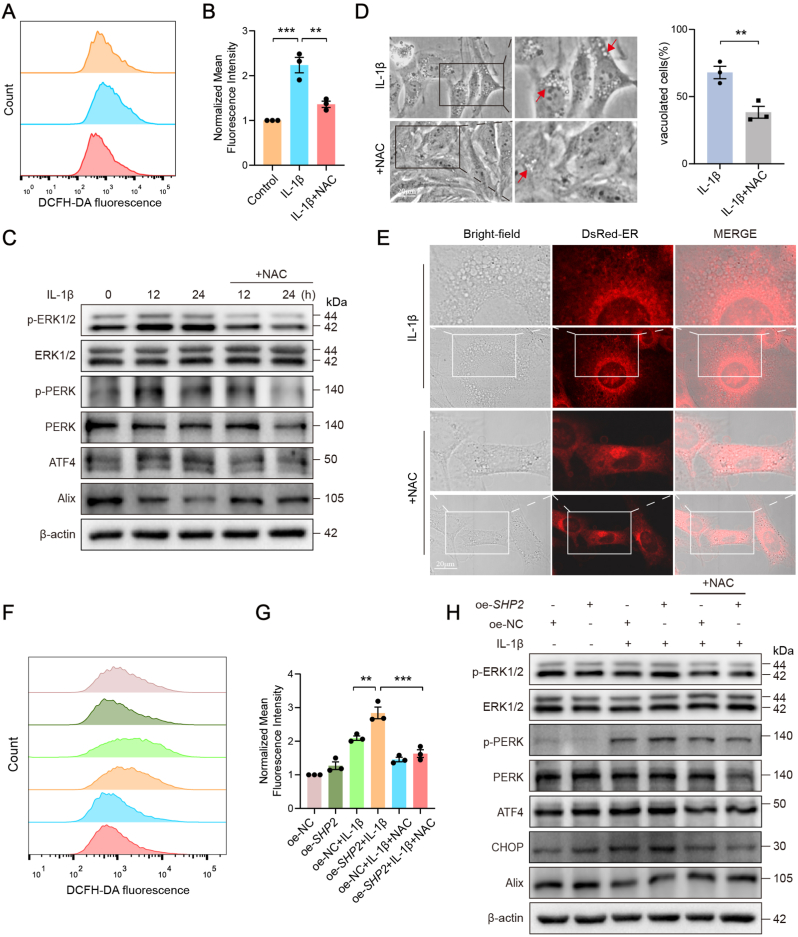
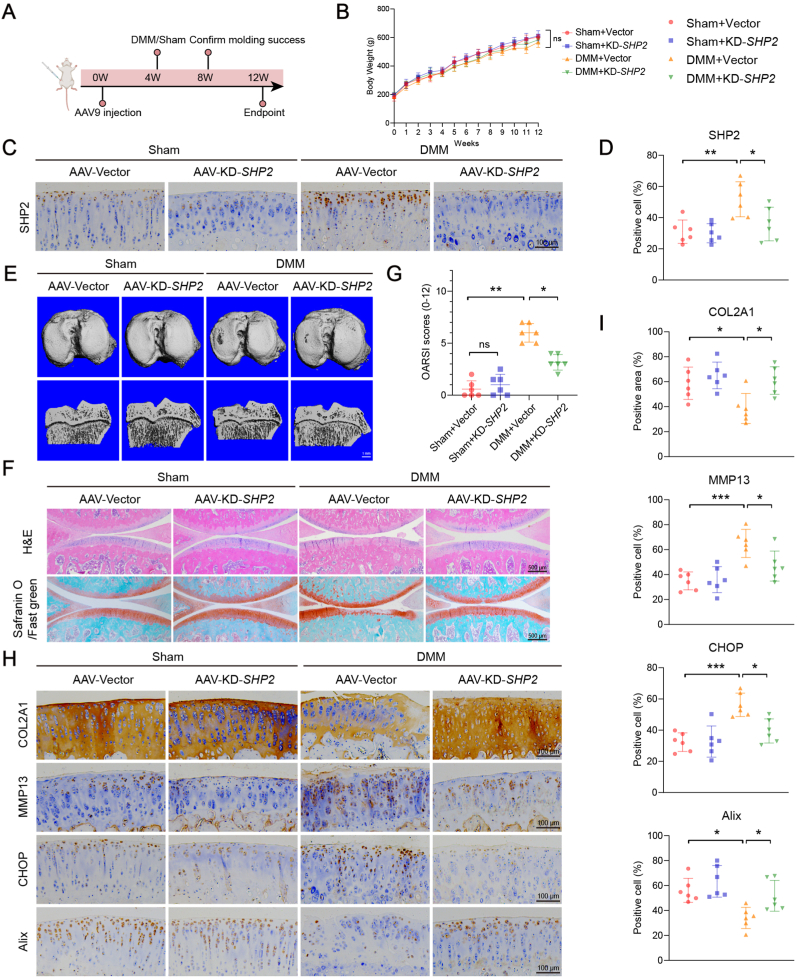
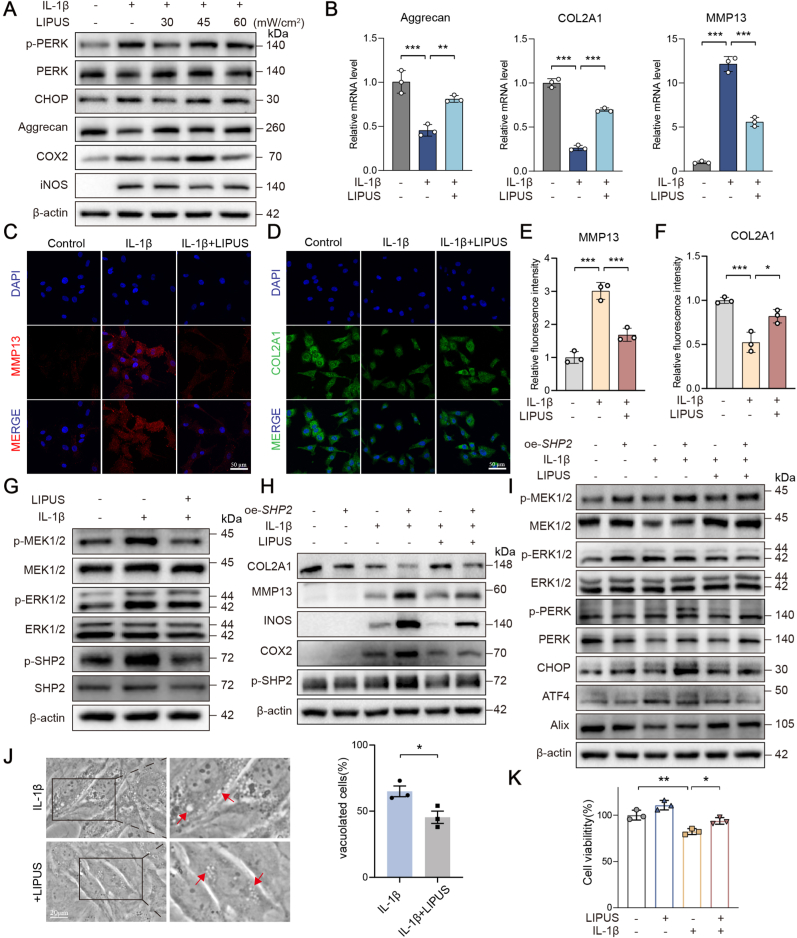
Methods: SHP2, a MAPK upstream intermediary, has been identified as one of the critical targets of IL-1β-induced paraptosis in the GEO and GeneCard databases. The expression of SHP2 in chondrocytes was regulated by either siRNA knockdown or plasmid overexpression. Additionally, adeno-associated viruses were injected into the knee joints of rats to explore whether SHP2 plays a role in the development of OA. The impact of LIPUS on paraptosis and OA was examined in IL-1β-induced chondrocytes and a post-traumatic OA model, with SHP2 regulation assessed at both cellular and animal levels.

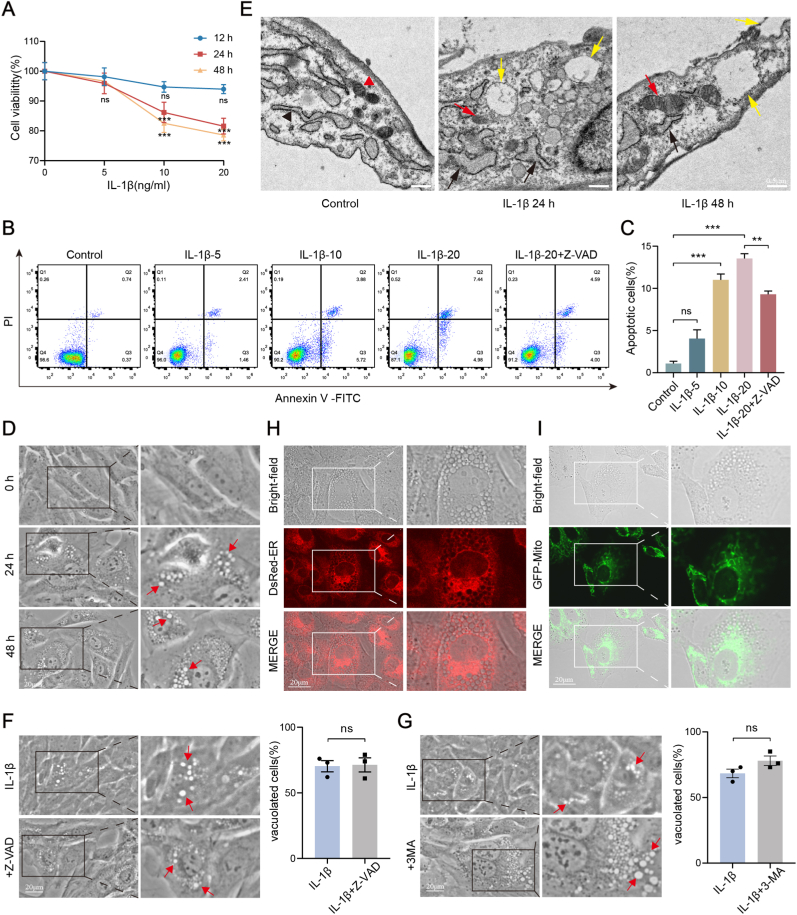
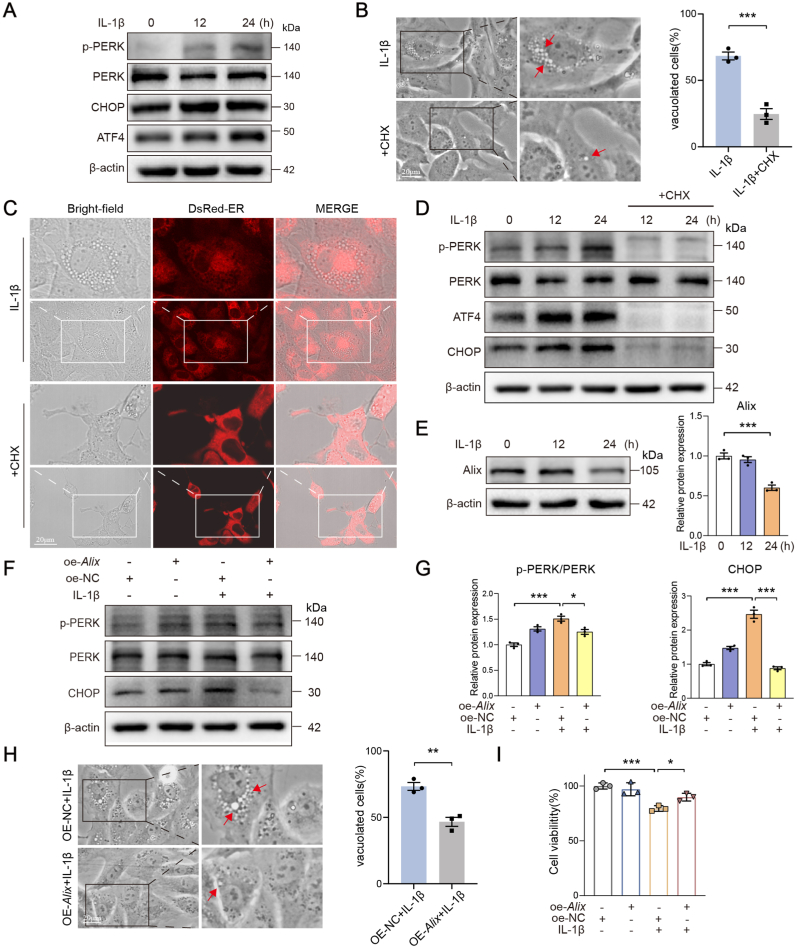
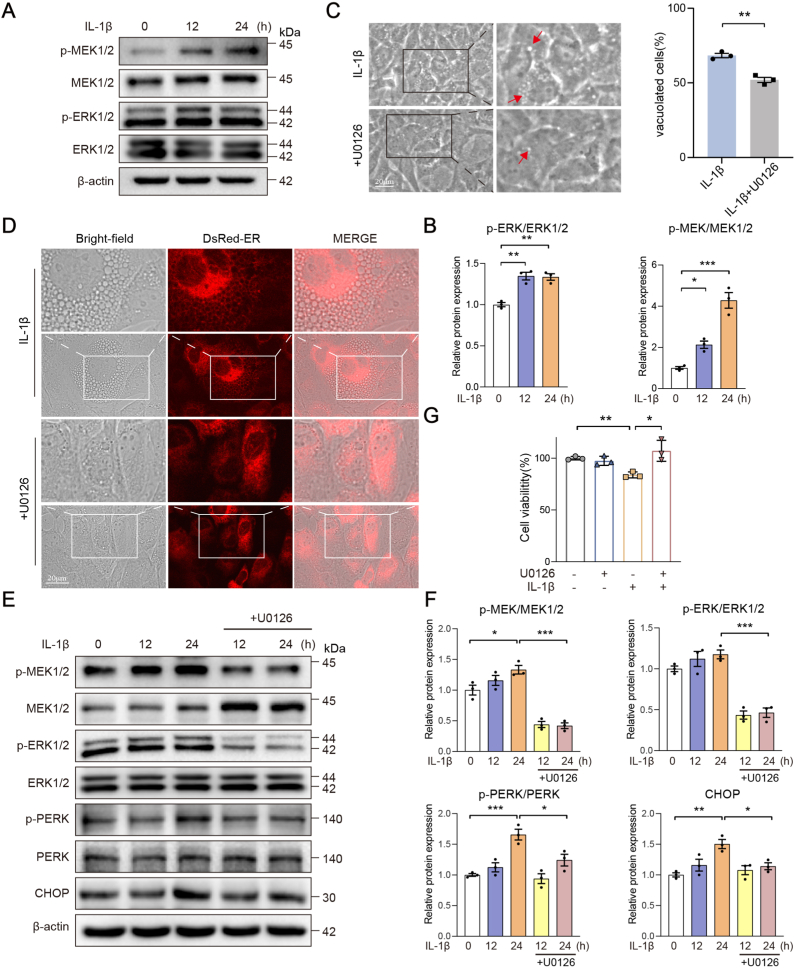
Results: An increase in cellular reactive oxygen species (ROS) caused by IL-1β halts the growth of chondrocytes and induces paraptosis in the chondrocytes. IL-1β-induced paraptosis, manifested as endoplasmic reticulum (ER)-derived vacuolization, was mediated by ROS-mediated ER stress and MAPK activation. SHP2 facilitates ROS production, thereby exacerbating the chondrocytes paraptosis. SHP2 knockdown and ROS inhibition effectively reduced this process and significantly mitigated inflammation and cartilage degeneration. Furthermore, we discovered that LIPUS delayed OA progression by inhibiting the activation of the MAPK pathway, ER stress, and ER-derived vacuoles in chondrocytes, all of which play critical roles in paraptosis, through the downregulation of SHP2 expression. Results on animals showed that LIPUS inhibited cartilage degeneration and alleviated OA progression.

Conclusion: SHP2 exacerbates IL-1β-induced oxidative stress and the subsequent paraptosis in chondrocytes, promoting OA progression. LIPUS mitigates paraptosis by modulating SHP2, which in turn slows OA progression.

The translational potential of this article: This study indicates that a novel SHP2-mediated cell death mechanism, paraptosis, plays a role in post-traumatic OA progression. LIPUS helps maintain cartilage-subchondral bone unit integrity by targeting SHP2 inhibition. SHP2 emerges as a potential therapeutic target, while LIPUS provides a promising non-invasive approach for treating trauma-related OA.

Keywords: Chondrocyte; LIPUS; Oxidative stress; Paraptosis; Post-traumatic OA; SHP2.


Conflict of interest statement

The authors have declared that no competing interest exists.

Figures

Image 1
Diagram of mechanism schematic diagram of LIPUS inhibits OA progression by regulating paraptosis-related axis
Fig. 1
Fig. 1
IL-1β induces cell death and ER-derived vacuoles in chondrocytes. (A) Cell viability (%) of chondrocytes exposed to varying concentrations and durations of IL-1β was assessed using the CCK-8 assay. (B) Chondrocytes were incubated with the caspase inhibitor Z-VAD for 12 h before being treated with IL-1β for 24 h. Cell death was analyzed through Annexin V/PI staining. (C) Cell death was quantified after Annexin V/PI staining, showing the percentage of double-positive cells. (D) Chondrocytes were treated with 10 ng/ml IL-1β and examined under light microscopy. Arrows point to cytoplasmic vacuoles (scale bars: 20 μm). (E) Electron microscopy images of chondrocytes exposed to IL-1β. Control cells displayed a well-organized ER (black arrowheads) and normal mitochondria (red arrowheads). Chondrocytes treated with IL-1β showed some swollen ER cisternae (black arrows) and many cytoplasmic vacuoles (yellow arrows). Some damaged mitochondria (red arrows) were also observed (scale bars: 0.5 μm). (FG) Chondrocytes were treated with 10 ng/ml IL-1β alone or in combination with Z-VAD (20 μM) or 3-MA (5 mM) for 12 h and then observed under light microscopy. Arrows point to cytoplasmic vacuoles (scale bar: 20 μm). At least 100 cells were visually examined to determine the proportion of cells showing vacuoles. (HI) Chondrocytes expressing DsRed-ER or GFP-Mito were exposed to 10 ng/ml IL-1β for 24 h, and observed using confocal microscopy (scale bars: 20 μm). Data are shown as mean ± SD (n = 3). ns, p > 0.05, ∗p < 0.05, ∗∗p < 0.01, ∗∗∗p < 0.001.
Fig. 2
Fig. 2
IL-1β induces ER stress-dependent paraptosis in chondrocytes. (A) Analysis of ER stress proteins in chondrocytes after treatment with 10 ng/ml IL-1β at designated time points. (B) Left panel: Light microscopy images of chondrocytes treated with 10 ng/ml IL-1β after CHX pretreatment. Arrows point to cytoplasmic vacuoles (scale bar: 20 μm). Right panel: at least 100 cells were visually examined to determine the proportion of cells showing vacuoles. (C) Fluorescence and bright-field images of DsRed-ER chondrocytes treated with 10 ng/ml IL-1β for 24 h, with or without CHX pretreatment (5 μM for 4 h) (scale bar: 20 μm). (D) Protein levels were analyzed after pretreating cells with CHX for 4 h, followed by 10 ng/ml IL-1β exposure for 12 or 24 h. (E) Western blot and quantification of Alix levels in chondrocytes treated with 10 ng/ml IL-1β at specified time points. (FG) Western blot and quantification of proteins in Alix-overexpressing chondrocytes treated with 10 ng/ml IL-1β for 24 h. (H) Left panel: Representative phase-contrast images of cells overexpressing Alix after 24 h exposure to 10 ng/ml IL-1β. Arrows showing cytoplasmic vacuoles (scale bar: 20 μm). Right panel: at least 100 cells were visually examined to determine the proportion of cells showing vacuoles. (I) Cell viability of chondrocytes overexpressing Alix exposed to 10 ng/ml IL-1β for 48 h. Data are shown as mean ± SD (n = 3). ns, p > 0.05, ∗p < 0.05, ∗∗p < 0.01, ∗∗∗p < 0.001.
Fig. 3
Fig. 3
Inhibition of MEK/ERK signaling pathway alleviates IL-1β-induced paraptosis in chondrocytes. (A) Analysis of proteins in chondrocytes treated with 10 ng/ml IL-1β at specified time points. (B) Quantitative analysis of p-ERK1/2 and p-MEK1/2 expression level. (C) Left panel: Light microscopy images of chondrocytes treated with 10 ng/ml IL-1β, alone or with U0126 (10 μM), for 24 h. Arrows point to cytoplasmic vacuoles (scale bar: 20 μm). Right panel: at least 100 cells were visually examined to determine the proportion of cells showing vacuoles. (D) Fluorescence and bright-field images of DsRed-ER chondrocytes treated with 10 ng/ml IL-1β, alone or with U0126 (10 μM), for 24 h (scale bar: 20 μm). (EF) Western blot and quantification of protein levels in chondrocytes treated with 10 ng/ml IL-1β, alone or with U0126 (10 μM). (G) The viability of chondrocytes treated with 10 ng/ml IL-1β alone or in combination with U0126 (10 μM) for 24 h. Data are shown as mean ± SD (n = 3). ns, p > 0.05, ∗p < 0.05, ∗∗p < 0.01, ∗∗∗p < 0.001.
Fig. 4
Fig. 4
SHP2 promotes IL-1β-induced OA-like phenotype and paraptosis in chondrocytes through MAPK pathway activation. (A) Diagram of Venn illustrates the intersection of DEGs from the OA dataset analyzed using the GEO database and GeneCards database (LogFC >0.5 and p value < 0.05). (B) IHC images and quantification of SHP2-positive cells in cartilage (Sham: n = 6; DMM: n = 6, scale bar: 100 μm). (C-F) Staining and analysis of relative levels of COL2A1 and MMP13 expression by IF. (G) Left panel: Light microscopy images of chondrocytes after SHP2 knockdown and 24-h IL-1β treatment. Arrows point to cytoplasmic vacuoles (scale bar: 20 μm). Right panel: at least 100 cells were visually examined to determine the proportion of cells showing vacuoles. (H) Assessment of protein levels in chondrocytes after SHP2 knockdown and IL-1β treatment (10 ng/ml for 24 h). (I) Analysis of protein levels in SHP2-overexpressing chondrocytes pretreated with 5 μM CHX for 4 h, then stimulated with 10 ng/mL IL-1β for 24 h. (J) Analysis of protein levels in SHP2-overexpressing chondrocytes treated with 10 ng/ml IL-1β, alone or with U0126 (10 μM), for 24 h. Data are shown as mean ± SD (n = 3). ns, p > 0.05, ∗p < 0.05, ∗∗p < 0.01, ∗∗∗p < 0.001.
Fig. 5
Fig. 5
IL-1β induces ROS-mediated paraptosis in chondrocytes. (A) Chondrocytes were exposed to 10 ng/ml IL-1β for 24 h, with or without NAC pretreatment (5 mM for 12h), and ROS was measured by DCFH-DA staining and flow cytometry. (B) Quantification of ROS levels as determined by DCFH-DA staining. (C) Effect of NAC on IL-1β-induced protein changes after NAC pretreatment and IL-1β treatment. (D) Left panel: Light microscopy images of chondrocytes treated with 10 ng/ml IL-1β for 24 h, with or without NAC pretreatment. Arrows point to cytoplasmic vacuoles (scale bar: 20 μm). Right panel: at least 100 cells were visually examined to determine the proportion of cells showing vacuoles. (E) Fluorescence and bright-field images of DsRed-ER chondrocytes treated with 10 ng/ml IL-1β, with or without NAC pretreatment (scale bar: 20 μm). (F) Chondrocytes were exposed to 10 ng/ml IL-1β for 24 h after SHP2 overexpression, with or without NAC pretreatment, and ROS was assessed by DCFH-DA staining and flow cytometry. (G) Quantification of ROS levels as determined by DCFH-DA staining. (H) Western blot of indicated protein expression level. Grouping was the same as described in Fig. 5G. Data are shown as mean ± SD (n = 3). ns, p > 0.05, ∗p < 0.05, ∗∗p < 0.01, ∗∗∗p < 0.001.
Fig. 6
Fig. 6
SHP2 knockdown mitigates cartilage degeneration in DMM model animals. (A) Animal experiment schematic diagram. (B) Rat body weight. (CD) IHC staining showing SHP2-positive cells in cartilage (scale bar: 100 μm). (E) CT images of rats that were reconstructed in three dimensions (scale bar: 1 mm). (F) H&E and Safranin O/Fast Green staining of the four experimental groups (scale bar: 500 μm). (G) Quantitative analysis of OARSI scores. (HI) IHC images and quantification of COL2A1-positive area, as well as MMP13-, CHOP-, and Alix-positive cells in knee cartilage of the four groups (scale bar: 100 μm). Data are shown as mean ± SD (n = 6). ns, p > 0.05, ∗p < 0.05, ∗∗p < 0.01, ∗∗∗p < 0.001.
Fig. 7
Fig. 7
LIPUS relieves inflammation in chondrocytes. (A) Western blot of protein expression after 20 min LIPUS treatment following IL-1β (10 ng/ml, 24 h). (B) qPCR of Aggrecan, COL2A1, and MMP13 relative expression level. (CF) Staining and analysis of relative levels of COL2A1 and MMP13 expression by IF. (G) Western blot of indicated protein expression. (H) Protein levels in chondrocytes treated with 10 ng/ml IL-1β and 20 min LIPUS after SHP2 overexpression. (I) Western blot of indicated protein expression. (J) Left panel: Light microscopy images of chondrocytes treated with 10 ng/ml IL-1β for 24 h, followed by 20 min of LIPUS, and observed 24 h later. Arrows point to cytoplasmic vacuoles (scale bar: 20 μm). Right panel: at least 100 cells were visually examined to determine the proportion of cells showing vacuoles. (K) Cell viability of chondrocytes treated with 10 ng/ml IL-1β for 48 h, followed by 20 min of LIPUS, and observed 36 h later. Data are shown as mean ± SD (n = 3). ns, p > 0.05, ∗p < 0.05, ∗∗p < 0.01, ∗∗∗p < 0.001.
Fig. 8
Fig. 8
LIPUS prevents cartilage degeneration in a rat model of post-traumatic OA. (A) Illustration of the animal experiment design. (BC) IHC staining displaying SHP2-positive cells in cartilage (scale bar: 100 μm). (D) 3D CT reconstruction images of rats (scale bar: 1 mm). (E) For the six groups, H&E staining and Safranin O/Fast Green were conducted (scale bar: 500 μm). (F) Quantitative analysis of OARSI scores. (G) IHC staining showing COL2A1-positive area, as well as p-SHP2-, MMP13-, CHOP-, and Alix-positive cells in cartilage across the six groups (scale bar: 100 μm). Data are shown as mean ± SD (n = 6). ns, p > 0.05, ∗p < 0.05, ∗∗p < 0.01, ∗∗∗p < 0.001.

Similar articles

Cited by

References

    1. Allen K.D., Thoma L.M., Golightly Y.M. Epidemiology of osteoarthritis. Osteoarthr Cartil. 2022;30(2):184–195. - PMC - PubMed
    1. Katz J.N., Arant K.R., Loeser R.F. Diagnosis and treatment of hip and knee osteoarthritis: a review. JAMA. 2021;325(6):568–578. - PMC - PubMed
    1. Loeser R.F., Collins J.A., Diekman B.O. Ageing and the pathogenesis of osteoarthritis. Nat Rev Rheumatol. 2016;12(7):412–420. - PMC - PubMed
    1. Peng Z., Sun H., Bunpetch V., Koh Y., Wen Y., Wu D., et al. The regulation of cartilage extracellular matrix homeostasis in joint cartilage degeneration and regeneration. Biomaterials. 2021;268 - PubMed
    1. Tateiwa D., Yoshikawa H., Kaito T. Cartilage and bone destruction in arthritis: pathogenesis and treatment strategy: a literature review. Cells. 2019;8(8) - PMC - PubMed

LinkOut - more resources