. 2025 May 8;109(1):114.
doi: 10.1007/s00253-025-13504-3.

Ethylene glycol metabolism in the oleaginous yeast Rhodotorula toruloides

Affiliations

Ethylene glycol metabolism in the oleaginous yeast Rhodotorula toruloides

Vittorio Giorgio Senatore et al. Appl Microbiol Biotechnol. .

Abstract

The agro-food chain produces an impressive amount of waste, which includes not only lignocellulosic biomass, but also plastic, used for both protective films and packaging. Thanks to advances in enzymatic hydrolysis, it is now possible to imagine an upcycling that valorizes each waste through microbial fermentation. With this goal in mind, we first explored the ability of the oleaginous red yeast Rhodotorula toruloides to catabolize ethylene glycol (EG), obtained by the hydrolysis of polyethylene terephthalate (PET), in the presence of glucose in batch bioreactor experiments. Secondly, we focused on the physiology of EG catabolism in the presence of xylose as a sole carbon source, and in a mixture of glucose and xylose. Our results show that EG is metabolized to glycolic acid (GA) in all tested conditions. Remarkably, we report for the first time that the consumption of EG improves xylose bioprocess, possibly alleviating a cofactor imbalance by regenerating NAD(P)H. Consumption of EG in the presence of glucose started after the onset of the nitrogen limitation phase, while no significant differences were observed with the control; a 100% mol mol-1 yield of GA was obtained, which has never been reported for yeasts. Finally, a putative EG oxidative pathway was proposed by in silico analyses supported with the existing omics data. Our results propose R. toruloides as a promising candidate for the production of GA from EG that could be exploited simultaneously for the sustainable production of microbial oils from residual hemicellulosic biomasses. KEY POINTS: • Ethylene glycol (EG) is not assimilated as a carbon source by Rhodotorula toruloides • With glucose, EG is oxidized to glycolic acid (GA) with a yield of 100% (mol mol-1) • With xylose, EG to GA is associated with improved growth and xylose uptake rate.

Keywords: Rhodotorula toruloides; Ethylene glycol; Glucose; Glycolic acid; Polyethylene terephthalate; Xylose.


Conflict of interest statement

Declarations. Competing interests: The authors declare no competing interests.

Figures

Fig. 1
Fig. 1
Fermentation profiles on glucose, in the presence of ethylene glycol (EG) in shake flasks. (a) Fermentation profiles in the presence of glucose ± EG. The left y-axis shows OD (blue, circles), and glucose (red, triangles) and EG (dark blue, diamonds) concentration in g L−1; the right y-axis shows GA (orange, squares) concentration in g L−1. (b) Growth rates in the presence of glucose ± EG. The y-axis shows the natural logarithm of the OD and the calculated regression line; the slope of the line was used to represent the growth rate. Data corresponding to the control condition (ctrl) have a lighter shade of the color. Glc: glucose. Values are the mean of two independent experiments
Fig. 2
Fig. 2
Quantitative physiology of EG metabolism in the presence of glucose. (a) Fermentation profile of R. toruloides in the presence of glucose and EG. (b) Fermentation profile of R. toruloides in the control condition (no EG). For panels (a) and (b), the left y-axis shows OD (blue, circles), glucose (green, squares) and EG (dark blue, diamonds) concentration in g L−1, and ammonium concentration in mM; the right y-axis shows glycerol (purple, diamonds) and GA (yellow, diamonds) concentration in g L−1. The exponential phase is shaded in gray, while the Nlim phase is shaded with orange; the arrow indicates the time of sampling for total protein and lipid profile analyses. (c) Comparison of specific growth rate and biomass composition in the presence and absence of EG during the Nlim phase. The left y-axis shows the calculated growth rates (μNlim) in h−1 (blue); the right y-axis shows lipid (orange) and protein (yellow) content (% g gCDW−1). (d) Yield of glycolic acid on consumed ethylene glycol (Cmol Cmol−1); the slope of the line is the calculated conversion yield of EG to GA. For panels (a), (b), and (c) only one replicate is shown for clarity, as R. toruloides IFO0880 showed slightly different lag phase durations among replicates; Supplementary Fig. S3, S4, and S5 show the full set of data. For panel (d) values are the mean ± standard deviation of three independent experiments
Fig. 3
Fig. 3
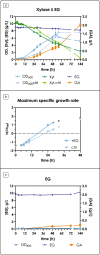
Fermentation profiles on xylose or no carbon source in the presence of ethylene glycol (EG) in shake flasks. (a) Fermentation profiles in the presence of xylose ± EG. The left y-axis shows OD (blue, circles), and xylose (green, triangles) and EG (dark blue, diamonds) concentration in g L−1; the right y-axis shows GA (orange, squares) concentration in g L−1. Data corresponding to the control condition (ctrl) have a lighter shade of the color. Xyl: xylose. Values are the mean of two independent experiments. (b) Growth rates in the presence of xylose ± EG. The y-axis shows the natural logarithm of the OD and the calculated regression line; the slope of the line was used to represent the growth rate. Data corresponding to the control condition (ctrl) have a lighter shade of the color; points that were excluded from the fitting are shaded in gray. (c) Fermentation profile in the presence of EG as the sole carbon source. The left y-axis shows OD (blue, circles), and EG (dark blue, diamonds) concentration in g L−1; the right y-axis shows GA (orange, squares) concentration in g L−1. Values are the mean of two independent experiments
Fig. 4
Fig. 4
Xylose and (proposed) ethylene glycol (EG) metabolism in Rhodotorula toruloides. Xylose catabolism in R. toruloides requires two oxidation and two reduction reactions, which could either be NAD- or NADP-dependent, generating a cofactor imbalance limiting xylose utilization. EG oxidation to glycolic acid (GA) regenerates two equivalents of NAD(P)H for every molecule of EG, thus possibly relieving the cofactor imbalance of xylose catabolism. Two additional pathways are proposed. (1) The intermediate D-xylulose might be phosphorylated to D-xylulose-1P, later cleaved into dihydroxyacetone phosphate (DHAP) and glycolaldehyde (GAH); (2) glyoxylate (GOX) produced from the TCA cycle can be reduced to glycolic acid (GA) in the cytosol and in the mitochondria by GOR1. These hypotheses explain why the obtained yield of GA is greater than 100% mol mol−1 when in presence of xylose. The numbers on the reaction indicate the median of normalized predicted flux of Xyl.EG condition and in parentheses control Xyl condition; when necessary, the compartment of the metabolite is indicated with a subscript (m: mitochondrion; p: peroxisome). All fluxes are available in Supplementary Table S2. XR: xylose reductase; XDH: xylitol dehydrogenase; PFK: phosphofructokinase; FBA1: fructose-bisphosphate aldolase; GOR1: glyoxylate reductase; DHAP: dihydroxyacetone phosphate; PPP: pentose phosphate pathway; RPE: ribulose 5-phosphate 3-epimerase; XK: xylulokinase. Flux values represent model Rt_IFO0880 reactions (alphabetically): AGTim; DABT2D; DABT4D; EX_eg_e; EX_glyclt_e; EX_xyl__D_e; GAPD; GLYCDO1p; GLYCLTt; GLYCLTDy; GLYCLTDxm; GLYCLTt; GLYCLTtm; GLXtp; ICLp, RPE, T_eg; TPI; XYLTD_D; XYLK; XYLR; XYLt. Standard deviation is calculated from random sampling results (n = 2000). Colors of the fluxes represent which cofactor was provided to the simulation (orange: NAD, blue: NADP). Stars along the reaction indicate that multiple genes encode the same enzymatic activity in R. toruloides
Fig. 5
Fig. 5
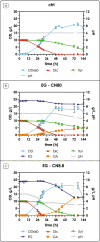
Fermentation profiles on glucose and xylose in the presence of ethylene glycol (EG) in shake flasks. (a) Fermentation profiles in the presence of glucose and xylose (C/N = 80) for the control condition. (b) Fermentation profiles in the presence of glucose and xylose (C/N = 80), and EG. (c) Fermentation profiles in the presence of glucose and xylose (C/N = 8.8), and EG. The left y-axis shows OD (blue, circles), glucose (red, upwards triangles), xylose (green, downwards triangles) and EG (dark blue, diamonds) concentration in g L−1; the right y-axis shows GA (orange, squares) concentration in g L−1 and pH (gray line). Glc: glucose; Xyl: xylose. Values are the mean ± standard deviation of three independent experiments
Fig. 6
Fig. 6
Proposed pathway for ethylene glycol (EG) metabolism in Rhodotorula toruloides. EG is first oxidized to glycolaldehyde (GAH) by alcohol dehydrogenases and/or hydroxysteroid dehydrogenase/isomerase, using NAD(P) as a cofactor. GAH is further oxidized to glycolic acid (GA) by the action of wide spectrum aldehyde dehydrogenases using NAD(P) as a cofactor. GA can be further oxidized to glyoxylate (GOX) by GOR1; the reaction is colored in gray as no flux was observed in this study. The length of the arrows for each reversible reaction suggests the favored product(s). More details can be found in the main text. Adapted from Senatore et al. (2024)

Similar articles

References

    1. Adamczyk PA, Coradetti ST, Gladden JM (2023) Non-canonical d-xylose and l-arabinose metabolism via d-arabitol in the oleaginous yeast Rhodosporidium toruloides. Microb Cell Factories 22:145. 10.1186/s12934-023-02126-x - PMC - PubMed
    1. Bais R, James HM, Rofe AM, Conyers RA (1985) The purification and properties of human liver ketohexokinase. A role for ketohexokinase and fructose-bisphosphate aldolase in the metabolic production of oxalate from xylitol. Biochem J 230:53–60. 10.1042/bj2300053 - PMC - PubMed
    1. Bauer A-S, Tacker M, Uysal-Unalan I, Cruz RMS, Varzakas T, Krauter V (2021) Recyclability and redesign challenges in multilayer flexible food packaging—a review. Foods 10:2702. 10.3390/foods10112702 - PMC - PubMed
    1. Boer H, Andberg M, Pylkkänen R, Maaheimo H, Koivula A (2019) In vitro reconstitution and characterisation of the oxidative D-xylose pathway for production of organic acids and alcohols. AMB Express 9:1–13. 10.1186/s13568-019-0768-7 - PMC - PubMed
    1. Bonturi N, Crucello A, Viana AJC, Miranda EA (2017) Microbial oil production in sugarcane bagasse hemicellulosic hydrolysate without nutrient supplementation by a Rhodosporidium toruloides adapted strain. Process Biochem 57:16–25. 10.1016/j.procbio.2017.03.007

Supplementary concepts

LinkOut - more resources