. 2025 May 8;135(13):e180062.
doi: 10.1172/JCI180062. eCollection 2025 Jul 1.

Thrombospondin-1 inhibits alternative complement pathway activation in antineutrophil cytoplasmic antibody-associated vasculitis

Affiliations

Thrombospondin-1 inhibits alternative complement pathway activation in antineutrophil cytoplasmic antibody-associated vasculitis

Swagata Konwar et al. J Clin Invest. .

Abstract

Complement activation is a relevant driver in the pathomechanisms of vasculitis. The involved proteins in the interaction between endothelia, complement, and platelets in these conditions are only partially understood. Thrombospondin-1 (TSP-1), found in platelet α-granules and released from activated endothelial cells, interacts with factor H (FH) and vWF. However, to our knowledge, direct regulatory interaction with the complement cascade has not yet been described. Our study shows that TSP-1 is a potent, FH-independent inhibitor of the alternative complement pathway. TSP-1 binds to complement proteins and inhibits cleavage of C3 and C5 and the formation of the membrane attack complex. We validated complement-regulatory function in blood samples from patients with primary complement defects. The physiological relevance of TSP-1 was demonstrated in patients with antineutrophil cytoplasmic antibody-associated vasculitis (AAV) by significantly enhanced TSP-1 staining in glomerular lesions and increased complement activity and NETosis after TSP-1 deficiency in an in vitro and in vivo model of AAV. The complement-inhibiting function of TSP-1 represents an important mechanism in the interaction of endothelia and complement. In particular, the interplay between released TSP-1 and the complement system locally, especially on surfaces, influences the balance between complement activation and inhibition and may be relevant in various vascular diseases.

Keywords: Complement; Endothelial cells; Immunology; Inflammation; Vascular biology; Vasculitis.


Figures

Figure 1
Figure 1. TSP-1 has distinct complement regulatory roles compared with TSP-5, protects sheep erythrocytes from complement-mediated hemolysis independent of FH, and binds to central complement proteins of the alternative pathway.
(A) TSP-1 inhibits alternative complement pathway activation in contrast to TSP-5. The alternative complement pathway in NHS was activated on LPS-coated wells and with increasing concentrations of FH, eculizumab, TSP-1, or TSP-5. Platelet-derived TSP-1 (p-TSP-1) was used as an additional control to exclude artifacts caused by the histidine tag used for purification. (B) TSP-1 protects sheep erythrocytes from alternative complement pathway–mediated lysis in the absence of FH. Sheep erythrocytes were incubated with FH-depleted serum and increasing concentrations of FH, TSP-1, or TSP-5. Data are shown as mean ± SD. The alternative complement pathway and hemolytic activity were normalized against untreated control samples. Data were fitted using nonlinear regression. (C) TSP-1 binds to central proteins of the alternative pathway. Complement proteins FH, FB, C3, C5, C6, C7, C8, C9, or BSA were coated on microtiter plates and incubated with recombinant TSP-1. Bound TSP-1 was determined using specific antibodies. (D) Surface plasmon resonance (SPR) Biacore measurements demonstrating the binding of TSP-1 to key proteins of the alternative complement pathway. TSP-1 was immobilized on CM5 chips at a concentration of 0.1 μM. Binding interactions with complement proteins FH, FB, C3, C3b, C5, and C8 were assessed at various concentrations (12.3, 37.03, 111.1, 333.3, 1,000 nM). The binding data were fitted using a 1:1 Langmuir binding model to determine on and off rates, which were then used to calculate affinity constants (Kd). The graph depicts a summary of the binding of complement proteins to TSP-1 at increasing concentrations. Average Kd values, calculated from 3 repeated measurements, are presented in the accompanying table. Data are shown as mean ± SD of 3 independent experiments. ND, not detected.
Figure 2
Figure 2. TSP-1 modulates complement at the C3 and C5 level of the complement cascade.
(A) TSP-1 protects FB from cleavage by FD. FB was incubated with FD, C3b, and varying concentrations of TSP-1. Subsequently, FB and its cleavage products were visualized by Coomassie blue staining. Graph on the right illustrates band intensity of FB and its cleavage products. (B) TSP-1 inhibits cleavage of C3 by the alternative complement pathway C3 convertase. C3 convertase was generated by incubating C3(H2O) with FB and FD, followed by the addition of C3 in the presence or absence of TSP-1 or FH. As a positive control, CVF C3 convertase (CVF + FB + FD) was utilized. The graph on the right depicts the band intensity of C3-α′ chain. Lanes were run on the same gel but were noncontiguous. Data are shown as mean ± SD. (C) TSP-1 inhibits cleavage of C5. Cobra venom factor (CVF) convertase (CVFBb) was generated and added to C5 preincubated with FH, eculizumab, MFHR1, or TSP-1. The amount of released C5a was quantified by ELISA. Data are shown as mean ± SD. ANOVA was used with Dunnett’s multiple-comparison test. (D) TSP-1 inhibits the formation of MAC. Sheep erythrocytes were premixed with C7 (9 nM), C8 (7 nM), and C9 (15 nM). BSA, eculizumab, MFHR1, or TSP-1 (1.3 μM each) were preincubated with C5b-6 (0.7 nM) and then added to the erythrocytes. Data are shown as mean ± SD of 3 independent experiments; **P ≤ 0.01, ***P ≤ 0.01; 1-way ANOVA was used with Tukey’s post hoc test for comparison against control.
Figure 3
Figure 3. TSP-1 inhibits hemolytic activity and pathogenic C3 deposition on endothelial cells when added to the serum of patients with aHUS.
(A) TSP-1 protects sheep erythrocytes from complement-induced lysis in aHUS1 serum. Sheep erythrocytes were incubated with aHUS1 serum and increasing concentrations of FH, TSP-1, or TSP-5. Data were normalized against erythrocytes treated with aHUS1 serum without inhibitors. Data are shown as mean ± SD of 3 independent experiments. (B) Representative fluorescence images of C3 deposits on HMEC-1 cells treated with aHUS sera. HMEC-1 cells were activated with ADP and incubated with 50% normal human serum or aHUS serum with or without 1 μM TSP-1 or FH and stained for C3 deposits. (C) TSP-1 prevents C3 deposition on endothelial cells treated with aHUS sera. Mean fluorescence analysis showed that aHUS2 and aHUS 3 serum caused strong deposition of C3 molecules on HMEC-1, which could be prevented by addition of either FH or TSP-1 into the serum. C3 fluorescence intensity was measured in at least 5 randomly chosen high power fields. Data are shown as mean ± SD of 5 independent experiments. ***P ≤ 0.01; 1-way ANOVA was used with Tukey’s multiple-comparison test. Scale bar: 100 μm.
Figure 4
Figure 4. Knockdown of TSP-1 significantly increases deposition of C3 on activated endothelial cells.
(A) Representative images showing reduced TSP-1 levels and increased C3 deposition in HUVECs after TSP-1 siRNA treatment. Addition of recombinant TSP-1 led to a significant reduction in C3 deposition. (B and C) Analysis of mean fluorescence of TSP-1 and C3 staining intensity on siRNA-treated HUVECs. Data are presented as mean ± SD of 5 independent experiments. (D) qPCR analysis confirming greater than 80% efficiency of TSP-1 knockdown in HUVECs. Data are presented as mean ± SD from 3 independent experiments. (E) VCAM-1 mRNA expression was significantly elevated in TSP-1–deficient cells compared with controls. Data are shown as mean ± SD from 3 independent experiments. (FH) Expression of complement regulatory proteins CD55, CD59, and CD46 was assessed, with no significant changes observed for CD55 and CD59, while CD46 expression showed a nonsignificant trend toward reduction. Data are shown as mean ± SD of 3 independent experiments. *P ≤ 0.05, **P ≤ 0.01, ***P ≤ 0.001; 1-way ANOVA was used with Tukey’s multiple-comparison test. Scale bar: 100 μm.
Figure 5
Figure 5. TSP-1 regulates complement activation in FH-deficient mice.
(A) FH-deficient mice were injected with TSP-1 or PBS (n = 3 each), followed by serial blood sampling and kidney collection for histological analysis. (B) Serum C3 levels increased within 30 minutes after injection, peaked at 6 hours, and remained elevated until 24 hours after injection compared with PBS-treated mice. (C) Representative images of glomerular C3 and analysis of glomerular C3 deposits of FH-deficient mice 24 hours after injection of TSP-1. TSP-1 injection led to a significant reduction in glomerular C3 deposits. Data are shown as mean ± SD; statistical analysis was performed using 2-way ANOVA for plasma C3 concentrations and Student’s t test for analysis of glomerular C3 deposits. *P ≤ 0.05, **P ≤ 0.01, ***P ≤ 0.001. Scale bar: 40 μm.
Figure 6
Figure 6. TSP-1 markedly expressed in glomerular crescents of patients with AAV.
Representative images of TSP-1 IHC staining of kidney biopsies and cancer nephrectomies. Pronounced TSP-1 staining can be seen in glomerular crescents (red dashed lines) of 4 patients with AAV (GN), whereas TSP-1 is absent in unaffected samples of cancer nephrectomies, patients with focal segmental glomerulosclerosis (GS; black dashed lines indicate sclerosis), C3 glomerulopathy (C3G), or diabetic nephropathy (DN). Scale bar: 50 μm.
Figure 7
Figure 7. TSP-1 regulates complement activation and NET formation in an in vitro model of AAV.
(A) Representative live-cell imaging showing NET formation in microfluidic perfusion experiments with HUVECs cultured on μ-slides. Untreated control samples exhibited no NET formation, minimal complement C3 deposition, and low VCAM-1 expression. PMA-treated samples demonstrated robust NET formation with markedly increased C3 deposition and VCAM-1 expression. PR3 antibody treatment alone induced complement C3 deposition without NET formation or increased VCAM-1 expression. PR3 combined with TNF-α triggered significant NET release, increased C3 deposition, and elevated VCAM-1 expression. Recombinant TSP-1 prevented NET formation, reduced C3 deposition, and normalized VCAM-1 expression in PR3- and TNF-α–treated samples. Blocking TSP-1 with an antibody (A6.1) in PR3-treated blood promoted NET formation, increased C3 deposition and VCAM-1 expression; effects were reversed by C5a receptor inhibition with avacopan. (B) Analysis of MFI of complement C3 deposition on HUVECs. (C) Analysis of MFI of VCAM-1 expression on HUVECs. (D) TSP-1 concentrations in supernatants were elevated with PMA and PR3 treatments. A6.1 treatment reduced detectable levels, while recombinant TSP-1 restored physiological levels. (E) Quantification of plasma C5a. C5a levels were significantly increased by PMA, TNF-α, and A6.1 treatment. Avacopan or recombinant TSP-1 reduced C5a concentrations. (F) Quantification of plasma histone DNA complexes. Increased amounts of DNA-histone complexes were detected in samples treated with PMA, TNF-α, and A6.1; treatment with recombinant TSP-1 or avacopan reduced DNA-histone complexes. Data are shown as mean ± SD of 3 independent experiments. *P ≤ 0.05, **P ≤ 0.01, ***P ≤ 0.001, NS, not significant; 1-way ANOVA was used with Tukey’s multiple-comparison test. Scale bar: 100 μm.
Figure 8
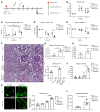
Figure 8. The lack of TSP-1 aggravates renal injury in a mouse model of AAV.
(A) Experimental setup for murine model of AAV using TSP-1-KO and WT mice. On day 0, mice were immunized with hMPO and 10 days later injected with NTS. Blood was collected on day -7 and day 11; mice were euthanized on day 14. (B) Mice demonstrated significantly increased C5a levels and developed MPO antibodies (C), confirming disease induction. Data were normalized to day –7 (n = 3). (D) Plasma albumin levels showed more severe hypoalbuminemia in TSP-1-KO mice compared to WT mice at day 14. Data were normalized to day –7 (n = 3). (E) Serum creatinine levels were significantly reduced in TSP-1-KO mice compared with controls (n = 3). (F) Representative images of PAS-stained kidney sections from WT and TSP-1-KO mice. Mice developed fibrinoid necrosis and proteinaceous casts (asterisks). Glomeruli show thickening of capillary walls, parietal epithelial cell (PEC) activation (arrowheads), and capillary thrombi (arrows). (G) Quantification of glomeruli with fibrinoid necrosis shows significantly higher injury in TSP-1-KO mice compared with WT (n = 3). (H) TSP-1-KO mice trend toward greater PEC activation, precursor to crescent formation (n = 3). (I) Plasma TSP-1 levels were significantly increased in hMPO/NTS-treated WT mice, similar to AAV patients (n ≥ 2). (J) C3 levels in kidney lysates of hMPO/NTS-treated TSP-1-KO mice were significantly increased compared to WT mice (n ≥ 2). (K) Representative images and analysis of glomerular C3 deposition demonstrating significantly increased C3 deposits in hMPO/NTS-treated TSP-1-KO mice compared to WT mice (n ≥ 2). Scale bar: 40 μm. (L) Citrullinated histone levels were significantly higher in hMPO/NTS-treated TSP-1-KO mice, suggesting enhanced NET formation. Data are shown as mean ± SD. Statistical analysis by Student’s t test, *P < 0.05, **P < 0.01. ND, not detected.
Figure 9
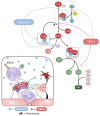
Figure 9. Summary of TSP-1 effects on the alternative pathway and physiological significance.
Complement inhibitory functions of TSP-1 in comparison to FH are schematically illustrated: TSP-1 prevents cleavage of FB by FD in vitro, although binding to FB has not been confirmed by SPR and therefore not physiologically relevant (dashed line). TSP-1 binds to C3 and prevents the cleavage of C3 into C3a and C3b. Furthermore, TSP-1 binds to C5 and prevents its cleavage into C5a and C5b and the formation of MAC. Possible physiological and pathophysiological complement regulatory functions of TSP-1 in AAV: secondary complement activation in AAV due to neutrophil activation, NETosis, and subsequent vasculitis. In these local overwhelming conditions, inhibition by FH might not be sufficient to control complement activation. Therefore, additional complement inhibitory functions by locally released TSP-1 from endothelia and/or thrombocytes could be physiologically relevant regarding control of excessive complement activation, especially on surfaces.

References

    1. Adams JC, Lawler J. The thrombospondins. Cold Spring Harb Perspect Biol. 2011;3(10):a009712. doi: 10.1101/cshperspect.a009712. - DOI - PMC - PubMed
    1. Dubernard V, et al. Evidence for an alpha-granular pool of the cytoskeletal protein alpha-actinin in human platelets that redistributes with the adhesive glycoprotein thrombospondin-1 during the exocytotic process. Arterioscler Thromb Vasc Biol. 1997;17(10):2293–2305. doi: 10.1161/01.ATV.17.10.2293. - DOI - PubMed
    1. Tuszynski GP, Nicosia RF. The role of thrombospondin-1 in tumor progression and angiogenesis. Bioessays. 1996;18(1):71–76. doi: 10.1002/bies.950180113. - DOI - PubMed
    1. Wight TN, et al. Light microscopic immunolocation of thrombospondin in human tissues. J Histochem Cytochem. 1985;33(4):295–302. doi: 10.1177/33.4.3884704. - DOI - PubMed
    1. Leung LL. Role of thrombospondin in platelet aggregation. J Clin Invest. 1984;74(5):1764–1772. doi: 10.1172/JCI111595. - DOI - PMC - PubMed

MeSH terms