. 2025 May 8;10(12):e180275.
doi: 10.1172/jci.insight.180275. eCollection 2025 Jun 23.

Multiomics analysis unveils an inosine-sensitive DNA damage response in neurogenic bladder after spinal cord injury

Affiliations

Multiomics analysis unveils an inosine-sensitive DNA damage response in neurogenic bladder after spinal cord injury

Ali Hashemi Gheinani et al. JCI Insight. .

Abstract

Spinal cord injury (SCI) evokes profound dysfunction in hollow organs such as the urinary bladder and gut. Current treatments are limited by a lack of molecular data to inform novel therapeutic avenues. Previously, we showed that systemic treatment with the neuroprotective agent inosine improved bladder function following SCI in rats. Here, we applied integrated multi-omics analysis to explore molecular alterations in the bladder over time and their sensitivity to inosine following SCI. Canonical signaling pathways regulated by SCI included those associated with protein synthesis, neuroplasticity, wound healing, and neurotransmitter degradation. Upstream regulator and causal network analysis predicted multiple effectors of DNA damage response signaling following injury, including poly-ADP ribose phosphorylase-1 (PARP1). Markers of DNA damage (γH2AX, ATM/ATR substrates) and PARP activity were increased in bladder tissue following SCI and attenuated with inosine treatment. Inosine treatment also attenuated oxidative DNA damage in rat bladder cells in vitro. Proteomics analysis suggested that SCI induced changes in protein synthesis-, neuroplasticity-, and oxidative stress-associated pathways, a subset of which were shown in transcriptomics data to be inosine sensitive. These findings provide insights into the molecular landscape of the bladder following SCI and identify key inosine-sensitive pathways associated with injury.

Keywords: Bioinformatics; Cell biology; DNA repair; Muscle biology; Urology.


Figures
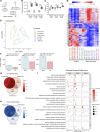
Figure 1
Figure 1. Effect of spinal cord injury over time on the transcriptome of the bladder.
(A) Experimental design. (B and C) Bladder/body weight measurement (B) and measurement of collagen deposition from MTS-stained sections (C). Significance was determined by 1-way ANOVA followed by Tukey’s multiple comparisons test. *P < 0.05, n = 6–7 replicates. (D) Heatmap and hierarchical clustering using top 500 DEGs in different comparisons groups; log2 greater than +0.05 and less than –0.05 (> ±0.05); P < 0.05; read counts > 1,000. (E) PCA based on count matrix of all genes. (F) Bar charts indicating up- and downregulated DEGs at each time point. (G and H) Venn diagrams of upregulated and downregulated DEGs at each time point following SCI compared with their respective controls. (I) Enrichment analysis of DEGs from each time point of SCI using gene ontology (GO) terms for biological process (BP).
Figure 2
Figure 2. Effect of spinal cord injury and inosine treatment on transcriptome of bladder.
(A) Experimental design. (B) Bladder/body weight measurement. Significance was determined by 1-way ANOVA followed by Tukey’s multiple comparisons test. *P < 0.05, n = 10–13 replicates. (C) Heatmap and hierarchical clustering using DEGs in different comparisons groups; log2 fold change> ± 0.5; P < 0.05; read counts cpm > 1. (D) PCA based on top 200 variable genes. (E and F) Bar charts indicating up-, down-, and nonregulated DEGs in detrusor (E) or mucosa (F) across 3 comparisons: SCI-vehicle versus Control; SCI-inosine versus Control; SCI-inosine versus SCI-vehicle. Red circle (upper Venn diagram): genes upregulated in detrusor in SCI-vehicle versus Control (541 + 510 = 1,051 [red bar in graph]). Blue circle (lower Venn diagram): genes downregulated in detrusor in SCI-vehicle versus Control (227 + 304 = 531 [blue bar in graph]). Gray circles: genes not differentially regulated in SCI-inosine versus Control (510 + 10,924 = 11,434, upper Venn diagram; 304 + 11,130 = 11,434, lower Venn diagram [gray bar in graph]). (F) Red circle (upper Venn diagram): genes upregulated in mucosa in SCI-vehicle versus Control (24 + 172 =[196 (red bar in graph]). Blue circle (lower Venn diagram): genes down-regulated in mucosa in SCI-vehicle versus Control (46 + 322 = 368 [blue bar in graph]). Gray circles: genes not differentially regulated in SCI-inosine versus Control (172 + 12,715 = 12,887, upper Venn Diagram and 322 + 12,565 = 12,887, lower Venn diagram). Genes shared between the red/blue circles and gray circles in the Venn diagrams were considered inosine-sensitive — i.e., dysregulated — in SCI-vehicle versus Control and returned to control expression levels in SCI-inosine versus Control. This revealed 510 upregulated and 304 downregulated genes in detrusor and 172 upregulated and 322 downregulated genes in mucosa that were restored to control levels by inosine. Inosine-sensitive genes in the detrusor and the mucosa were compared via Venn diagrams in the central panels to identify those that were modulated by inosine in both tissue compartments.
Figure 3
Figure 3. Regulated canonical pathways inferred by IPA in detrusor.
(A) Bar chart of top 30 regulated pathways in detrusor of SCI-vehicle versus Control. (B) Word cloud of most frequent genes regulated and enriched in the regulated pathways. (C) Circos plot of top 2 pathways (based on P value) and enriched genes. (D) Bar chart visualizing the frequency of enrichment of top 20 enriched genes in pathways. (E) Bar chart of top 30 regulated pathways in detrusor of SCI-inosine versus SCI-vehicle. (F) Word cloud of most frequent genes regulated and enriched in the regulated pathways. (G) Circos plot of top 2 pathways (based on P value) and enriched genes. (H) Bar chart visualizing the frequency of enrichment of top 20 enriched genes in pathways. (I) Bar chart of top 30 regulated pathways in detrusor of SCI-inosine versus Control. (J) Word cloud of most frequent genes regulated and enriched in the regulated pathways. (K) Circos plot of top 2 pathways (based on P value) and enriched genes. (L) Bar chart visualizing the frequency of enrichment of top 20 enriched genes in pathways.
Figure 4
Figure 4. Regulated canonical pathways inferred by IPA in mucosa.
(A) Bar chart of top 30 regulated pathways in mucosa of SCI-vehicle versus Control. (B) Word cloud of most frequent genes regulated and enriched in the regulated pathway. (C) Circos plot of top 2 pathways (based on P value) and enriched genes. (D) Bar chart visualizing the frequency of enrichment of top 20 enriched genes in pathways. (E) Bar chart of top 30 regulated pathways in mucosa of SCI-inosine versus SCI-vehicle. (F) Word cloud of most frequent genes regulated and enriched in the regulated pathways. (G) Circos plot of top 2 pathways (based on P value) and enriched genes. (H) Bar chart visualizing the frequency of enrichment of top 20 enriched genes in pathways. (I) Bar chart of top 30 regulated pathways in mucosa of SCI-inosine versus Control. (J) Word cloud of most frequent genes regulated and enriched in the regulated pathway. (K) Circos plot of top 2 pathways (based on P value) and enriched genes. (L) Bar chart visualizing the frequency of enrichment of top 20 enriched genes in pathways.
Figure 5
Figure 5. Effect of inosine on regulated canonical pathways inferred by IPA.
(A and B) Bar charts showing effect of inosine on regulated canonical pathways in detrusor (A) and mucosa (B) as inferred by IPA. Red, SCI-vehicle versus Control; green, SCI-inosine versus SCI-vehicle; yellow, SCI-inosine versus Control. Thresholds for this analysis were set at Pathways –log10 (P value) cut-off ≤ 1.30 and pathway z score cut-off ≥ |1|.
Figure 6
Figure 6. Causal network analysis of transcriptomic data from detrusor and mucosa.
(A) Bar chart showing causal network analysis in detrusor of SCI rats treated with vehicle compared with uninjured controls (SCI-vehicle versus Control [8 weeks]) highlighting inosine as the most significantly downregulated endogenous chemical. (B) Bar chart showing causal network analysis in mucosa of SCI rats treated with vehicle compared with uninjured controls (SCI-vehicle versus Control [8 weeks]) highlighting sphingosine-1-phosphate as the most significantly downregulated endogenous chemical. Red bars indicate endogenous chemicals with a positive z score that are predicted active. Blue bars indicate endogenous chemicals with a negative z score that are predicted to be inactive. (C) Predicted network of top endogenous chemicals and downstream targets (23) in the detrusor of SCI-vehicle rats versus Control. (D) Predicted network of top endogenous chemical and the downstream targets (39) in the mucosa of SCI-vehicle rats versus Control.
Figure 7
Figure 7. Immunostaining for causal network and pathway validation.
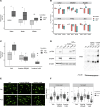
(A, D, and G) Bladder sections from SCI and Control rats were stained for phosphorylated histone H2AX (γH2AX) (green) and SM22a (red) (A), poly/mono ADP Ribosylation (PAR) (red) and pan cytokeratin (Pan-Ck) (green) (D), or pATM-substrates (pATM-sub) (red) and pan-cytokeratin (Pan-Ck) (green) (G). Nuclei were visualized with DAPI (magnification, 20×). White dashed rectangles indicate regions of tissue visualized at 100×. Images were analyzed with ImageJ-based macro outlined in Supplemental Figure 13 that quantified nuclear staining for the markers of interest. (B, E, and H) Quantification of percentage of positive nuclei for each DNA damage–associated marker. (C, F, and I) Quantification of the nuclear signal intensity for each DNA damage–associated marker. A total of 5–15 fields of view were captured at 20× with > 5,000 nuclei represented for each of 3 biological replicates per condition. Significance was determined by 1-way ANOVA followed by Tukey’s multiple comparisons test. Adjusted P values were used to report the significance of the differences. *P < 0.05, **P < 0.01, versus control. #P < 0.05, ##P < 0.01, versus SCI.
Figure 8
Figure 8. In vitro validation of oxidative DNA damage and its sensitivity to inosine.
(A) Protein lysates of bladders harvested from rats at 2, 8, or 16 weeks following SCI or age-matched controls were assessed for malondialdehyde (MDA), a measure of lipid peroxidation (n = 3 biological replicates). (B) Expression of DNA damage–related genes in bladder tissue collected at the indicated times was assessed via qPCR (n = 4–6 biological replicates). (C) MDA was assessed in rat bladder fibroblasts treated ± H2O2 or PBS ± indicated doses of inosine (n = 3 biological replicates). (D) Immunoblot analysis of DNA damage–associated markers including phospho-ATM serine/threonine kinase (pATM), γH2AX, and Poly/Mono ADP Ribosylation (PAR) in rat bladder fibroblasts treated ± H2O2 or PBS ± indicated doses of inosine. (E) DNA damage was assessed by comet assay using rat bladder fibroblasts stimulated with 50 μM H2O2 ± indicated doses of inosine. Magnification, 20×. (F) Comet assay quantification, with 100–200 nuclei assessed for each condition. Data are representative of 3 independent trials. Significance was determined by 1-way ANOVA followed by Tukey’s multiple comparisons test. Adjusted P values were used to report the significance of the differences. *P < 0.05, **P < 0.01, versus control (Veh). #P < 0.05, ##P < 0.01, versus H2O2 50μM. $P < 0.05, $$P < 0.01, versus 1 mM inosine. &P < 0.05, versus 250 μM inosine.
Figure 9
Figure 9. Regulated canonical pathways inferred by IPA of proteomics data.
(A) Bar chart of top 30 regulated pathways in full-thickness bladder tissue at 8 weeks after SCI compared with age-matched controls. (B) Word cloud of most frequent proteins regulated and enriched in the regulated pathways. (C) Bar chart showing the frequency of top 20 most recurrent protein enriched in pathways. (D) Circos plot of top 5 most recurrent enriched proteins in the regulated pathways and the corresponding regulated pathways.

References

    1. Sezer N, et al. Chronic complications of spinal cord injury. World J Orthop. 2015;6(1):24–33. doi: 10.5312/wjo.v6.i1.24. - DOI - PMC - PubMed
    1. Wyndaele JJ. The management of neurogenic lower urinary tract dysfunction after spinal cord injury. Nat Rev Urol. 2016;13(12):705–714. doi: 10.1038/nrurol.2016.206. - DOI - PubMed
    1. Cameron AP. Medical management of neurogenic bladder with oral therapy. Transl Androl Urol. 2016;5(1):51–62. - PMC - PubMed
    1. Fusco F, et al. Progressive bladder remodeling due to bladder outlet obstruction: a systematic review of morphological and molecular evidences in humans. BMC Urol. 2018;18(1):15. doi: 10.1186/s12894-018-0329-4. - DOI - PMC - PubMed
    1. Macarak EJ, et al. The collagens and their urologic implications. Adv Exp Med Biol. 1995;385:173–177. - PubMed

MeSH terms