. 2025 May 8;20(5):e0323222.
doi: 10.1371/journal.pone.0323222. eCollection 2025.

Sex differences in alcohol inhibits bone formation and promotes bone resorption in young male and female rats by altering intestinal flora, metabolites, and bone microenvironment

Affiliations

Sex differences in alcohol inhibits bone formation and promotes bone resorption in young male and female rats by altering intestinal flora, metabolites, and bone microenvironment

Ming Cheng et al. PLoS One. .

Abstract

Background: Long-term alcohol intake has toxic effects on osteoblasts and osteoclasts, resulting in decreased bone density, which directly disrupts the composition of the gut microbiota and affects bone metabolism and immune activity. The effects of alcohol on the bones may be closely related to sex. This study investigated the effects of long-term alcohol consumption on bone status in different sexes by examining the gut microbiota, bone metabolism, and immune activity.

Methods: Young male and female rats were administered a Bio-Serv liquid diet containing 5% alcohol. The effects of alcohol metabolism capacity, bone morphology, bone formation, bone resorption, bone marrow immune activity, gut microbiota, and metabolite differences were analyzed in male and female rats using hematoxylin and eosin staining, micro-computed tomography, enzyme-linked immunosorbent assay, western blotting, 16S rRNA sequencing, and untargeted metabolomics.

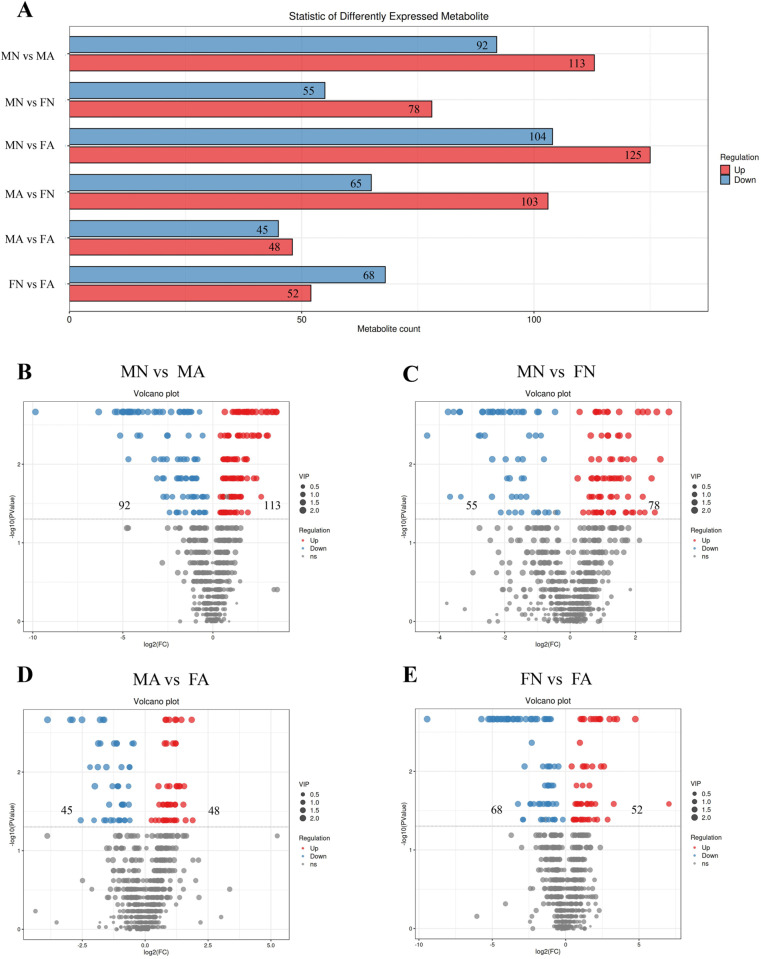
Results: Chronic alcohol consumption resulted in excessive osteoclast activation and decreased bone mineral density. Furthermore, alcohol reduced bone metabolism and formation while increasing bone resorption. Bone loss was significantly more severe in female rats than in male rats, indicating that the effects of alcohol on rat bones are related to sex. Chronic alcohol consumption also led to polarization of bone marrow immunoreactivity toward the M1 phenotype. In addition, chronic alcohol consumption affected the composition of gut microbiota, reduced the richness and diversity of intestinal microbiota, and decreased the ratio of Firmicutes/Bacteroidetes. Long-term alcohol consumption also affected fecal metabolites, and 754 differentially expressed metabolites were identified.

Conclusions: Chronic alcohol consumption increased bone resorption, inhibited bone formation, and affected bone marrow immunoreactivity in young male and female rats. Alcohol can also affect gut microbiota composition and fecal metabolism. Female rats were more susceptible to alcohol, possibly because young female rats have a lower alcohol metabolism, immunomodulatory capacity, and gut microbiota diversity than young male rats.


Conflict of interest statement

The author(s) declare no competing interests.

Figures

Fig 1
Fig 1. Effects of alcohol on bone morphology and alcohol metabolism ability in female and male rats.
(A) TRAP staining image of femur with green arrows indicate osteoclasts. Scale bar: 50 μm, 400 × . (B) Number of osteoclasts observed with TRAP staining in different groups. Two-way ANOVA of osteoclasts number: sex effect p = 0.264, alcohol effect p = 0.001, no significant sex-by-alcohol interaction (p = 0.203). (C) H&E staining image of femur. Green arrows indicate thinning of bone trabecula, yellow arrows indicate decreased bone marrow hematopoietic cells. Scale bar: 50 μm, 400 × . (D) 2D (scale bar: 1 mm) and 3D (scale bar: 1 mm) images of femur Micro-CT scan. Changes of alcohol metabolism indexes ADH (E) and ALDH (F) contents after long-term alcohol intake. Two-way ANOVA of ADH: sex effect p = 0.022, alcohol effect p = 0.000, with significant sex-by-alcohol interaction (p = 0.015). Two-way ANOVA of ALDH: sex effect p = 0.019, alcohol effect p = 0.000, no significant sex-by-alcohol interaction (p = 0.159). Date are shown as mean ± SD (n = 6). *p < 0.05, **p < 0.01, ***p < 0.001.
Fig 2
Fig 2. Effect of alcohol on bone resorption and bone formation in female and male rats.
(A) Changes of BALP levels in different groups. Two-way ANOVA of BALP: sex effect p = 0.000, alcohol effect p = 0.000, no significant sex-by-alcohol interaction (p = 0.169). (B) Changes of TRAP-5b levels in different groups. The levels of TRAP-5b are commonly used in the evaluation of bone resorption. Two-way ANOVA of TRAP-5b: sex effect p = 0.002, alcohol effect p = 0.000, with significant sex-by-alcohol interaction (p = 0.005). (C) Long-term alcohol consumption decreased OCN levels in male and female rats, indicating reduced bone formation in the femur. Two-way ANOVA of OCN: sex effect p = 0.004, alcohol effect p = 0.000, with significant sex-by-alcohol interaction (p = 0.002). (D) The CT levels decreased after drinking, indicating increased osteoclast activity. Two-way ANOVA of CT: sex effect p = 0.005, alcohol effect p = 0.000, with significant sex-by-alcohol interaction (p = 0.002). (E) The levels of OPG decreased after long-term alcohol consumption, indicating enhanced bone resorption. Two-way ANOVA of OPG: sex effect p = 0.038, alcohol effect p = 0.000, with significant sex-by-alcohol interaction (p = 0.047). (F) The levels of IGF-1 were detected by ELISA. Two-way ANOVA of IGF-1: sex effect p = 0.057, alcohol effect p = 0.000, no significant sex-by-alcohol interaction (p = 0.162). The contents of Ca (G) and P (H) also decreased with alcohol intake. Two-way ANOVA of Ca: sex effect p = 0.086, alcohol effect p = 0.000, no significant sex-by-alcohol interaction (p = 0.205). Two-way ANOVA of P: sex effect p = 0.159, alcohol effect p = 0.000, no significant sex-by-alcohol interaction (p = 0.309). Date are shown as mean ± SD (n = 6). *p < 0.05, **p < 0.01, ***p < 0.001.
Fig 3
Fig 3. Effect of alcohol on bone marrow immune activity in female and male rats.
(A) The proportion of CD80 + and CD206 + cells in the bone marrow was analyzed by flow cytometry. (B) The numbers of CD80 + cells were significantly higher in the male and female alcohol-treated groups than in the normal group; while the numbers of CD206 + cells were significantly lower. Two-way ANOVA of CD80 + : sex effect p = 0.000, alcohol effect p = 0.065, with significant sex-by-alcohol interaction (p = 0.002). Two-way ANOVA of CD206 + : sex effect p = 0.464, alcohol effect p = 0.065, with significant sex-by-alcohol interaction (p = 0.004). (C) Quantitative analysis of the ratio of CD80 + /CD206 + . Two-way ANOVA of CD80 + /CD206 + : sex effect p = 0.000, alcohol effect p = 0.000, no significant sex-by-alcohol interaction (p = 0.382). (D) The protein expression of polarization markers of M1/M2 macrophages in bone marrow was detected by WB analysis. (E-H) The quantification of WB analysis of iNOS, COX-2, CD163, and Arg-1. Two-way ANOVA of iNOS: sex effect p = 0.065, alcohol effect p = 0.000, no significant sex-by-alcohol interaction (p = 0.182). Two-way ANOVA of COX-2: sex effect p = 0.105, alcohol effect p = 0.000, no significant sex-by-alcohol interaction (p = 0.067). Two-way ANOVA of CD163: sex effect p = 0.023, alcohol effect p = 0.000, no significant sex-by-alcohol interaction (p = 0.129). Two-way ANOVA of Arg-1: sex effect p = 0.429, alcohol effect p = 0.002, no significant sex-by-alcohol interaction (p = 0.467). Date are shown as mean ± SD (n = 6). *p < 0.05, **p < 0.01, ***p < 0.001.
Fig 4
Fig 4. Effect of alcohol on gut microflora in female and male rats.
(A) PCoA analysis of beta diversity by Bray-Curtis distance. (B) Venn diagram of ASV/OTU of samples. (C) The composition of the intestinal microbiota of all samples at the phylum levels. (D) The composition of the intestinal microbiota at the genus level. n = 6. ASV: amplicon sequence variants; OUT: operational taxonomic units.
Fig 5
Fig 5. Multivariate statistical analysis of gut microbiota metabolites data in positive and negative ion mode.
(A-B) OPLS-DA analysis in positive and negative ion mode. The more clustered the samples within groups, the more dispersed the samples between groups, indicating more reliable results. (C-D) OPLS-DA score plot in positive and negative ion mode. Metabolites closer to two corners are more important.
Fig 6
Fig 6. Identification of fecal differential metabolites in each group.
(A) Statistical bar chart of different metabolites in MN vs MA, MN vs FN, MA vs FA, FN vs FA, respectively. (B-E) Volcano plot of differential metabolites in MN vs MA groups, MN vs FN groups, MA vs FA groups, FN vs FA groups, respectively. Red dots represent up-regulated differentially expressed metabolites and blue dots represent down-regulated differentially expressed metabolites.
Fig 7
Fig 7. Bubble diagram of differential metabolic pathway influencing factors.
(A) MN vs MA groups; (B) MN vs FN groups; (C) MA vs FA groups; (D) FN vs FA groups. P-value represents the effect of detected differential metabolites on this pathway, and impact represents the contribution of metabolites detected under this pathway.

References

    1. Luo Z, Liu Y, Liu Y, Chen H, Shi S, Liu Y. Cellular and molecular mechanisms of alcohol-induced osteopenia. Cell Mol Life Sci. 2017;74(24):4443–53. doi: 10.1007/s00018-017-2585-y - DOI - PMC - PubMed
    1. Ryan CS, Petkov VI, Adler RA. Osteoporosis in men: the value of laboratory testing. Osteoporos Int. 2011;22(6):1845–53. doi: 10.1007/s00198-010-1421-0 - DOI - PubMed
    1. Maurel DB, Boisseau N, Benhamou CL, Jaffre C. Alcohol and bone: review of dose effects and mechanisms. Osteoporos Int. 2012;23(1):1–16. doi: 10.1007/s00198-011-1787-7 - DOI - PubMed
    1. Cheraghi Z, Doosti-Irani A, Almasi-Hashiani A, Baigi V, Mansournia N, Etminan M, et al.. The effect of alcohol on osteoporosis: A systematic review and meta-analysis. Drug Alcohol Depend. 2019;197:197–202. doi: 10.1016/j.drugalcdep.2019.01.025 - DOI - PubMed
    1. Jugdaohsingh R, O’Connell MA, Sripanyakorn S, Powell JJ. Moderate alcohol consumption and increased bone mineral density: potential ethanol and non-ethanol mechanisms. Proc Nutr Soc. 2006;65(3):291–310. doi: 10.1079/pns2006508 - DOI - PubMed

MeSH terms

LinkOut - more resources