. 2025 May;21(5):e70046.
doi: 10.1002/alz.70046.

Hyperactivation of RAB5 disrupts the endosomal Rab cascade leading to endolysosomal dysregulation in Down syndrome: A necessary role for increased APP gene dose

Affiliations

Hyperactivation of RAB5 disrupts the endosomal Rab cascade leading to endolysosomal dysregulation in Down syndrome: A necessary role for increased APP gene dose

Xu-Qiao Chen et al. Alzheimers Dement. 2025 May.

Abstract

Introduction: Down syndrome (DS) markedly increases the risk of Alzheimer's disease (DS-AD), but the role of RAB5 hyperactivation in its pathogenesis remains unclear.

Methods: Postmortem brain samples from individuals with DS, with and without AD, and a partial trisomy 21 case with only two amyloid precursor protein (APP) gene copies, were examined for endosomal Rabs, their guanine-nucleotide exchange factor (GEF) and GTPase activating protein (GAP) levels, and lysosomal cathepsins. Analysis extended to the Dp16 DS mouse model. The role of RAB5 hyperactivation in disrupting the endolysosomal system was explored using primary neurons.

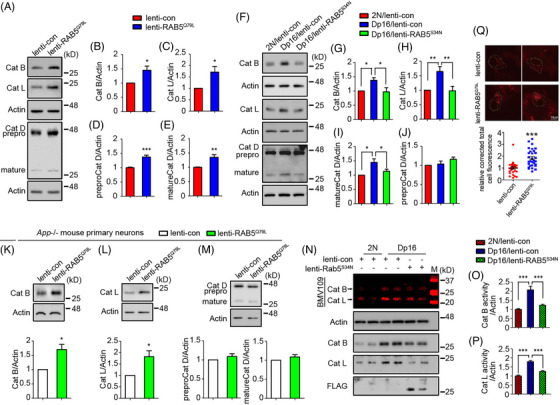
Results: We observed widespread endolysosomal dysregulation in DS and Dp16 brains, requiring increased APP gene dose. RAB5 hyperactivation resulted in increased activation of endosomal Rabs, including RABs 7 and 11, and increased recruitment of Rabs and their GEFs to early endosomes as well as the levels of lysosomal cathepsins.

Discussion: These findings suggest that APP dose-driven RAB5 hyperactivation disrupts endosomal Rab cascades and endosome maturation in DS.

Highlights: There is widespread disruption of the endolysosomal network in the Down syndrome (DS) brain and in the Dp16 mouse model brain. Amyloid precursor protein (APP) gene dose was necessary for increases in endosomal Rab activity and lysosomal cathepsins in both human and mouse brains. Changes in endosomal Rabs 7 and 11 were linked to increases in their guanine-nucleotide exchange factors (GEFs) and GEF/GTPase activating protein (GAP) ratios. Mechanistic studies demonstrated essential roles for the beta-C-terminal fragment (β-CTF) of APP acting through hyperactivation of RAB5 to increase early endosomal membrane binding of the GEFs for downstream endosomal Rabs. RAB5 acts as the central hub for disruptions in endolysosomal function in DS.

Keywords: APP; Alzheimer's disease; Dp16 mouse; GEF; RAB5; cathepsin; down syndrome; endosomal rab cascade.


Conflict of interest statement

W.C.M. serves as a Scientific Advisory Board (SAB) member and holds stock options from Alzheon, Inc. and Promis, Inc. W.C.M. also serves as an SAB member and holds stock in Acta Pharmaceuticals, Inc. His name is on a patent under University of California San Diego and Massachusetts General Hospital concerning γ‐secretase modulators licensed to Acta Pharmaceuticals, Inc. He has served as a consultant to AC Immune. W.C.M. holds a leadership position in the Trisomy 21 Research Society. He serves on committees for the Alzheimer's Project San Diego and the American Neurological Association and an NIH COBRE Grant to the University of Nebraska. W.C.M. received a royalty payment under a patent held by Stanford University licensed to Curasen. Author disclosures are available in the Supporting Information.

Figures

FIGURE 1
FIGURE 1
Widespread hyperactivation of endosomal Rabs in DS‐AD frontal cortex. (A) Western blot analysis of the levels of different Rabs in protein extracts from the frontal cortex of patients with DS‐AD and C/DS‐AD. β‐Actin was used as a loading control. (B–G) Quantitative analysis and statistical comparison of Rab levels in combined, female, and male samples from DS‐AD and C/DS‐AD groups. (H) The relative mRNA levels of different Rabs in the frontal cortex of DS‐AD and C/DS‐AD were assessed by qPCR. ACTB mRNA was used as an internal control. (I) GTP agarose pull‐down assay was used to measure the activities of RABs 5, 4, 7, and 11 in the frontal cortex of DS‐AD and C/DS‐AD. (J–M) Quantitative analysis and statistical comparison of the activities of different Rabs in DS‐AD and C/DS‐AD groups. (N) The activities of RABs 10 and 3 were measured in the frontal cortex of DS‐AD and C/DS‐AD. (O, P) Quantitative analysis and statistical comparison of the activities of RABs 10 and 3 in DS‐AD and control groups. Mann–Whitney U test; F, female; M, male; n = 18 for C/DS‐AD (F: 9, M: 9), n = 16 for DS‐AD (F: 9, M: 7) for A to G; n = 10 for C/DS‐AD, n = 8 for DS‐AD for H; n = 12 for C/DS‐AD (F: 6, M: 6), n = 13 for DS‐AD (F: 4; M: 9) in I to P; *p < 0.05, **p < 0.01, ***< 0.001. AD, Alzheimer's disease; C/, control for; DS, Down syndrome; mRNA, messenger RNA; qPCR, quantitative polymerase chain reaction.
FIGURE 2
FIGURE 2
Selective alterations of the GEFs of endosomal Rabs in DS‐AD frontal cortex. The levels of GEFs/GAPs of RAB5 (A–E), RAB7 (A, F–I), RAB11 (A, J–L), and RAB3 (A, M–P) were measured in the frontal cortex of DS‐AD and C/DS‐AD. Quantitation and statistical analysis were displayed on the right panels. (Q, R) The levels of other GAPs TBC1D11 and TBC1D5 were also analyzed in these samples. (S) The mRNA levels of CCZ1 and SH3BP5 in the frontal cortex of DS‐AD and C/DS‐AD were assessed by qPCR. Mann–Whitney U test; F, female; M, male; n = 18 for C/DS‐AD (F: 9, M: 9), n = 16 for DS‐AD (F: 9, M: 7) for A to R; n = 10 for C/DS‐AD, n = 8 for DS‐AD for S; *p < 0.05, **p < 0.01, ***p < 0.001. AD, Alzheimer's disease; C/, control for; DS, Down syndrome; GAP, GTPase‐activating protein; GEF, guanine‐nucleotide exchange factor; mRNA, messengaer RNA, qPCR, quantitative polymerase chain reaction.
FIGURE 3
FIGURE 3
APP‐dependent endosomal Rab hyperactivation and GEF increase in Dp16 brains. (A) The levels of GTP‐loaded RABs 5, 4, 7, and 11, and total Rabs were assayed in brain homogenates from 16‐month‐old 2N, Dp16, and Dp16: App+/+/‐  mice. (B–D) Quantitation and statistical analysis of the levels of APP, β‐CTF, and DYRK1A in the same mice. (E–L) Quantitation and statistical analysis of the GTP‐Rabs (E–H) and total Rabs (I–L) levels. (M) GTP‐RAB10 and total RAB10 levels were assayed in brain homogenates from 16‐month‐old 2N, Dp16, and Dp16: App+/+/‐ mice. Quantitation and statistical analysis are shown in the lower panels (N, O). (P) The levels of CCZ1 and SH3BP5 were measured in the brain homogenates from 16‐month‐old 2N, Dp16, and Dp16: App+/+/‐ mice with β‐actin used as a loading control. Quantitation and statistical analysis are shown in the lower panels (Q, R). One‐way ANOVA followed by Newman–Keuls Multiple Comparison test; n = 4 for 2N, n = 3 for Dp16, and n = 3 for Dp16: App+/+/‐ in panels A–O; n = 3 for each group in panel P–R; *p < 0.05, **p < 0.01, ***p < 0.001. ANOVA, analysis of variance; APP, amyloid precursor protein; β‐CTF, the beta‐C‐terminal fragment; GEF, guanine‐nucleotide exchange factors; GTP, guanosine 5′‐triphosphate.
FIGURE 4
FIGURE 4
RAB5 hyperactivation is necessary for the widespread hyperactivation of endosomal Rabs in Dp16 neurons. (A–C) Primary wild‐type cortical neurons were treated with 1 µM GSI for 24 h followed by GTP agarose pull‐down assay to analyze the activities of RABs 5, 7, and 11. N = 3 for RAB5B and RAB7; n = 5 for RAB11A. (D) Evaluation of lentivirus‐mediated β‐CTF or α‐CTF expression in wild‐type neurons. (E, F) Primary cortical neurons were infected with β‐CTF or α‐CTF lentivirus for 72 h, followed by GTP agarose pull‐down assay to analyze the activities of RABs 5, 7, and 11. N = 4 for RAB5B and RAB7; n = 5 for RAB11A. (G) Screening of shAppl1 by infecting primary cortical neurons with lentivirus expressing shRNAs targeting mouse Appl1 for 72 h. (H, I) Primary 2N or Dp16 cortical neurons at DIV5 were infected with shAppl1‐2 or control lentivirus for 72 h to assess RABs 7 and 11 activities. APPL1 was also probed. N = 3 for RAB5B, RAB7, and APPL1; n = 4 for RAB11A. (J) Primary neurons were infected with either β‐CTF lentivirus or control lentivirus. Subsequently, endosomes were immunoprecipitated using a RAB5‐specific antibody or IgG. The levels of RABs and APPL1 in the immunoprecipitants were evaluated (K). N = 3. (L, M) Endosomes were immunoprecipitated with the same RAB5 antibody from either 4‐month‐old 2N or Dp16 brains followed by evaluation of RABs and APPL1 in the immunoprecipitants. N = 3. (N, O) Primary wild‐type cortical neurons were infected with RAB5Q79L lentivirus for 48 h, followed by GTP agarose pull‐down assay to assess RABs 7 and 11 activities. N = 5 in lenti‐con, n = 6 in lenti‐RAB5Q79L for RAB7; n = 6 in both lenti‐con and lenti‐RAB5Q79L for RAB11A. (P) Primary cortical neurons from 2N or Dp16 embryos at DIV5 were infected with RAB5S34N or control lentivirus for 72 h to assess RABs 7 and 11 activities. APP was also probed. Quantitation and statistical analysis are shown in the lower panel Q. N = 4 in each group for RAB7; n = 3 in each group for RAB11A. Paired t‐test for A–C, K, M; unpaired t‐test for N, O; one‐way ANOVA followed by Newman–Keuls Multiple Comparison test for F, I, Q; *p < 0.05, **p < 0.01, ***p < 0.001. ANOVA, analysis of variance; APP, amyloid precursor protein; β‐CTF, the beta‐C‐terminal fragment; GSI, γ‐secretase inhibitor; GTP, guanosine 5′‐triphosphate; shRNA, short hairpin RNA; DIV, days in vitro.
FIGURE 5
FIGURE 5
RAB5 hyperactivation is necessary for upregulating GEFs of RABs 7 and 11 in Dp16 neurons. (A) Primary App−/− cortical neurons were infected with RAB5Q79L lentivirus for 48 h, followed by GTP agarose pull‐down assay to assess RABs 7 and 11 activities. Wild‐type neurons were lysed to assess the expression of APP. (B, C) Quantitation and statistical analysis of RABs 7 and 11 activities in A. N = 5 for each group. (D) The expression levels of CCZ1 and SH3BP5 in GSI‐treated (1 µM GSI, 24 h) wild‐type neurons were measured. (E, F) Quantitation and statistical analysis of the levels of CCZ1 and SH3BP5 in D. N = 5 in each group. (G) The expression levels of CCZ1 and SH3BP5 in the β‐CTF or α‐CTF lentivirus‐infected wild‐type neurons were measured. (H, I) Quantitation and statistical analysis of the levels of CCZ1 and SH3BP5 in G. N = 7 in each group for CCZ1; n = 4 for SH3BP5. (J) The expression levels of CCZ1 and SH3BP5 in RAB5Q79L lentivirus‐infected neurons were measured. (K, L) Quantitation and statistical analysis of the levels of CCZ1 and SH3BP5 in J. N = 7 in each group for CCZ1; n = 4 for SH3BP5. (M) The expression levels of CCZ1 and SH3BP5 in the RAB5S34N or control lentivirus‐infected 2N or Dp16 cortical neurons were measured. (N, O) Quantitation and statistical analysis of the levels of CCZ1 and SH3BP5 in M. N = 8 in each group for CCZ1; n = 6 for SH3BP5. (P) App−/− cortical neurons were infected with RAB5Q79L lentivirus for 48 h to assess the levels of CCZ1 and SH3BP5. N = 5 for each group. (Q, R) Quantitation and statistical analysis of the levels of CCZ1 and SH3BP5 in P. (S) The mRNA levels of Ccz1 and Sh3bp5 were analyzed in the brains of 4‐month‐old 2N and Dp16 mice using qPCR. N = 5 in 2N and Dp16 for Ccz1; n = 4 in 2N, n = 5 in Dp16 for Sh3bp5. (T) Assessment of the decay rate of CCZ1 and SH3BP5 in 2N and Dp16 cortical neurons in the presence of 100 µg/mL CHX for the indicated durations. (U, V) Quantitation and statistical analysis of the decay rates of CCZ1 and SH3BP5 in T. N = 3 in each group for CCZ1; n = 4 in each group for SH3BP5. (W–Z) Endosomes were immunoprecipitated with a RAB5 antibody from either 4‐month‐old 2N or Dp16 brains followed by evaluation of CCZ1, SH3BP5, Rabex‐5, and LAMP1 in the immunoprecipitants. N = 3 in each group. Paired Student t‐test for B, C, E, F, Q, and R; unpaired Student t‐test for K and L; one‐way ANOVA followed by Newman–Keuls Multiple Comparison test for H, I, N, and O; *p < 0.05, **p < 0.01, ***p < 0.001. ANOVA, analysis of variance; APP, amyloid precursor protein; β‐CTF, the beta‐C‐terminal fragment; CHX, cycloheximide; GEF, guanine‐nucleotide exchange factors; GTP, guanosine 5′‐triphosphate; qPCR, quantitative polymerase chain reaction.
FIGURE 6
FIGURE 6
RAB5‐dependent changes in the levels and activities of cathepsins in Dp16 neurons. (A) The levels of cathepsins in wild‐type cortical neurons expressing RAB5Q79L for 48 h were measured. (B–E) Quantitation and statistical analysis of the cathepsin levels in A. N = 5 in lenti‐con and lenti‐RABQ79L for Cat B and Cat L, n = 8 for Cat D. (F) The levels of cathepsins in 2N and Dp16 cortical neurons expressing RAB5S34N or control lentivirus for 72 h were measured. (G–J) Quantitation and statistical analysis of the cathepsin levels in F. N = 5 in each group for Cat B, n = 6 for Cat L, n = 4 for Cat D. (K–M) The levels of cathepsins in App−/− cortical neurons expressing RAB5Q79L for 48 h were measured. N = 5 in lenti‐con and lenti‐RABQ79L for Cat B and Cat L, n = 4 for Cat D. (N) The activities of Cat B and Cat L in 2N, Dp16, and Dp16 expressing RAB5S34N were assessed by fluorescent SDS‐PAGE cysteine cathepsin activity profiling using BMV109. (O, P) Quantitation and statistical analysis of the cathepsin activities in N. N = 6 in each group for Cat B and Cat L. (Q) Live imaging of DQ‐BSA in the lenti‐RAB5Q79L or lenti‐control (48 h) infected wild‐type cortical neurons. N = 30 cells in lenti‐con and lenti‐RABQ79L from three independent experiments. Unpaired Student t‐test for B–E, K–M, Q; one‐way ANOVA followed by Newman–Keuls Multiple Comparison test for G–J, O, and P; *p < 0.05, **p < 0.01, ***p < 0.001. ANOVA, analysis of variance; Cat, cathepsin; SDS‐PAGE, sodium dodecyl sulfate–polyacrylamide gel electrophoresis.

Similar articles

Cited by

References

    1. Scheltens P, Blennow K, Breteler MM, et al. Alzheimer's disease. Lancet. 2016;388:505‐517. - PubMed
    1. Cummings J, Zhou Y, Lee G, Zhong K, Fonseca J, Cheng F. Alzheimer's disease drug development pipeline: 2023. Alzheimers Dement (N Y). 2023;9:e12385. - PMC - PubMed
    1. Lott IT, Head E. Dementia in Down syndrome: unique insights for Alzheimer disease research. Nat Rev Neurol. 2019;15:135‐147. - PMC - PubMed
    1. Ballard C, Mobley W, Hardy J, Williams G, Corbett A. Dementia in Down's syndrome. Lancet Neurol. 2016;15:622‐636. - PubMed
    1. Chen XQ, Mobley WC. Alzheimer disease pathogenesis: insights from molecular and cellular biology studies of Oligomeric Abeta and Tau species. Front Neurosci. 2019;13:659. - PMC - PubMed

MeSH terms

Substances