. 2025 May 8;27(1):73.
doi: 10.1186/s13058-025-01982-2.

Circulating immune cells exhibit distinct traits linked to metastatic burden in breast cancer

Affiliations

Circulating immune cells exhibit distinct traits linked to metastatic burden in breast cancer

S Mangiola et al. Breast Cancer Res. .

Abstract

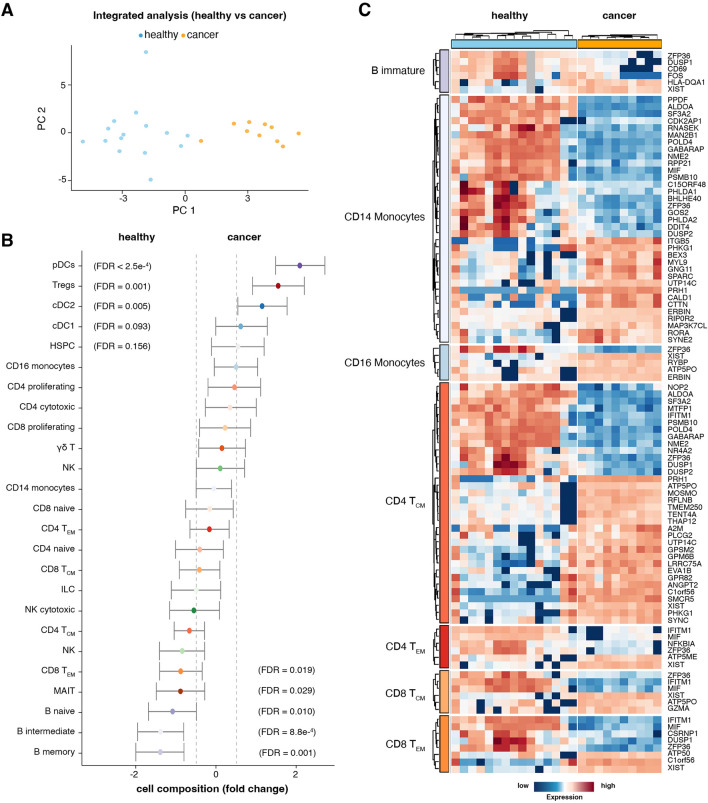
Background: Circulating immune cells play a crucial role in the anti-tumour immune response, yet the systemic immune system in metastatic breast cancers is not fully characterised. Investigating the cellular and molecular changes in peripheral blood mononuclear cells (PBMCs) from breast cancer patients could elucidate the role of circulating immune cells in metastasis and aid in identifying biomarkers for disease burden and progression.

Methods: In this study, we characterised the systemic immune landscape associated with varying levels of metastatic burden by analysing the single-cell transcriptomes of PBMCs from breast cancer patients and healthy controls. Our research focused on identifying changes in immune cell composition, transcriptional programs, and immune-cell communication networks linked to metastatic burden. Additionally, we compared these PBMC features onto a single-cell atlas of primary breast tumours to study corresponding traits in tumour-infiltrating immune cells.

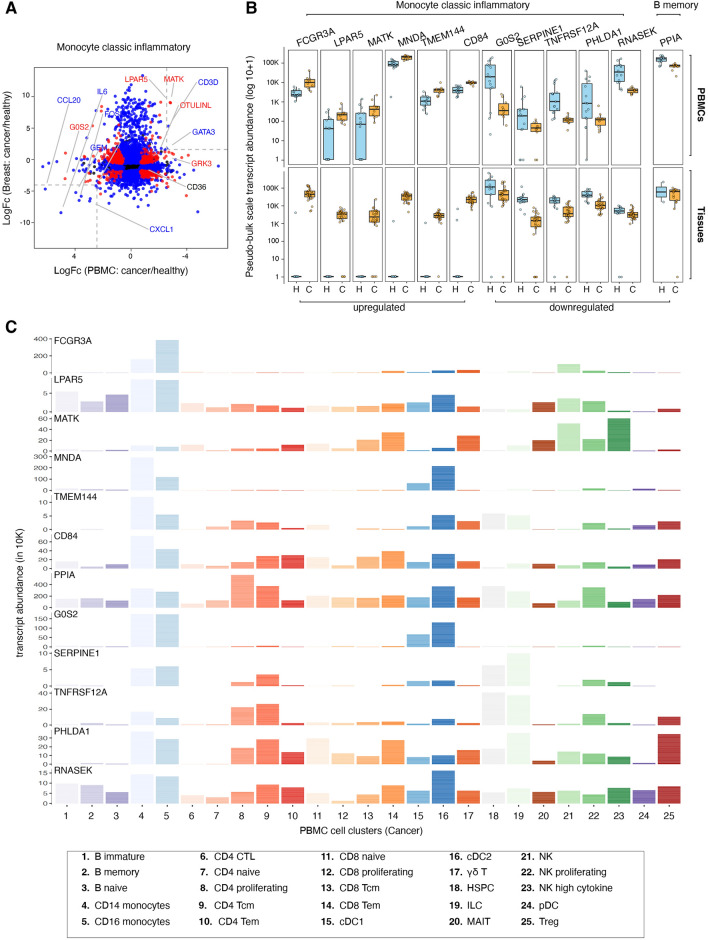
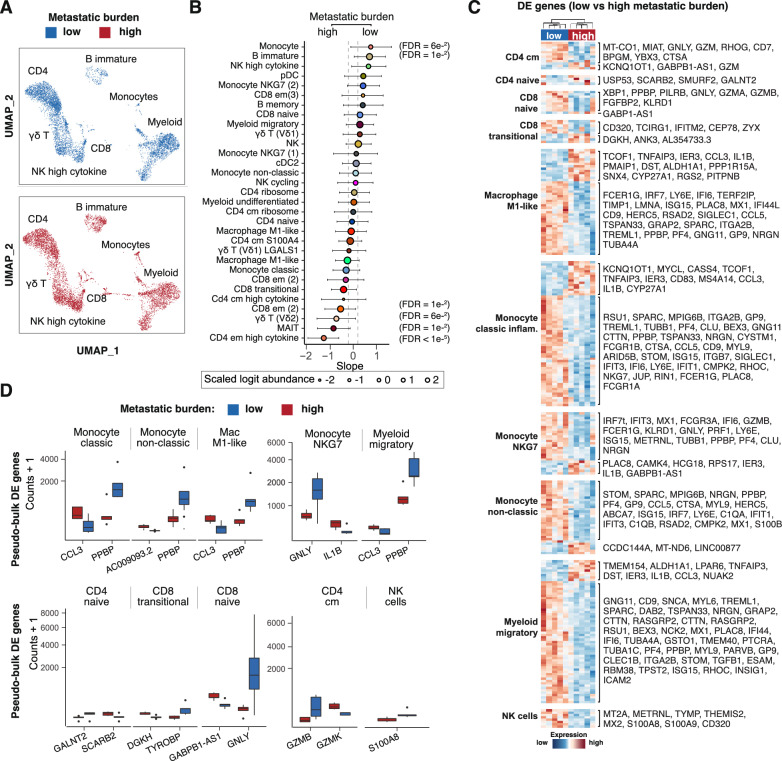
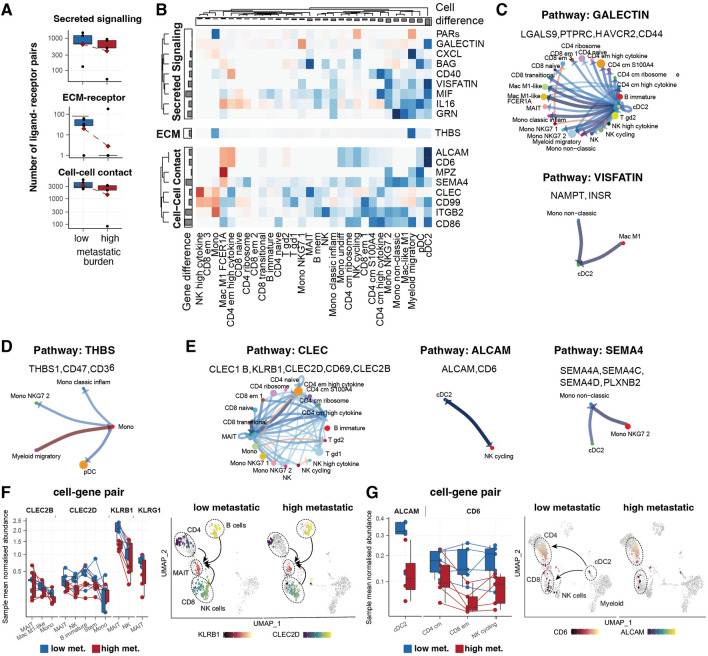
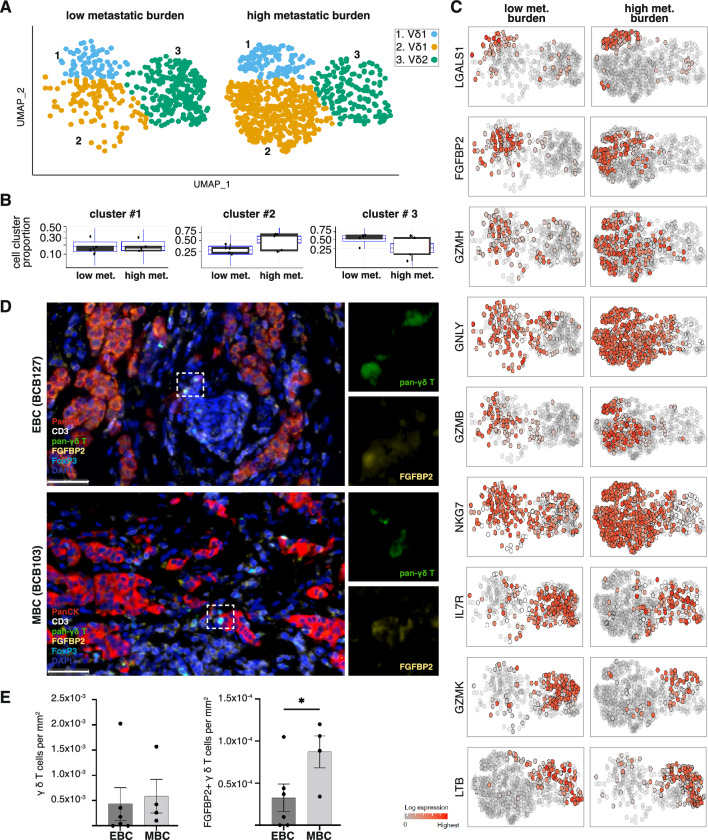
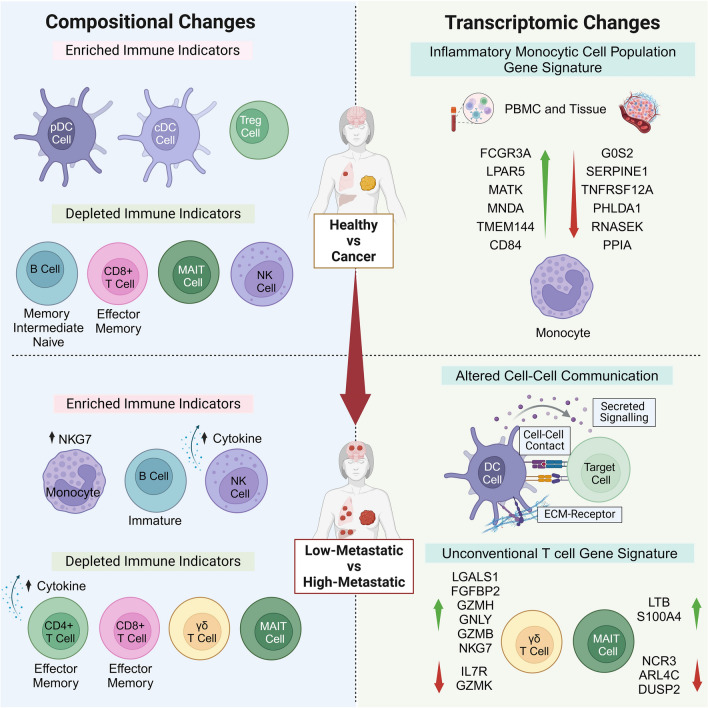
Results: In metastatic breast cancer, PBMCs exhibit a significant downregulation of the adaptive immune system and a decreased number and activity of unconventional T cells, such as γδ T cells. Additionally, metastatic burden is associated with impaired cell communication pathways involved in immunomodulatory functions. We also identified a gene signature derived from myeloid cells shared between tumour immune infiltrates and circulating immune cells in breast cancer patients.

Conclusions: Our study provides a comprehensive single-cell molecular profile of the peripheral immune system in breast cancer, offering a valuable resource for understanding metastatic disease in terms of tumour burden. By identifying immune traits linked to metastasis, we have unveiled potential new biomarkers of metastatic disease.

Keywords: Breast cancer; Metastasis; PBMCs; Single-cell RNA sequencing.


Conflict of interest statement

Declarations. Ethics approval: Human breast tissues and blood samples were obtained from consenting patients through the Austin Health, a tertiary cancer hospital. Human Ethics approval was obtained from the Austin Human Research Ethics Committee (HREC/66494/Austin-2020). Clinicopathological characterisation, including the site of metastasis, is provided in supplementary tables (Tables S1, S2 and S3). Consent for publications: Not applicable Competing interests: The authors declare no competing interests.

Figures

Fig. 1
Fig. 1
PBMCs show unique cell composition and phenotype. A PCA plot of the 25 pseudo-bulk transcriptomes, coloured by healthy (blue) and metastatic (orange) conditions. B Differential cell composition between healthy and cancer patients. Dots are coloured by cell type (also described in Fig. 2C). The right side of the plot contains cells that are enriched in cancer patients, while the cells on the left are enriched in healthy donors. The error bars represent the 95% credible interval for the estimates. The significantly enriched cell types are defined by having the 95% credible interval outside the −0.5/0.5 logit-fold-change interval. C Scaled transcription abundance of cell-type-specific pseudo-bulk samples for the top differentially abundant gene transcripts between healthy vs metastatic breast cancer (FDR < 0.01; log fold change > 2). pDC, Plasmacytoid dendritic cells; cDC, Conventional dendritic cells; Tregs, Regulatory T cells; HSPC, Hematopoietic stem and progenitor cells; NK, natural killer; MAIT, Mucosal-associated invariant T cells
Fig. 2
Fig. 2
Integrated analysis of circulating and tumour infiltrating immune cells. A Gene expression changes (log fold-change) between PBMCs and breast tumour tissue across monocyte classic inflammatory cells. Genes are categorised by their significance in FDR (red: significant in both tissues, blue: significant in either tissue, black: not significant). Dashed lines draw thresholds for fold-change = 2.5 for reference, highlighting areas where genes exhibit substantial expression differences between the two conditions across tissues. B upper panel. Healthy/cancer (H/C) gene signature. Boxplots represent the scaled transcript abundance distribution of the cell-type/sample-specific pseudo-bulk data, healthy (blue) and cancer-associated (orange). B lower panel. Validation of the PBMC signature in breast tissue immune cells. C Transcript abundance per cell type (in cancer) for the 12-gene signature differentiating cancer from healthy state
Fig. 3
Fig. 3
Metastatic burden redefines the cell composition and molecular characteristics of PBMCs. A Integrated UMAP plots showing single cells coloured by low (blue) and high (red) metastatic burden. B Differential cell composition analysis between low and high metastatic burden. Dots are coloured by cell type. Cell types enriched in low-metastatic-burden patients are at the top, while those enriched in high-metastatic-burden patients are at the bottom. The error bars represent the 95% credible interval for the estimates. The bold dot borders label the significantly enriched cell types (testing for an effect bigger than 0.2 logit fold change). C Scaled transcription abundance of cell-type-specific pseudo-bulk samples for the differentially abundant gene transcripts between low vs high metastasis burden. D Top difference per cell type. Boxplots showing the scaled transcript abundance distribution of the cell-type/sample-specific pseudo-bulk data for low (blue) or high (red) metastatic burden. For each cell type shown, the gene wise FDR values are: Monocytes (CCL3; FDR = 1e-3 and PPBP; FDR = 5e-10), Monocyte non-classic (AC009093.2; FDR = 7e-6 and PPBP; FDR = 3e-5), Macrophage M1-like (CCL3; FDR = 2e-3 and PPBP; FDR = 6e-7), Monocyte NKG7 (GNLY; FDR = 2e-4 and IL1B; FDR = 5e-5), Myeloid migratory (CCL3; FDR = 9e-4 and PPBP; FDR = 4e-5), CD4 naïve (GALANT2; FDR = 1e-2 and SCARB2; FDR = 1e-2), CD 8 T transitional (DGKH; FDR = 5e-5 and TYROBP; FDR = 2e-5), CD 8 T naïve (GABPB1-AS1; FDR = 7e-3 and GNLY; FDR = 4e-3), CD 4 Tcm (GZMB; FDR = 2e-7 and GZMK; FDR = 9e-5) and NK cells (S100A8; FDR = 1e-3)
Fig. 4
Fig. 4
The extent of metastatic burden alters immune crosstalk profiles. A Comparison of the number of highly transcribed ligand-receptor pairs between PBMC samples from high and low metastatic burden patients. The communication axes are grouped by long-distance secreted signalling, extracellular matrix (ECM) receptors, and cell–cell interactions. The red diamond indicates the average count across samples. B Composite enrichment scores for cell-type/communication axes between a cell type (e.g. cDC2; x-axis) and all other cell types. Each communication axis can underlie several ligands and receptors. The colours represent the enrichment direction (blue for low and red for high metastatic burden disease). Communication axes are grouped by type. Bar plots represent the enrichment score average for cell types (columns) or communication axes (rows). C, D, and E Enrichment of communication among cell type pairs for the most differentially enriched communication axes (in either direction). The colours represent the enrichment direction (blue for low and red for high metastatic burden disease). The genes included in each communication axis are below the names of the communication axes. The arrows represent the direction of the communication (ligand outgoing, receptor incoming). Some communications are bi-directional. F Transcript abundance for the CLEC/KLRB1 ligand/receptor pair for the cell types that show enrichment. Colours represent conditions (blue for low and red for high metastatic burden). UMAP plot of cells coloured by transcription of either CLEC or KLRB1. The UMAP panels on the right side show the enrichment of communication between cell types for the most differentially enriched communication axes (in either direction). G Transcript abundance for the ALCAM/CD6 ligand/receptor pair for the cell types that show enrichment (dendritic cells with ligand and lymphocytes with the receptor). Colours represent conditions. UMAP plot of cells coloured by transcription of either ALCAM or CD6. The UMAP panels (right-side) show communication enrichment among cell types. The colours represent the enrichment direction (blue for low- and red for high-metastatic burden disease)
Fig. 5
Fig. 5
Gamma-delta T cells show transcriptional changes in metastatic patients with breast cancer. A UMAP plots of the re-clustered γδ T cells from low-metastatic (left panel) and high-metastatic burden samples (right panel). B Differential composition (estimated by sccomp) of the three gamma-delta cell clusters relative to the whole gamma-delta population between low and high-burden metastatic patients. Data points are samples. The blue boxplot represents the posterior predictive estimates that indicate the model’s descriptive accuracy for the data [37]. C UMAP plots of gamma-delta T cells in low-metastatic (left panel) and high-metastatic samples (right panel), coloured by the relative transcript abundance of the top 9 marker genes. D mIHC panel shows the expression of pan-cytokeratin (red; tumour cells), CD3 (white; T cells), pan-γδ T cell (green), FGFBP2 (yellow), FOXP3 (light blue) and DAPI (dark blue; nuclei) in primary tumour tissues from non-metastatic early breast cancer patients (EBC; top panel) and metastatic breast cancer patients (MBC; bottom panel). The white dotted box marks γδ T cells that co-express FGFBP2 and are shown in magnified images on the right side. E mIHC image quantification showing the total number of γδ T cells per mm2 of tissues (left panel) and FGFBP2 + γδ T cells (right panel) from EBC (n = 6) and MBC tumours (n = 4) with p-value (* = 0.0369)
Fig. 6
Fig. 6
Schematic summary. The illustration summarises the compositional and transcriptomic changes in PBMCs between the healthy and cancer states (top half) and across different levels of metastatic burden (bottom half). Additionally, it highlights conserved transcriptional changes observed in monocytes from both PBMCs and breast tumors (top right)

Similar articles

References

    1. Riggio AI, Varley KE, Welm AL. The lingering mysteries of metastatic recurrence in breast cancer. Br J Cancer. 2021;124(1):13–26. - PMC - PubMed
    1. Waks AG, et al. The immune microenvironment in hormone receptor-positive breast cancer before and after preoperative chemotherapy. Clin Cancer Res. 2019;25(15):4644–55. - PMC - PubMed
    1. Fares J, et al. Molecular principles of metastasis: a hallmark of cancer revisited. Signal Transduct Target Ther. 2020;5(1):28. - PMC - PubMed
    1. Keller L, et al. Clinical relevance of blood-based ctDNA analysis: mutation detection and beyond. Br J Cancer. 2021;124(2):345–58. - PMC - PubMed
    1. Pang S, et al. Circulating tumour cells at baseline and late phase of treatment provide prognostic value in breast cancer. Sci Rep. 2021;11(1):13441. - PMC - PubMed

MeSH terms

Substances

LinkOut - more resources