. 2025 May 9;24(1):139.
doi: 10.1186/s12943-025-02343-5.

Targeting the HER2-ELF3-KRAS axis: a novel therapeutic strategy for KRASG13D colorectal cancer

Affiliations

Targeting the HER2-ELF3-KRAS axis: a novel therapeutic strategy for KRASG13D colorectal cancer

Soo-Yeon Hwang et al. Mol Cancer. .

Abstract

Colorectal cancer (CRC) is one of the most prevalent cancers worldwide, with KRAS mutations playing a significant role in its tumorigenesis. Among the KRAS variants, the G13D mutation is associated with poor prognosis and distinctive biological behaviors. This study focuses on the role of HER2, a critical prognostic and predictive biomarker, in modulating the unique characteristics of KRASG13D-mutated CRCs. We identified a novel transcriptional regulatory network involving HER2, ELF3, and KRAS, with ELF3 acting as a key transcription factor (TF) that regulates KRAS expression under conditions of HER2 overexpression. Our findings reveal that this HER2-ELF3-KRAS axis is exclusively activated in KRASG13D, driving aggressive oncogenic features and conferring resistance to cetuximab (CTX) therapy. Through comprehensive analysis of gene expression profiles, we demonstrated that HER2 is a crucial therapeutic target specifically for KRASG13D CRCs. To explore this further, we introduced YK1, a small molecule inhibitor designed to disrupt the ELF3-MED23 interaction, leading to the transcriptional downregulation of HER2 and KRAS. This intervention significantly attenuated the HER2-ELF3-KRAS axis, sensitizing KRASG13D CRCs to CTX and reducing their tumorigenic potential by inhibiting the epithelial-to-mesenchymal transition process. Our study underscores the importance of HER2 as a key determinant in the unique biological characteristics of KRASG13D CRCs and highlights the therapeutic potential of targeting the HER2-ELF3-KRAS axis. By presenting YK1 as a novel pharmacological approach, we provide a promising strategy for developing tailored interventions for KRASG13D CRCs, contributing to the ongoing efforts in precision medicine for CRCs.

Keywords: KRAS G13D; KRAS mutation; Colorectal cancer; ELF3; HER2; HER2-ELF3-KRAS axis; Protein–protein interaction inhibitor; Transcriptional regulation.


Conflict of interest statement

Declarations. Ethics approval and consent to participate: All animal experiments were approved by the Institutional Animal Care and Use Committee (IACUC) at Ewha Womans University. All studies involving human subjects were approved by the Institutional Review Board (IRB) of Severance Hospital of the Yonsei University (Seoul, Korea) (IRB#4–2012-0859). Written informed consent was obtained from all patients prior to sample collection. Consent for publication: Not applicable. Competing interests: The authors declare no competing interests.

Figures

Fig. 1
Fig. 1
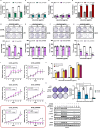
HER2 as a potential key determinant of the unique biological characteristics of KRASG13D CRCs. A The overall survival rate of patients with different KRAS mutation statuses was assessed using the GSE39582 database, which included a total of 578 patients (**p < 0.01, log-rank test). B-D The prognostic significance of HER2 was evaluated by comparing the overall survival probabilities between HER2high and HER2low subgroups in KRASG13D (n = 15) (B), KRASG12 variant (n = 212) (C) and KRASWT (n = 50) (D) CRC patients (GSE39582). (*p < 0.05, log-rank test). The hazard ratio for each independent variable was calculated by multivariate Cox proportional hazard regression. E The expression levels of HER2 were measured in various CRC cell lines with different KRAS mutation statuses. F The growth inhibitory effect of CTX (20 μg/mL) was tested against diverse CRC cell lines with different KRAS mutation statuses following 48 h-treatment at the indicated concentrations
Fig. 2
Fig. 2
HER2 expression level as a key predictive factor for the susceptibility of KRASG13D CRC cells to CTX. A-H The inhibitory effects of CTX on cell growth (A, C, E, and G) and colony forming ability (B, D, F, and H) were evaluated in SW48 isogenic cell lines and their HER2-knockdown (KD) clones: WT_shCTRL/WT_shHER2 (A, B), G12D_shCTRL/G12D_shHER2 (C, D), G12 V_shCTRL/G12V_shHER2 (E, F), and G13D_shCTRL/G13D_shHER2 (G, H). 24 h treatment was conducted for growth inhibition (n = 6) and a 10 day treatment for long-term anti-proliferative effects (n = 5) at the indicated concentrations (ANOVA, ns = non-significant, ****p < 0.0001 vs. shCTRL). I The tumor growth inhibitory effect of CTX (intraperitoneal injection at 1 mg/kg every 3 days) was evaluated using xenograft mouse models of SW48 isogenic cell lines and their HER2-silenced clones (n = 5 per group) (ANOVA, ***p < 0.001 vs. CON). J The growth inhibitory effect of CTX was tested against HCT15 (HCT15_shCTRL) and its HER2 knockdown clone (HCT15_shHER2), with caco-2 serving as a positive control (n = 4). 24 h-treatment was conducted at the indicated concentrations. K The long-term anti-proliferative effect of CTX was assessed against HCT15_shCTRL and HCT15_shHER2 cells (n = 5) following 10 d-treatment at the indicated concentrations (ANOVA, ns = non-significant, ***p < 0.001, ****p < 0.0001 vs. control (0), ####p < 0.0001 vs. shCTRL). L Changes in CTX sensitivity were assessed in Caco-2 and HER2-KD Caco-2 cells transduced with KRASG13D using pcDNA4-KRASG13D-Hismax construct following 16 h-treatment at the indicated concentrations
Fig. 3
Fig. 3
Highly-expressed HER2 as a critical inducer of aggressive oncogenic features in KRASG13D CRC cells. A-F The cell growth rate (A, C, and E) and colony-forming ability (B, D, and F) of SW48 isogenic cell lines and their HER2-knockdown (KD) clones were evaluated: G12D_shCTRL/G12D_shHER2 (A, B), G12V_shCTRL/G12V_shHER2 (C, D), and G13D_shCTRL/G13D_shHER2 (E, F). The cell growth rate was assessed over short-term periods at the indicated time points (n = 5), while the colony formation rate was tested over 10 days (n = 5) (ANOVA was used for the cell growth rate analysis and Student’s t-test for the colony formation rate, ns = non-significant, **p < 0.01, ****p < 0.0001 vs. shCTRL). G, H The growth rates (G) and long-term cell proliferation rates (H) of HCT15 (HCT15_shCTRL) and its HER2-silenced model (HCT15_shHER2) were evaluated. For growth rate evaluation, each cell line was monitored up to 72 h (n = 5), and cell viability at each time point was colorimetrically assessed by absorbance at 450 nm. For the cell proliferation rate assessment, both cell lines were incubated for 10 days (n = 5) (ANOVA was used for (G) and Student’s t-test for (H), ns = non-significant, **p < 0.01, ****p < 0.0001 vs. shCTRL). I Tumor forming abilities of SW48 isogenic cell lines and their HER2-KD clones were evaluated using xenograft mouse models. Each cell line pair (shCTRL and shHER2) was separately injected to the left or right side of the mouse flank and tumor growth was monitored for a total of 30 days (n = 5). Both changes in tumor volume and tumor weight data were presented as relative ratios to shCTRL (Student’s t-test, ns = non-significant, **p < 0.01, ***p < 0.001 vs. shCTRL)
Fig. 4
Fig. 4
EMT as a process distinctively engaged in KRASG13D CRCs with high HER2 levels. A GSEA was conducted on the expression dataset of KRASG13D CRC patient samples from GSE39582 using a pre-annotated hallmark gene set collection, with FDR q < 0.05 and NOM p < 0.05 considered significant. B, C GSEA plots for the EMT gene set were generated using the expression datasets of KRASG13D CRC (B) and KRASG12 CRC (C) patient samples from GSE39582. The datasets were reconstituted based on HER2 expression levels. NES, NOM p and FDR q values are as displayed above. D Representative IHC images of HER2, E-cadherin, and vimentin for HER2 high tumors with different KRAS mutational statuses are shown (I, KRASWT; II, KRASG12; III, KRASG12/13; and IV, KRASG13D). Images are at 100 × magnification (scale bars = 200 μm). E IHC scores of E-cadherin and vimentin were calculated by intensity score × fraction score, with quantification performed using ImageJ software. Box-and-Whisker plots were used to compare the distribution of each sample within the groups (ANOVA, ns = non-significant, **p < 0.01). F HER2-mediated changes in the expression levels of E-cadherin and vimentin were evaluated in various SW48 isogenic cell lines. G Transwell migration assay was performed on shCTRL and shHER2 clones of SW48 isogenic cell lines, with images at 200 × magnification (scale bars = 100 μm). Quantification was conducted through ImageJ software, presenting the rates as relative ratios to shCTRL for each cell line (n = 3) (ANOVA, ns = non-significant, **p < 0.01, ****p < 0.0001 vs. shCTRL)
Fig. 5
Fig. 5
Transcriptional regulatory axis of HER2-ELF3-KRAS as a therapeutic target for KRASG13D CRCs. A, B The anti-proliferative effect of trastuzumab (A) and its impact on HER signaling (B) were assessed in SW48G13D, HCT15, and LoVo cells. Trastuzumab was applied for 10 days (A) and 16 h (B) at the indicated concentrations. C, D shHER2-mediated alteration in HER signaling (C) and KRAS mRNA levels (D) (n = 3, mean ± S.D, normalized to GAPDH) were investigated in SW48G13D, HCT15 and LoVo cells. Cells were harvested after 36 h of incubation (ANOVA, ***p < 0.001, ****p < 0.0001, vs. shCTRL). E Schematic representation of the HER2-ELF3-KRAS transcriptional regulatory network. F Reporter gene assay was performed using pGL3-KRAS reporter gene. pGL3-KRAS was co-transfected with empty vector or pcDNA3.1-ELF3 for 24 h (n = 4, mean ± S.D). β-Gal was used for normalization of transfection efficiency (ANOVA, **p < 0.01, ****p < 0.0001 vs. Basic, ####p < 0.0001 vs. KRAS + emp). G shELF3-mediated changes in the KRAS expression level were evaluated after transient transduction for 24 h. H, I shHER2-induced alterations in protein (H) and gene (I) expression level of HER2 and ELF3 were assessed (n = 3, mean ± S.D, normalized to GAPDH). (ANOVA, **p < 0.01, ****p < 0.0001 vs. shCTRL). J Changes in KRAS expression levels were evaluated in SW48G13D cells following pCDH-HER2 overexpression, shHER2 knockdown, and shELF3 transduction. HER2 overexpression and knockdown were stably induced, while shELF3 was transiently transfected for 24 h
Fig. 6
Fig. 6
Inhibition of ELF3-MED23 as a novel therapeutic approach to attenuate the HER2-ELF3-KRAS axis in KRASG13D CRCs. A GST pull-down assay was performed using GST-ELF3. GST-ELF3 was co-transduced with either empty p3xFLAG or p3xFLAG-ELF3 construct. YK1 was applied 12 h post-transfection and maintained for additional 12 h prior to cell harvest. B, C YK1-mediated alterations in protein (B) and gene (C) expression levels of HER2, ELF3, and KRAS were evaluated (n = 5, mean ± S.D, normalized to GAPDH). (ANOVA, ****p < 0.0001 vs. CON). D The growth inhibitory effect of YK1 was assessed in SW48G13D and HCT15 cells. YK1 was treated for 48 h at the indicated concentrations (n = 5) (ANOVA, ****p < 0.0001 vs. CON)
Fig. 7
Fig. 7
Transcriptionally downregulating HER2 via YK1 as a relevant strategy to overcome therapeutic limitations of KRASG13D CRC cells. A-D The effect of YK1 and CTX co-treatment on cell viability was assessed on SW48 isogenic cell lines [SW48WT (A), SW48G12D (B), SW48G12V (C), and SW48G13D (D)]. Cells were treated with the indicated concentrations for 24 h (ANOVA, ns = non-significant, **p < 0.0001, ****p < 0.0001 vs. control, ##p < 0.0001 vs. CTX). E Combination index (CI) values for YK1 (10 μM) and CTX (10 μg/mL) in SW48 isogenic cell lines were calculated using Compusyn software. F Co-treatment effects of YK1 and CTX on colony-forming ability were measured against SW48G13D and HCT15 cells (n = 5) following a 10 d-incubation at indicated concentrations (ANOVA, ns = non-significant, *p < 0.05, **p < 0.01, ****p < 0.0001 vs. control (0), ##p < 0.01, ###p < 0.01 vs. CTX). G YK1-induced changes in EMT marker gene expression were examined in SW48G13D and HCT15 cells after 16 h of treatment at the indicated concentrations (n = 5, mean ± S.D., normalized to GAPDH) (ANOVA, ns = non-significant, ***p < 0.001, ****p < 0.0001 vs. CON). H Transwell migration assay was performed after 16 h of YK1 treatment in SW48G13D and HCT15 cells at the indicated concentrations. Images were captured at 200 × magnification (scale bars = 100 μm). Quantification of cell migration was conducted using ImageJ software, presented as a relative ratio on CON (n = 3). (ANOVA, ***p < 0.001 vs. CON)
Fig. 8
Fig. 8
YK1 induces potent anti-cancer effects in KRASG13D CRC tumors. A The co-administration effect of CTX (1 mg/kg) and YK1 (10 mg/kg) was evaluated in an in vivo xenograft mouse model using SW48G13D cells (n = 6). Drug administration began on day 1, and tumor length and width were measured with calipers. Tumor volumes were calculated using the formula: (length × width2)/2. Data are presented as mean ± S.E.M. (ANOVA, ns = non-significant, ****p < 0.0001 vs. CON, ####p < 0.0001 vs. CTX). B Representative images of the excised tumors from each group (n = 6). C Tumor weights were assessed across treatment groups (n = 6). (ANOVA, ns = non-significant, *p < 0.05, ****p < 0.0001 vs. CON, ###p < 0.001 vs. CTX). D IHC staining for Ki67 and HER2 was performed on tumor tissues from each group. The positive area and intensity (both normalized to CON) were quantified for Ki67 and HER2, respectively (n = 6, 10 independent fields per animal). Data are shown as mean ± S.D. (ANOVA, ns = non-significant, *p < 0.05, **p < 0.01, ***p < 0.001 vs. CON, ###p < 0.001 vs. CTX). E, F Gene expression levels of HER2, ELF3, KRAS (E), and EMT markers (F) were evaluated in tumor tissues from the indicated treatment groups (n = 6, mean ± S.D, normalized to GAPDH). (ANOVA, ns = non-significant, *p < 0.05, **p < 0.01, ***p < 0.001 vs. CON, ##p < 0.001 vs. CTX). G The combined effect of CTX (1 mg/kg) and YK1 (20 mg/kg) was tested in an in vivo orthotopic mouse model of HCT15-luc cells (n = 3). Tumor growth was monitored for 18 days using bioluminescent imaging. Data are presented as the percentage change in tumor size relative to day 1 (mean ± S.E.M.). (ANOVA, *p < 0.05, **p < 0.01 vs. Vehicle on day 1)

References

    1. Bray F, Ren JS, Masuyer E, Ferlay J. Global estimates of cancer prevalence for 27 sites in the adult population in 2008. Int J Cancer. 2013;132:1133–45. - PubMed
    1. Edwards BK, Ward E, Kohler BA, Eheman C, Zauber AG, Anderson RN, Jemal A, Schymura MJ, Lansdorp-Vogelaar I, Seeff LC, et al. Annual report to the nation on the status of cancer, 1975–2006, featuring colorectal cancer trends and impact of interventions (risk factors, screening, and treatment) to reduce future rates. Cancer. 2010;116:544–73. - PMC - PubMed
    1. Kruschewski M, Mueller K, Lipka S, Budczies J, Noske A, Buhr HJ, Elezkurtaj S. The Prognostic Impact of p53 Expression on Sporadic Colorectal Cancer Is Dependent on p21 Status. Cancers. 2011;3:1274–84. - PMC - PubMed
    1. Vogelstein B, Fearon ER, Hamilton SR, Kern SE, Preisinger AC, Leppert M, Nakamura Y, White R, Smits AM, Bos JL. Genetic alterations during colorectal-tumor development. N Engl J Med. 1988;319:525–32. - PubMed
    1. Dinu D, Dobre M, Panaitescu E, Birla R, Iosif C, Hoara P, Caragui A, Boeriu M, Constantinoiu S, Ardeleanu C. Prognostic significance of KRAS gene mutations in colorectal cancer–preliminary study. J Med Life. 2014;7:581–7. - PMC - PubMed

MeSH terms