. 2025 May 8;22(1):48.
doi: 10.1186/s12987-025-00648-7.

The glycosaminoglycan chains of perlecan regulate the perivascular fluid transport

Affiliations

The glycosaminoglycan chains of perlecan regulate the perivascular fluid transport

Abhishek Singh et al. Fluids Barriers CNS. .

Abstract

Background: The perivascular conduct pathway that connects the cerebrospinal fluid spaces with the interstitial fluid in the parenchyma are of importance for solute clearance from the brain. In this pathway, the relatively wide perivascular space (PVS) surrounding the pial arteries provides a low-resistant passage while around the perforating arteries, the solute movement is along the basement membrane (BM), that prevents the free exchange of interstitial fluids and solutes. We hypothesize that this selectivity involves specific components of the vascular BM, which is mainly composed of type IV collagen (Col IV) and laminin networks interconnected by nidogens and heparan sulphate proteoglycans (HSPGs). Perlecan is the major HSPG in the BM that binds to Col IV and laminin via glycosaminoglycan (GAG) chains to form a molecular sieve. GAGs may also provide the charge selectivity required for filtration, and also a scaffold for amyloid-β (Aβ) aggregation. The purpose of this study was the functional characterization of perivascular fluid transport and brain clearance in mice lacking perlecan GAG chains.

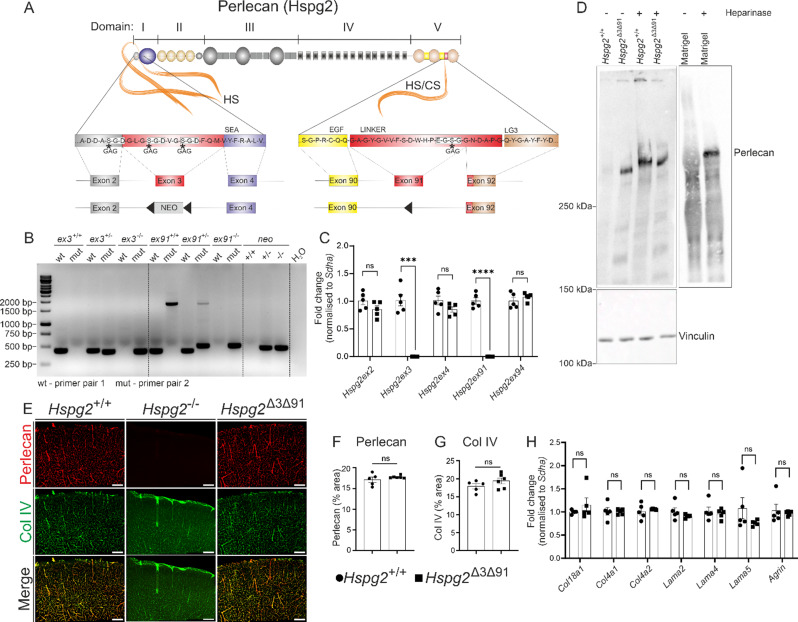
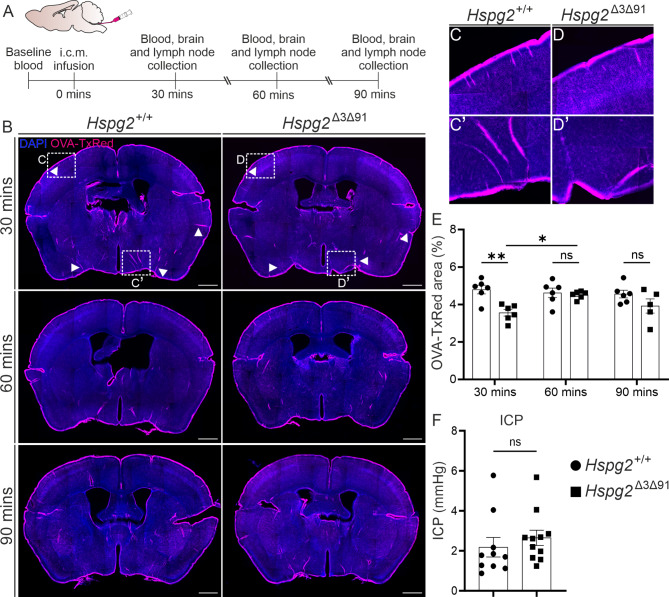
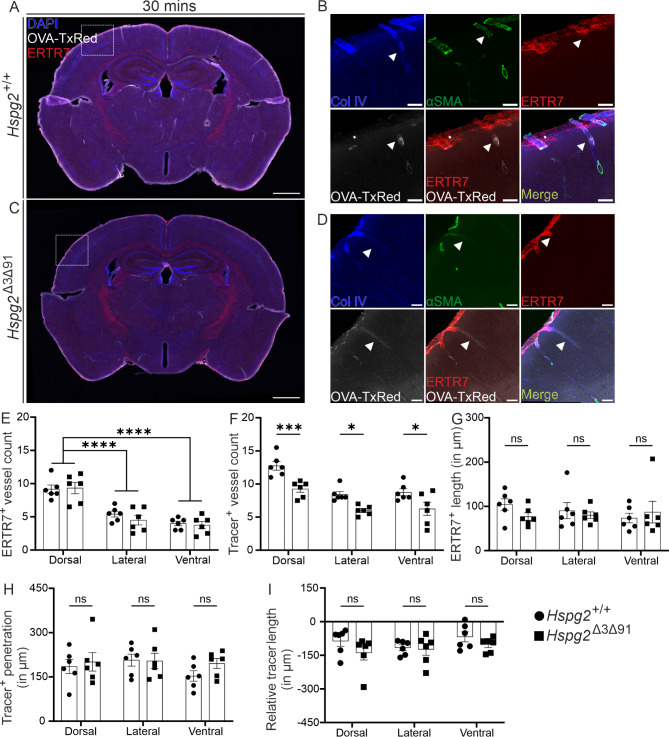
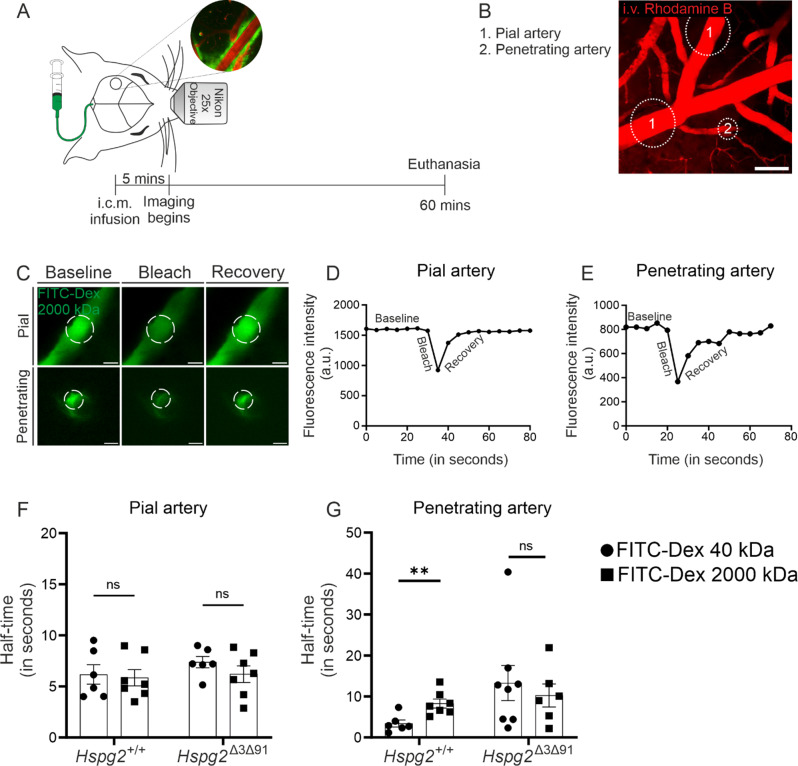
Methods: We generated a novel mouse line (Hspg2∆3∆91) lacking perlecan GAG side chains and investigated perivascular flow and brain clearance in these mice using intravital multiphoton and fluorescence recovery after photobleaching techniques, and functional assays with various tracers. Potentially deleterious effects on brain homeostasis were investigated using transcriptomic, proteomic and immunohistochemical methods. The Hspg2∆3∆91 mice were crossed with a 5xFAD line to examine the importance of GAGs in Aβ aggregation.

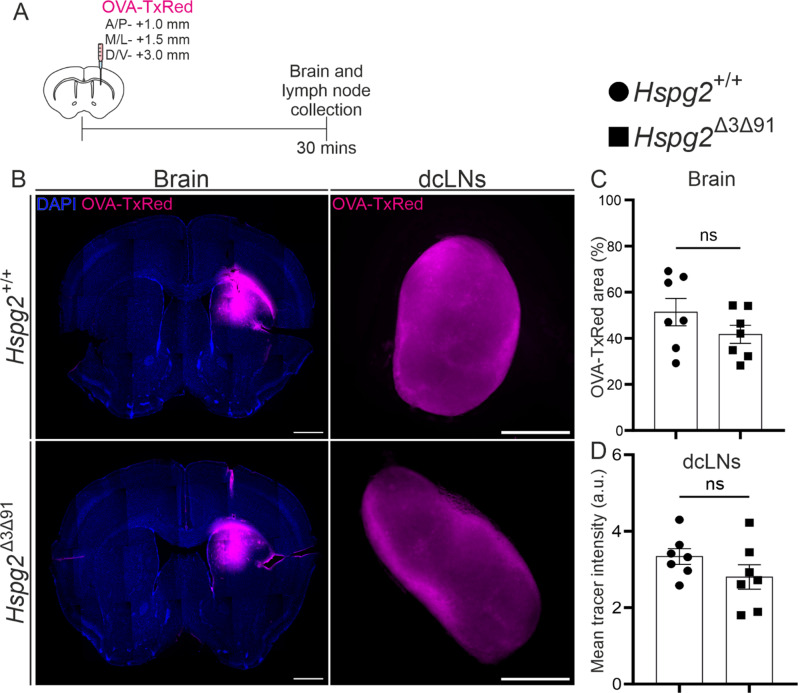
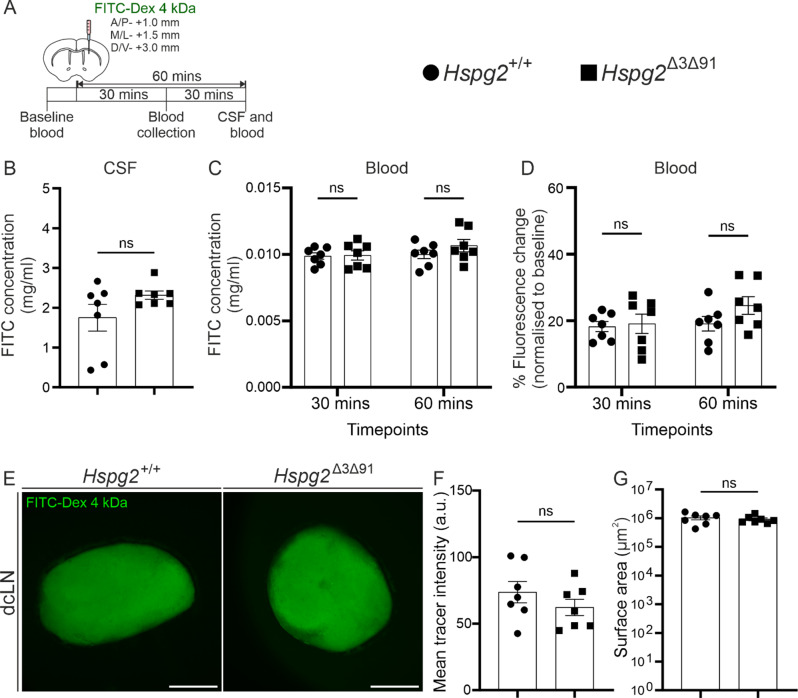
Results: We observed a delayed inflow of CSF tracer into the Hspg2∆3∆91 brain with no changes in the clearance of parenchymal injected tracers. Quantification of the Aβ plaques revealed fewer and smaller plaques in the walls of the pial arteries at six months of age, but not in the brain parenchyma. Surprisingly, perlecan GAG deficiency had no severe deleterious effects on brain homeostasis in transcriptomic and proteomic analyses.

Conclusions: Potential brain clearance mechanisms are dependent on the flow through special ECM structures. BM is mainly known for its barrier function, whereas very little is known about how passage along the perivascular ECM is established. This study shows that the GAG composition of the BM affects the solute dynamics and Aβ deposition in the periarterial space.

Keywords: Amyloid beta; Basement membrane; Cerebrospinal fluid; Extracellular matrix; Glycosaminoglycans; Heparan sulphate proteoglycan; Perivascular space; Perlecan.


Conflict of interest statement

Declarations. Ethics approval and consent to participate: All experimental and animal care procedures were in accordance with the Finnish and European legislation and were approved by the national Project Authorization Board (license numbers ESAVI/2362/04.10.07/2017 and ESAVI/13626/202121/2021). Consent for publication: Not applicable. Competing interests: The authors declare no competing interests.

Figures

Fig. 1
Fig. 1
Generation and characterization of mice lacking glycosaminoglycan chains from perlecan core protein. A) Perlecan primary structure. Serine residues (S, asterisks) in domains I and V are predicted attachment sites for glycosaminoglycan (GAG) chains. Exons 3 and 91 (red boxes) were removed from the perlecan gene (Hspg2) and exon 3 was replaced with a neo cassette (grey box). Black triangles, loxP sequences. B) Genotyping of Hspg2+/+, Hspg2+/- and Hspg2∆3∆91 mice. C) Primers from the targeted exons 3 and 91 showed no qPCR amplicon in the Hspg2∆3∆91 mice, indicating the absence of GAG attachment sites. qPCR using primers from exons 2, 4 or 94 showed no differences between the genotypes, demonstrating unaltered Hspg2 mRNA expression (n = 5 mice per genotype). D) Brain homogenates were treated with heparinase (+) or left untreated (-) and analysed by western blot using anti-perlecan antibody. In the control samples (Hspg2+/+ and Matrigel®) perlecan is visible in western blot only after removal of the GAGs (heparinase +). Perlecan core protein is readily detectable in the Hspg2∆3∆91 mice without heparinase, and the treatment does not affect perlecan mobility, indicating the absence of GAGs in the Hspg2∆3∆91 protein. Vinculin was used as a loading control. E) Immunofluorescence staining of perlecan core protein (red) and Col IV (green). Perlecan is located in the perivascular BMs of the Hspg2+/+ and Hspg2∆3∆91 mice, quantification of the data in F and G (n = 5–6 per genotype). There is no perlecan immunoreactivity in the mice devoid of perlecan core protein (Hspg2-/-). H) qPCR of the brain hemisphere shows no differences in the expression level of basement membrane components in Hspg2∆3∆91 (n = 5) mice relative to Hspg2+/+ (n = 5). Scale bar, 200 μm (E). The statistical tests used were the multiple unpaired two-tailed t-test with Welch’s correction followed by Benjamini and Hochberg correction for multiple tests (C, H), the Mann-Whitney unpaired two-tailed t-test (F) and the unpaired two-tailed t-test with Welch’s correction (G). ***p < 0.001, ****p < 0.0001. ns, non-significant. Mean ± SEM
Fig. 2
Fig. 2
Deletion of glycosaminoglycan chain attachment sites from the perlecan core protein delays cerebrospinal fluid influx into the brain. A) Schematic timeline for the experiment and sample collection. B) Coronal sections of mice brains for the time points indicated, showing the presence of OVA-TxRed tracer (magenta) in the perivascular spaces of the Hspg2+/+ and Hspg2∆3∆91 mice. White arrowheads indicating the locations with reduced perivascular influx in Hspg2∆3∆91 as compared to Hspg2+/+. Enlarged images of brain sections highlighting reduced tracer (magenta) in dorsal (D) and ventral (D’) locations in Hspg2∆3∆91. E) Quantification of the tracer area showing a statistically significant difference between Hspg2+/+ and Hspg2∆3∆91 at 30 min (n = 6) but not at 60 min (n = 6) or 90 min (n = 5–6 mice per genotype). Intracranial pressure (ICP) measurements did not show any difference between the Hspg2+/+ (n = 10) and Hspg2∆3∆91 (n = 11) mice. Scale bar, 1 mm (B). The statistical tests used were 2-way ANOVA followed by Sidak’s post-hoc test (E) and the Mann-Whitney unpaired two-tailed t-test (F).  *p < 0.05, **p < 0.01. ns, non-significant. Mean ± SEM
Fig. 3
Fig. 3
Penetrating vasculature in the Hspg2∆3∆91 mice. A, C) Brain sections from mice euthanized 30 min after OVA-TxRed tracer (white) infusion into the cisterna magna were co-stained with ERTR7 (red), Col IV (blue) and aSMA (green). B, D) Enlarged insets from A and C respectively, showing the distribution of tracer (white) and its co-localization with ERTR7 and Col IV+aSMA+ vessels (arteries, white arrowhead). E, F) Numbers of ERTR7 and tracer-positive vessels and their distribution based on location in Hspg2+/+ (n=6) and Hspg2∆3∆91 (n=6) mice. G-I) Quantification of penetration lengths of ERTR7, tracer, and their relative distance along with their distribution based on their location in the Hspg2+/+ (n=6) and Hspg2∆3∆91 (n=6) mice. Scale bar; 1 mm (A, C), 50 µm (B, D). The statistical test used was 2-way ANOVA followed by Sidak’s post-hoc test (E-I). *p < 0.05, ***p < 0.001, ****p < 0.0001. ns, non-significant. Mean ± SEM
Fig. 4
Fig. 4
Kinetics of fluorescent tracers of differing molecular weights in the perivascular spaces of penetrating and pial arteries in the Hspg2+/+ and Hspg2∆3∆91 mice. A) Schematic setup with the location of the cranial window (circle) and the timeline of the imaging experiment. B) Image of cortical blood vessels (red, i.v. rhodamine). B) with the locations (1 and 2) of the bleaching experiment. C) Series of images showing baseline, bleach and recovery of the tracer (green), when injected via the cisterna magna, around the pial and in the penetrating vessels. D-E) Plots indicating a faster recovery of fluorescence post bleaching next to the pial artery and less steep recovery around the penetrating artery. F) Analysis of the half-time of recovery, showing no significant difference between tracers of different molecular weights (FITC-40 kDa and FITC-2000 kDa) around the pial vessels in the Hspg2+/+ (n = 6–7) and Hspg2∆3∆91(n = 6–7) mice. G) Analysis demonstrating a significant increase in the half-time of the recovery of FITC-2000 kDa tracer as compared to FITC-40 kDa around the penetrating arteries in the Hspg2+/+ (n = 6–7) mice but not in Hspg2∆3∆91(n = 6–8). Scale bar, 50 μm (B, C). The statistical test used was the multiple unpaired two-tailed t-test with Welch’s correction followed by Benjamini and Hochberg correction for multiple t-tests (F, G). **p < 0.01. ns, non-significant. Mean ± SEM
Fig. 5
Fig. 5
Clearance of ovalbumin-Texas Red tracer (45 kDa) from the brain parenchyma into the deep cervical lymph nodes. A) Schematic timeline of tracer infusion into the brain parenchyma along the anterior/posterior (A/P), medial/lateral (M/L) and dorsal/ventral (D/V) axes and collection of the tissue samples. B) Illustrative images of the brain and deep cervical lymph nodes (dcLNs) from Hspg2+/+ and Hspg2∆3∆91 mice, with quantification (C-D, n = 7 mice per genotype). Scale bar, 1 mm (brain), 500 μm (dcLN). The statistical test used was the unpaired two-tailed t-test with Welch’s correction (C, D). ns, non-significant. Mean ± SEM
Fig. 6
Fig. 6
FITC-Dextran (4 kDa) tracer dye clearance from the brain parenchyma into the cerebrospinal fluid, blood and deep cervical lymph nodes. A) Schematic timeline of tracer infusion into the brain parenchyma along the anterior/posterior (A/P), medial/lateral (M/L) and dorsal/ventral (D/V) axes and the collection of blood, cerebrospinal fluid (CSF) and tissue samples. B) Quantification of tracer concentrations in CSF from the Hspg2+/+ (n = 7) and Hspg2∆3∆91 (n = 7) mice. C, D) Tracer concentration or its change relative to baseline in blood samples in the Hspg2+/+ (n = 7) and Hspg2∆3∆91 (n = 7) mice. E) Deep cervical lymph nodes (dcLNs) collected from Hspg2+/+ and Hspg2∆3∆91 mice 60 min after FITC-dextran 4 kDa injection. F, G) Quantification of tracer intensity and size of dcLNs in Hspg2+/+ (n = 7) and Hspg2∆3∆91(n = 7) mice. Scale bar, 500 μm (E). The statistical tests used were the Mann-Whitney unpaired two-tailed t-test (B, G), the unpaired two-tailed t-test with Welch’s correction (F) and 2-way ANOVA followed by Sidak’s post-hoc test (C, D). ns, non-significant. Mean ± SEM
Fig. 7
Fig. 7
Hspg2∆3∆91;5xFAD mice show no alterations in amyloid-β (Aβ) load in the brain parenchyma. A) Timeline of the experiment showing the timing of sample collection. B) Images of brain sections (Aβ, red) from the Hspg2+/+;5xFAD and Hspg2∆3∆91;5xFAD mice at 6 months (n = 12) and 12 months (n = 9) of age. C-E) Quantification of Aβ (red) in the whole brain section. F-H) Quantification of Aβ (red) in the hippocampus (white dashed line). Scale bar, 1 mm (B). The statistical test used was 2-way ANOVA followed by Sidak’s post-hoc test (B-G). *p < 0.05, **p < 0.01, ***p < 0.001, ****p < 0.0001. ns, non-significant. Mean ± SEM
Fig. 8
Fig. 8
Reduced amyloid burden around the pial arteries in 6-month-old Hspg2∆3∆91;5xFAD mice. A) Timeline of the experiment showing the timing of sample collection. B) Schematic of sample collection strategy. C) Images of the pial artery stained with Col IV (green) and αSMA (red) in the mice at the ages indicated. The amyloid beta (Aβ) plaques were stained using methoxy-X04 (MX04, white). D-E) Quantification of the volume and number of MX04+ Aβ plaques surrounding the pial vessels shows significantly fewer Aβ plaques in the Hspg2∆3∆91;5xFAD mice at 6 months (n = 12) than at 12 months (n = 9). F) The volume of the pial arteries shows no significant differences between the genotypes at timepoints indicated. Scale bar, 100 μm (C). The statistical test used was 2-way ANOVA followed by Sidak’s post-hoc test (D-F). *p < 0.05, **p < 0.01, ***p < 0.001. ns, non-significant. Mean ± SEM

Similar articles

References

    1. Iliff JJ, Wang M, Liao Y, et al. A paravascular pathway facilitates CSF flow through the brain parenchyma and the clearance of interstitial solutes, including amyloid Β. Sci Transl Med. 2012;4:ra147111–147111. - PMC - PubMed
    1. Morris AWJ, Sharp MMG, Albargothy NJ, Fernandes R, Hawkes CA, Verma A, Weller RO, Carare RO. Vascular basement membranes as pathways for the passage of fluid into and out of the brain. Acta Neuropathol. 2016;131:725–36. - PMC - PubMed
    1. Bedussi B, Almasian M, de Vos J, VanBavel E, Bakker EN. Paravascular spaces at the brain surface: low resistance pathways for cerebrospinal fluid flow. J Cereb Blood Flow Metab. 2018;38:719–26. - PMC - PubMed
    1. Hannocks M-JJ, Pizzo ME, Huppert J, Deshpande T, Abbott NJ, Thorne RG, Sorokin L. Molecular characterization of perivascular drainage pathways in the murine brain. J Cereb Blood Flow Metab. 2018;38:669–86. - PMC - PubMed
    1. Mestre H, Verma N, Greene TD, et al. Periarteriolar spaces modulate cerebrospinal fluid transport into brain and demonstrate altered morphology in aging and Alzheimer’s disease. Nat Commun. 2022;13:3897. - PMC - PubMed

MeSH terms

LinkOut - more resources