. 2025 May 8;16(1):4298.
doi: 10.1038/s41467-025-59440-8.

Gene Therapy with Enterovirus 3 C Protease: A Promising Strategy for Various Solid Tumors

Affiliations

Gene Therapy with Enterovirus 3 C Protease: A Promising Strategy for Various Solid Tumors

Xiaotong Yang et al. Nat Commun. .

Abstract

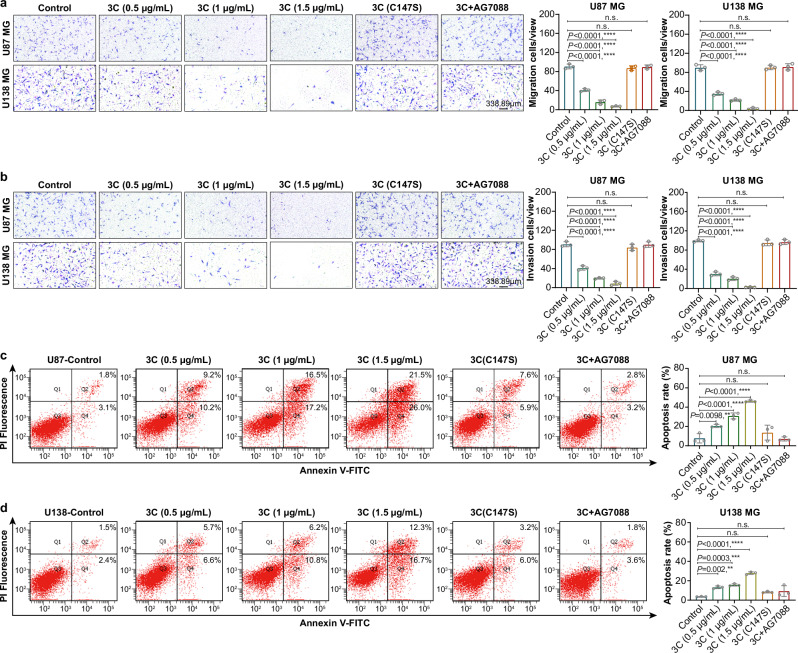
Current cancer gene therapies rely primarily on antitumor immunity, but the exploration of alternative mRNA cargoes for direct antitumor effects is crucial to expand cancer gene therapies. Here we show that lipid nanoparticles (LNPs) carrying mRNA encoding a viral 3 C protease can efficiently suppress tumors by selectively inducing tumor cell apoptosis. In various solid tumor models, intracranial injection of LNPs carrying mRNA encoding the 3 C protease (3C-LNPs) significantly inhibits tumor growth and prolongs survival in glioblastoma models. Similarly, subcutaneous injection reduces tumor volume and inhibits angiogenesis in a breast cancer model, while intravenous injection inhibits tumor growth and angiogenesis and prolongs survival in hepatocellular carcinoma models. Mass spectrometry and cleavage site prediction assays identify heterogeneous nuclear ribonucleoprotein A1 (hnRNP A1) as the main target degraded by the 3 C protease. This study suggests that viral protease mRNA could be a promising broad-spectrum antitumor therapeutic.


Conflict of interest statement

Competing interests: The authors declare no competing interests.

Figures

Fig. 1
Fig. 1. 3C-mRNA inhibits the viability and proliferation of GBM cells.
a Schematic showing the mRNA construct containing the EV71 3 C transcript for expression in cells following transfection. The mRNA begins with an m7G cap, indicated in pink. Following the m7G cap is the 5’UTR, shown in green. The central and most substantial part of the molecule is the EV71 3 C coding sequence, depicted in purple. This region is flanked by the 3’UTR, shown in green, similar to the 5’UTR. The 3’ end of the mRNA is the poly(A) tail, shown in light blue. b Western blot analysis of the 3 C protein in U87 MG and U138 MG cells transfected with 3C-mRNAs (2.5 μg, 3 μg, or 3.5 μg). c Cell viability assay of U87 MG and U138 MG cells transfected with different concentrations of 3C-mRNA for 24 h. d Cell viability assay of cells transfected with different concentrations of 3C-mRNA and grown in the presence of AG7088 (10 µM, 1 µM, or 0 µM) for 24 h. e Cell viability assay of cells transfected with different concentrations of 3C-mRNA or 3 C(C147S)-mRNA for 24 h. f Cell proliferation ability of U87 MG and U138 MG cells treated with different concentrations of 3C-mRNA, 3 C(C147S)-mRNA (1.5 μg/ml), or 3C-mRNA+AG7088. Scale bars, 50 μm. cf The data are presented as the means ± SDs. n = 3 independent biological samples. Statistical differences in pane (f) were assessed using one-way ANOVA with the Bonferroni multiple comparisons test. ****P < 0.0001, n.s.= not significant. Source data are provided as a Source Data file.
Fig. 2
Fig. 2. 3C-mRNA inhibits the proliferation, migration and invasion of GBM cells and promotes cell apoptosis.
U87 MG and U138 MG cells were transfected with 3C-mRNA (0.5 μg/mL, 1 μg/mL, or 1.5 μg/mL), 3 C(C147S)-mRNA (1.5 μg/mL), or 3C-mRNA (1.5 μg/mL) + AG7088 (10 μM). a Cell migration ability of U87 MG and U138 MG cells subjected to different treatments, as determined by an in vitro Transwell migration assay. b Cell invasion ability of U87 MG and U138 MG cells subjected to different treatments, as determined by an in vitro Transwell invasion assay. Scale bar: 338.89 μm. c, d Apoptosis was assessed 24 h after transfection with different concentrations of 3C-mRNA, 3 C(C147S)-mRNA, or 3C-mRNA+AG7088. The data are presented as the means ± SDs. n = 3 independent biological samples. Statistical differences were assessed using one-way ANOVA with the Dunnett multiple comparisons test. **P < 0.01, ***P < 0.001, ****P < 0.0001, n.s. = not significant. Source data are provided as a Source Data file.
Fig. 3
Fig. 3. 3C-LNPs suppress tumor growth and development in an orthotopic glioblastoma model.
a Timeline of tumor implantation and treatment schedule in the intracranial glioblastoma model. Mice with orthotopic U87 MG-luc tumors were intracranially administered 3C-LNPs (1.2 μg/week or 2.4 μg/week), 3 C(C147S)-LNPs (2.4 μg/week) or an equal volume of PBS. b and c Bioluminescence images of luciferase-expressing U87 MG-luc tumors obtained after 1, 2, 3, 4 and 5 weeks of treatment (n = 6 mice/group). The data are presented as the means ± SEMs. Statistical differences were assessed via mixed effects with the Dunnett multiple comparisons test. ****P < 0.0001, n.s.= not significant. d Survival was assessed in the U87 MG-luc orthotopic mouse model using the log-rank (Mantel–Cox) test (n = 6 mice/group). e Body weight changes in tumor-bearing mice (n = 6 mice/group). f Representative H&E staining of tumor tissues from tumor-bearing mice from 6 mice/group. Scale bar, 500 μm. g Timeline of the tumor vascular microcirculation monitoring test in orthotopic U87 MG-luc tumor-bearing mice treated with 3C-LNPs (2.4 μg/week for two weeks) or PBS. h Representative images of the functional vasculature of 3C-LNP-treated or PBS-treated tumors (n = 3 mice/group). Scale bar: 1 mm. The data are presented as the means ± SEMs. Statistical differences were assessed using a two-tailed unpaired t test. *P < 0.05, **P < 0.01, ****P < 0.0001, n.s.= not significant. Source data are provided as a Source Data file.
Fig. 4
Fig. 4. Tumor suppression by 3C-LNPs in a breast tumor model.
a Timeline of tumor implantation and treatment schedule in the orthotopic breast tumor model. Mice were subcutaneously injected around the tumor tissues with PBS, 3C-LNPs (1.5 μg), or 3C-LNPs (3 μg) every 3 days for a total of four doses. b Representative images of tumors after treatment with PBS or 3C-LNPs (n = 6 mice/group). c Growth curves of tumors from tumor-bearing mice after treatment with PBS or 3C-LNPs (n = 6 mice/group). The data are presented as the means ± SEMs. Statistical differences were assessed using Mixed-effects with the Dunnett multiple comparisons test. ***P < 0.001, ****P < 0.0001. d Changes in tumor weight in tumor-bearing mice after the indicated treatments (n = 6 mice/group). The data are presented as the means ± SEMs. Statistical differences were assessed using one-way ANOVA with the Bonferroni multiple comparisons test. *P < 0.05, **P < 0.01. e Schematic showing the timeline of the tumor vascular microcirculation monitoring test. The tumor-bearing mice were treated with 3C-LNPs (3 μg every 3 days for four doses) and PBS. f Representative images of the functional vasculature of tumors from mice administered 3C-LNPs and from those administered PBS (n = 3 mice/group). Scale bar: 1 mm. The data are presented as the means ± SEMs. Statistical differences were assessed using a two-tailed unpaired t test. *P < 0.05, **P < 0.01, ***P < 0.001, ****P < 0.0001. Source data are provided as a Source Data file.
Fig. 5
Fig. 5. Therapeutic efficacy of 3C-LNPs in an orthotopic HCC model.
a Timeline of tumor implantation and treatment schedule in the orthotopic (HCC) model. Mice were intravenously injected with PBS or 3C-LNPs (0.4 mg/kg) once every 7 days for a total of 3 doses. b and c Bioluminescence images of luciferase-expressing Huh7-luc tumors after 1, 2, 3, 4 and 5 weeks of treatment (n = 6 mice/group). The data are presented as the means ± SEMs. Statistical differences were assessed using Mixed-effects with the Bonferroni multiple comparisons test. ****P < 0.0001. d Survival curve of the Huh7-luc orthotopic mouse model. Survival analysis was assessed using the log-rank (Mantel–Cox) test. ***P < 0.001. e Changes in the body weights of the tumor-bearing mice in different groups (n = 6 mice/group). f Representative H&E staining of tumor tissues from 6 tumor-bearing mice/group. Scale bar: 1000 μm. g Schematic showing the timeline of the tumor vascular microcirculation monitoring test. The tumor-bearing mice were treated with 3C-LNPs (0.4 mg/kg) and PBS. h Representative images of the functional vasculature of tumors from mice administered 3C-LNPs or PBS (n = 3 mice/group). Scale bar: 1 mm. The data are presented as the means ± SEMs. Statistical differences were assessed using a two-tailed unpaired t-test. **P < 0.01, ***P < 0.001. Source data are provided as a Source Data file.
Fig. 6
Fig. 6. Safety evaluation of 3C-LNPs.
ad BALB/c female nude mice were intracranially administered 1.2 μg of 3C-LNPs twice per week for 3 weeks. b and c Body weight and survival curves of mice intracranially administered 3C-LNPs (n = 6 mice/group). d Histopathological examination of major organs collected after the animals were administered PBS or 3C-LNPs (n = 6 mice/group). Scale bar: 100 µm. ej BALB/c mice were intravenously administered with 0.43 mg/kg or 0.65 mg/kg 3C-LNPs once a week for six weeks. f, g Body weight and survival curves of BALB/c mice (n = 6 mice/group). Liver function (h) (aspartate aminotransferase (AST), alanine transaminase (ALT), and alkaline phosphatase (ALP)) and total blood cell counts. The data are presented as the means ± SEMs. Statistical differences were assessed using one-way ANOVA with the Dunnett multiple comparisons test. i were evaluated 4 weeks after six weeks of treatment (n = 3 mice/group). The data are presented as the means ± SEMs. Statistical differences were assessed using Multiple t-test with the Dunnett multiple comparisons test. n.s.=not significant. Source data are provided as a Source Data file.
Fig. 7
Fig. 7. Ectopic expression of 3 C protease decreases the level of hnRNP A1 and induces apoptosis through cleavage of hnRNP A1.
a Western blot analysis of MVP, PDIA6, hnRNP A1 and 3 C expression in U87 MG and U138 MG cells transfected with 3C-mRNA and 3 C(C147S)-mRNA and in cells transfected with 3C-mRNA and treated with AG7088. Representative blot images are shown. b The hnRNP A1 protein level decreased with increasing concentrations of 3C-mRNA. c Western blot analysis of hnRNPA1, Apaf1, Caspase-3, and cleaved-caspase-3 expression and 3 C expression in U87 MG and U138 MG cells transfected with 3C-mRNA and 3 C(C147S)-mRNA. d Western blot analysis of cleaved caspase-3, hnRNPA1, and 3 C expression in U87 MG-WT and U87 MG-hnRNP A1 KO cells transfected with 3C-mRNA and 3 C(C147S)-mRNA. Panels (ad) are from 3 independent experiments. e Cell viability assay of U87 MG-WT and U87 MG-hnRNP A1 KO cells transfected with different concentrations of 3C-mRNA for 24 h. The data are presented as the means ± SDs. n = 3 independent biological samples. f The proposed 3 C protease–hnRNP A1–apaf-1–caspase-3–cleaved caspase-3-apoptosis axis. Source data are provided as a Source Data file.
Fig. 8
Fig. 8. Schematic illustration of apoptosis and tumor regression induced by EV 3C-mRNA.
The enterovirus 3 C protease mRNA was encapsulated into lipid nanoparticles to produce the 3C-LNPs, which efficiently induce tumor cell apoptosis by directly degrading hnRNP A1 and then activating caspase-3. Three dosing routes were tested in different mouse tumor models, each of which was shown to be highly efficacious in vivo. Intracranial (i.c.), subcutaneous (s.c.), or intravenous (i.v.) delivery routes were used for mouse tumor models of glioblastoma in the brain, breast cancer in the mammary gland, or hepatoma in the liver, respectively.

References

    1. Yu, M., Lin, L., Zhou, D. & Liu, S. Interaction design in mRNA delivery systems. J. Control Release377, 413–426 (2025). - PubMed
    1. Hamouda, A. E. I. et al. Intratumoral delivery of lipid nanoparticle-formulated mRNA encoding IL-21, IL-7, and 4-1BBL induces systemic anti-tumor immunity. Nat. Commun.15, 10635 (2024). - PMC - PubMed
    1. Swingle, K. L., Hamilton, A. G. & Mitchell, M. J. Lipid nanoparticle-mediated delivery of mRNA therapeutics and vaccines. Trends Mol. Med27, 616–617 (2021). - PubMed
    1. Hou, X., Zaks, T., Langer, R. & Dong, Y. Lipid nanoparticles for mRNA delivery. Nat. Rev. Mater.6, 1078–1094 (2021). - PMC - PubMed
    1. Blass, E. & Ott, P. A. Advances in the development of personalized neoantigen-based therapeutic cancer vaccines. Nat. Rev. Clin. Oncol.18, 215–229 (2021). - PMC - PubMed

MeSH terms

LinkOut - more resources