. 2025 May 8;16(1):4292.
doi: 10.1038/s41467-025-59310-3.

Metabolic reprogramming driven by Ant2 deficiency augments T Cell function and anti-tumor immunity in mice

Affiliations

Metabolic reprogramming driven by Ant2 deficiency augments T Cell function and anti-tumor immunity in mice

Omri Yosef et al. Nat Commun. .

Abstract

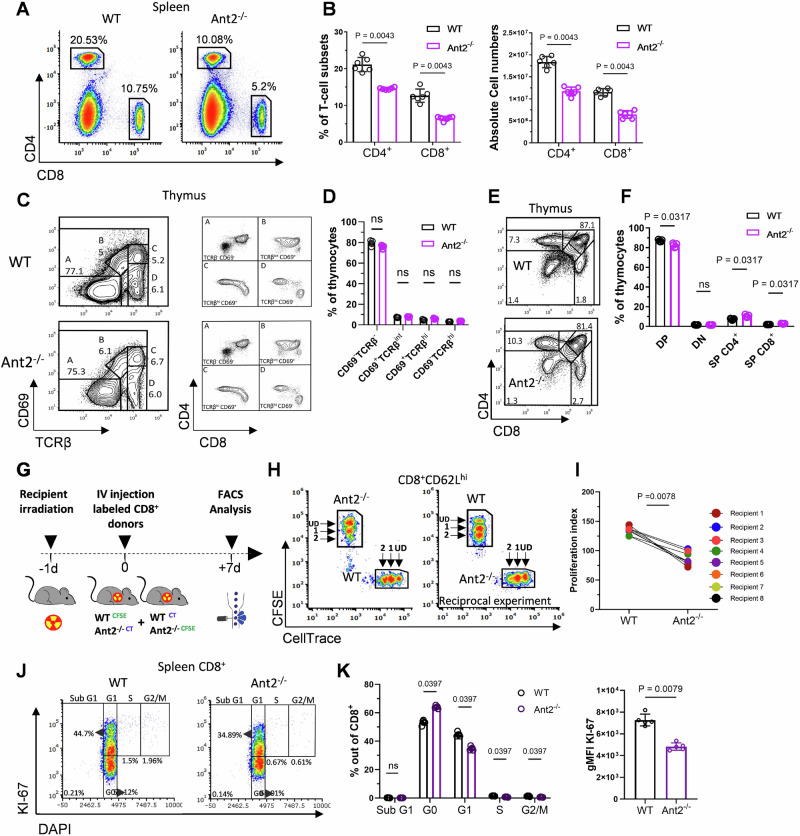
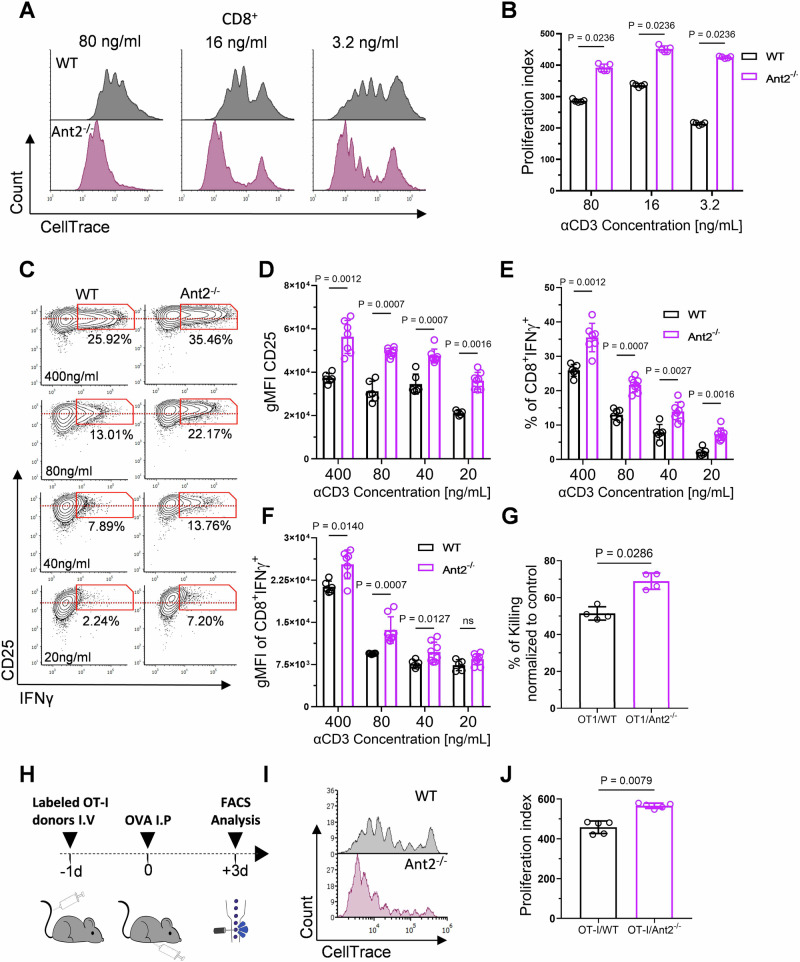
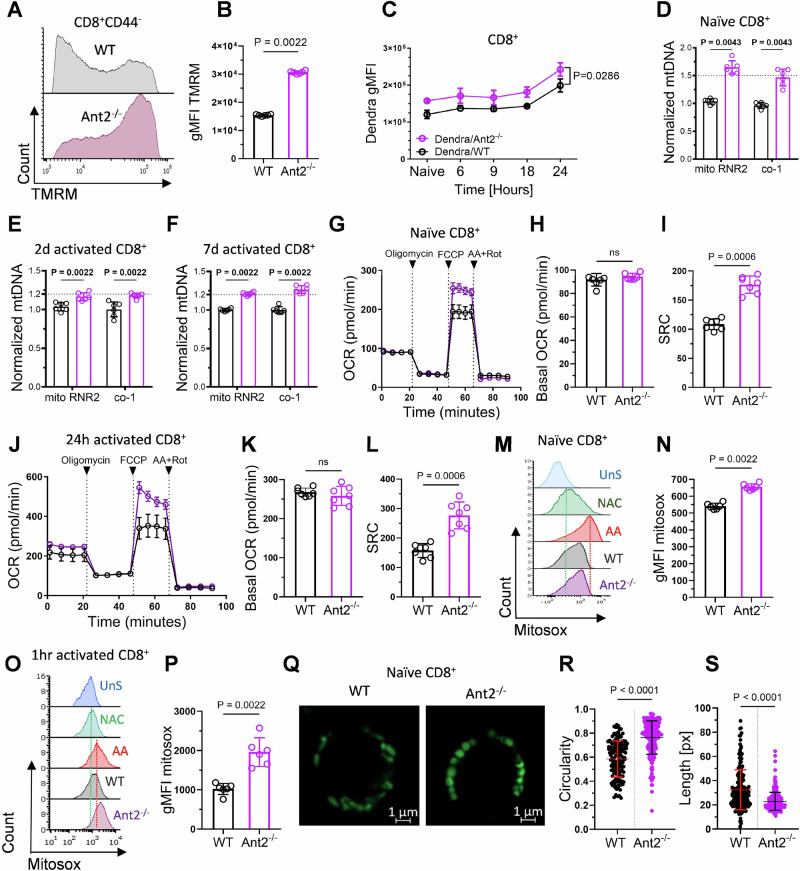
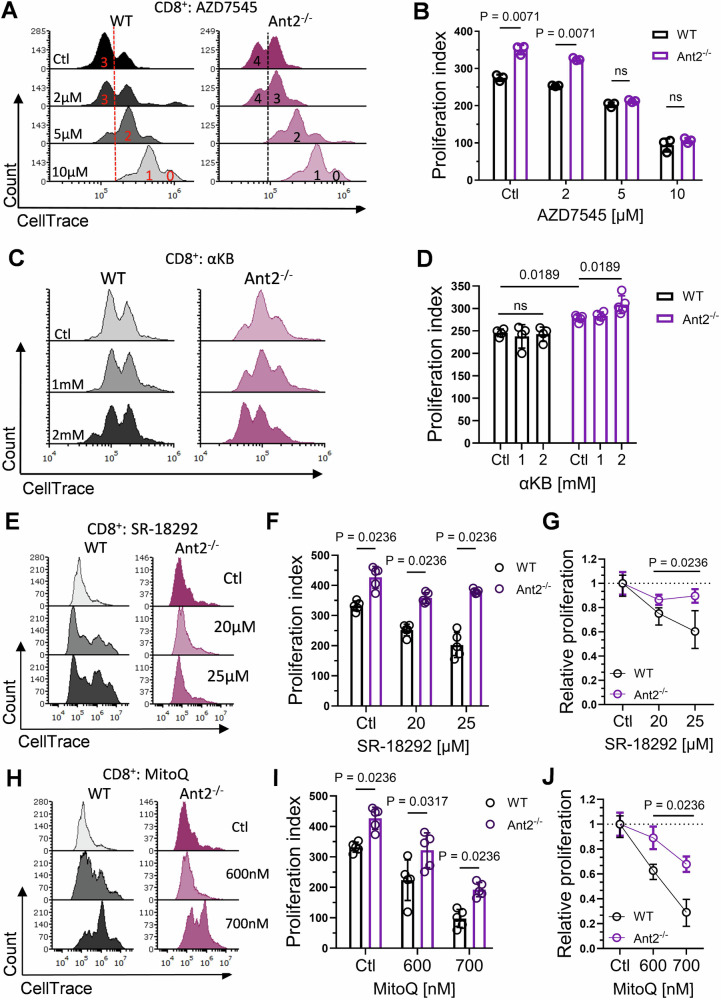
T cell activation requires a substantial increase in NAD+ production, often exceeding the capacity of oxidative phosphorylation (OXPHOS). To investigate how T cells adapt to this metabolic challenge, we generate T cell-specific ADP/ATP translocase-2 knockout (Ant2-/-) mice. Loss of Ant2, a crucial protein mediating ADP/ATP exchange between mitochondria and cytoplasm, induces OXPHOS restriction by limiting ATP synthase activity, thereby impeding NAD+ regeneration. Interestingly, Ant2-/- naïve T cells exhibit enhanced activation, proliferation and effector functions compared to wild-type controls. Metabolic profiling reveals that these T cells adopt an activated-like metabolic program with increased mitobiogenesis and anabolism. Lastly, pharmacological inhibition of ANT in wild-type T cells recapitulates the Ant2-/- phenotype and improves adoptive T cell therapy of cancer in mouse models. Our findings thus suggest that Ant2-deficient T cells bypass the typical metabolic reprogramming required for activation, leading to enhanced T cell function and highlighting the therapeutic potential of targeting ANT for immune modulation.


Conflict of interest statement

Competing interests: The authors declare no competing interests.

Figures

Fig. 1
Fig. 1. Impaired homeostatic expansion of Ant2−/− T cells.
A Representative flow cytometry plots showing the frequency of CD4+ and CD8+ T cells in the spleen from WT and Ant2−/− littermate mice (6–9 weeks old). B Bar graphs summarizing the results in (A), indicating percentages (left) and absolute cell numbers (right) (n = 6). CF Analysis of thymus development of WT and Ant2−/− littermate mice (6–9 weeks old). C Left panel: representative flow cytometry plots showing four developmental stages (AD), distinguished by CD69 vs TCRβ staining of whole thymocytes. Right panel: CD4 vs. CD8 staining gated on each of the developmental stages, (AD). D Bar graph summarizing the results shown in (C), left panel (n = 5). E Representative flow cytometry plots showing the frequency of CD4 vs. CD8 in the thymus-derived from 6 to 9 weeks old WT and Ant2−/− littermate mice. F Bar graph summarizing the results of panel (F). DP-double positive, DN-double negative, and SP-single positive. G Schematic of homeostatic expansion experiment; co-adoptive transfer of CFSE-labeled WT, and CellTrace-labeled Ant2−/− -derived splenocytes to sub-lethally irradiated recipient mice. The reciprocal experiment was also performed. H Representative flow cytometry plots showing CFSE vs CellTrace intensities gated on donor CD8+ CD62Lhi T cells. I Graph depicting paired proliferation indexes of donor WT and Ant2−/− CD8+ T cells (n = 8). JK Ki-67 and cell cycle analysis of CD8+ T cells (J) Representative flow cytometry plots of DAPI vs Ki-67 gated on CD8+ T cells. K Bar graphs summarizing the results in (J), as the percentages of cells in each of the cell cycle stages (left) and total gMFI of Ki-67 (right) (n = 5). Statistical method: Two-tailed Mann–Whitney test (B, D, F, K), or two-tailed Wilcoxon matched-pairs signed rank test (I). Data are represented as mean ± S.D. n refers to the number of biologically independent samples. ns = not significant. Source data are provided as a Source Data file.
Fig. 2
Fig. 2. Intact T-cell mediated immunity in Ant2−/− mice.
A Schematic representation of the immunization experiment used to estimate CD4+ T-cell responses. WT and Ant2-/- mice were immunized three times at 7-day intervals. The first two immunizations included OVA protein in complete Freund’s adjuvant (CFA), while the third included OVA without CFA. One week after the third injection the concentration of, OVA-specific IgG1 (WT; n = 10, Ant2−/−; n = 9) (B) and IgG2a (WT; n = 11, Ant2−/−; n = 8) (C), as well as the cytokines IFNγ (WT; n = 12, Ant2-/-; n = 9) (D) and IL-4 (WT; n = 14, Ant2−/−; n = 7) (E), were measured in the serum of the mice using enzyme-linked immunosorbent assay (ELISA). FK WT and Ant2−/− littermate mice were primed intradermally in the left ear-pinna with 5 × 106 transduction units (TU) of lentivirus expressing OVA (LvOVA). Seven days post-infection, cervical lymph nodes (LN) were dissected, and single cells were stained for activation-related surface markers. F Representative flow cytometry plots showing CD62L vs. CD44 gated on CD8+Vα2+ T cells. G Bar graph summarizing the results shown in F (WT; n = 6, Ant2−/−; n = 5). H Absolute cell number of CD8+Vα2+CD44+CD62L in the cervical LN of WT and Ant2−/− mice. I Representative flow cytometry plots showing CD62L vs. CD25 gated on CD8+Vα2+ T cells. (J): Bar graph summarizing the results shown in (I) (WT; n = 6, Ant2−/−; n = 5). K Absolute cell number of CD8+Vα2+CD25+CD62L in the cervical LN of WT and Ant2−/− mice. Statistical method: Two-tailed Mann–Whitney test. Data are represented as mean ± S.D. n refers to the number of biologically independent samples. ns =  not significant. Source data are provided as a Source Data file.
Fig. 3
Fig. 3. Increased activation potential and effector functions of Ant2-/- CD8+ T cells.
A Representative flow cytometry histograms of CellTrace intensity gated on CD8+ T cells derived from WT or Ant2−/− mice, 72 h post-activation with the indicated concentrations of αCD3 antibody and half the amount of αCD28 antibody. B Bar graph summarizing the results in A as a proliferation index (n = 5). C Representative flow cytometry histograms showing intracellular IFNγ vs. CD25 gated on CD8+ T cells derived from WT or Ant2−/− mice, 24 h post-activation with the indicated concentrations of αCD3 antibody and half amount of αCD28. DF Bar graphs summarizing the results shown in (C) (WT; n = 6, Ant2−/−; n = 8), as geometric mean fluorescence intensity (gMFI) of CD25 (D), the frequency of CD8+IFNγ+ T cells (E), and gMFI of IFNγ gated on CD8+IFNγ+CD25+ (F). G Graph depicts the percentage of killed target B16-OVA melanoma cells after a 6-h incubation at a 1:1 ratio with WT or Ant2−/− OT-I CD8+ T cells activated for 5 days. Target cell viability was assessed using an MTT assay after three washes with PBS (n = 4). H Schematic of the adoptive transfer experiment testing activation of naïve CD8+ T cells. CD45.1+/+ WT recipient mice were intravenously administered CellTrace-labeled CD45.2+/+ T cells derived from WT or Ant2−/− OT-1 mice. After one day, recipient mice were intraperitoneally injected with 50 µg of OVA. On day three following cell transfer splenocytes from the mice were examined by flow cytometry for CellTrace intensity. I Representative flow cytometry histograms of CellTrace intensity gated on donor (CD45.2+/+) CD8+ T cells. J Graph depicting the proliferation index of donor WT and Ant2−/− OT-I T cells (n = 5). Statistical method: Two-tailed Mann–Whitney test. Data are represented as mean ± S.D. n refers to the number of biologically independent samples. ns = not significant. Source data are provided as a Source Data file.
Fig. 4
Fig. 4. Increased biomass, and altered function, of mitochondria in Ant2−/− T cells.
A Representative flow cytometry histogram of TMRM staining gated on naïve (CD44) CD8+ T cells. B Bar graph summarizing the results shown in A (n = 6). C Graph summarizes mtDendra2 intensity of naïve and activated CD8+ T cells derived from WT and Ant2−/− mito-Dendra2 mice at the indicated time points post activation (n = 4). Relative expression of mitochondrial DNA (mtDNA) in naïve (D), activated for 2 d (E) or activated for 7 d (F) WT or Ant2−/− CD8+ T cells, measured by RT-PCR using 2 different set of primers targeted to amplify two independent mitochondrial genes, Rnr2 and Co-1. Results were normalized to the expression of the nuclear gene, β2m (n = 6). G Continuous dot graph of oxygen consumption rate (OCR) measured by Seahorse XF96, following consecutive injections of Oligomycin [1 µM], FCCP [2 µM], Rotenone + Antimycin-A [1 µM] (AA + Rot) of isolated naïve CD8+ T cell from WT (black) or Ant2−/− (purple) mice at the indicated time points. H, I Bar graphs summarizing the results shown in (G), as basal OCR (H) and spare respiratory capacity (SRC) (WT; n = 7, Ant2−/−; n = 6) (I). SRC is calculated as the maximal OCR (after FCCP injection) minus Basal OCR. J Same as in G using activated CD8+ T cells for 24 h. K, L Bar graphs summarizing the results shown in (J), as basal OCR (K), and SRC (L) (n = 7). MP Representative flow cytometry histograms of MitoSOX staining gated on (M) Unstimulated (naïve) and (O) 1-h activated CD8+ T cells (n = 6). WT CD8+ T cells were used as controls, with the following conditions from top to bottom: unstained (UnS), pre-treated with 200 µM N-Acetyl Cysteine (NAC), and treated with 1 µM Antimycin A (AA). N, P Bar graphs summarizing the results of M (unstimulated) and O (stimulated) CD8+CD44 T cells as gMFI of MitoSOX, respectively (QS) Representative live imaging of mitochondrial morphology in purified CD8+ T cells derived from WT and Ant2−/− mitoDendra2 littermate mice. RS Quantitative analysis of the images for measurements of mitochondria length (R) and circularity (S). Over n = 300 mitochondria were analyzed for each genotype (WT-319, Ant2−/− = 473). Statistical method: Two-tailed Mann–Whitney test (BF, H, I, K, L, N, P), or unpaired t-test (R, S). Data are represented as mean ± S.D (BF, H, I, KS), or as mean ± SEM (G, J). n refers to the number of biologically independent samples. ns = not significant. Source data are provided as a Source Data file.
Fig. 5
Fig. 5. Altered proteome and distinct mitochondria in naïve Ant2-/- CD8+ T cells.
AD Mass-spectrometry analysis was performed on protein extracts from naïve (CD44) CD8+ T cells derived from WT or Ant2−/− OT-I mice (WT: n = 4, Ant2−/−: n = 5). A Volcano plot displaying differentially expressed proteins (relative peptide abundances). The negative logarithm of statistical significance (p value) is plotted against the fold change magnitude. Prior to imputation from a normal distribution, Label-Free Quantitation (LFQ) levels were log2-transformed. Red dots represent mitochondrial-associated proteins sourced from MitoCarta2.0. B Principal component analysis comparing the log2-transformed data of all mitochondrial-associated proteins. The first two principal components, which capture the highest variance in the data, are depicted. Heatmaps illustrating differentially expressed proteins associated with oxidative phosphorylation and tricarboxylic acid cycle (C), as well as reactive oxygen species regulation and glutathione synthesis (D). The heatmaps were generated based on the log2 fold change values of individual genes between the two compared samples. The color gradient ranges from red, indicating a significant fold change, to blue, representing a minor fold change. Statistical method: Two-tailed multiple t-tests, FDR < 0.05, S0 < 0.1 (A), or Benjamini-Hochberg method (FDR < 0.05) (B), or Student’s t test analysis conducted on log2-transformed data after the Z-score normalization step (C, D). Data are represented as mean ± S.D. n refers to the number of biologically independent samples. Source data are provided as a Source Data file.
Fig. 6
Fig. 6. Metabolomic adaptations of naïve Ant2-/- CD8+ T cells.
AO Comparison of area under the curve (AUC) values from metabolomics analysis using 13C6-glucose (red) or 13C5-glutamine (blue) tracing alongside Label-Free Quantitation (LFQ) values from proteomics analysis in naïve (CD44) WT and Ant2−/− CD8+ T cells. A Bar graph showing the ratio between the AUC values of unlabeled Phosphocreatine (Pcr) and Creatinine (n = 6). B Bar graph displaying the LFQ values of Creatine Kinase (WT: n = 4, Ant2−/−: n = 5). C Bar graph demonstrating the NAD+/NADH ratio (n = 6). DH LC-MS measurements of labeling patterns for glycolytic derivatives after [13C6]-glucose tracing. Bar graphs display AUC values of alanine m + 3 (D, F), and pyruvate m + 3 (E, G) in the cell and media fractions, respectively, and lactate m + 3 in the media fraction (n = 6) (H). Bar graphs showing LFQ values of P5CS (I) and PYCR2 (J) (WT: n = 4, Ant2−/−: n = 5). KN Bar graphs displaying AUC from LC-MS measurements of proline labeling patterns (n = 6). K Bar graph showing AUC values for 13C6-glucose-derived proline (m + 2) in the cell fraction. L, M Bar graphs showing AUC values for 13C5-glutamine-derived proline (m + 3 and m + 5) in the cell and media fraction, respectively, and AUC values for proline (m + 5) in the media fraction (N). O Heatmap illustrating differentially expressed unlabeled nucleotides and their precursors. The heatmap was generated based on the log2 fold change of individual metabolites (n = 5). P Bar graphs illustrating the (m + 3) to (m + 2) ratio of specific TCA-cycle intermediates and TCA-cycle-derived metabolites in naïve (CD44) WT and Ant2−/− CD8+ T cells (n = 6). Q Representative immunoblot analysis of whole-protein extracts from purified WT and Ant2−/− CD8+ cells using anti-tPDH and pPDHser300 antibodies. Anti-tubulin was used as a loading control (pooling of n = 3). Statistical method: two-tailed Mann–Whitney test (AN, P), or Student’s t test analysis conducted on log2-transformed data after the Z-score normalization step (O). Data represented as the mean ± S.D. n refers to the number of biologically independent samples. ns = not significant. Source data are provided as a Source Data file.
Fig. 7
Fig. 7. Reduced NAD+/NADH ratio-driven metabolic adaptations and mitochondrial reprogramming underlie enhanced proliferation in Ant2-deficient T cells.
A Representative flow cytometry histograms depict the CellTrace intensity of activated CD8+ T cells derived from WT or Ant2−/− mice, treated with AZD7545 at the indicated concentrations. B Bar graph summarizing the results in A as a proliferation index (n = 3). C Same as (A) for cells treated with α-ketobutyrate at the indicated concentrations. D Bar graph summarizing the results in (C) as a proliferation index (WT: n = 4, Ant2−/−: n = 5). E Same as A for cells treated with SR-18292 at the indicated concentrations. F Bar graph summarizing the results in (E) as a proliferation index (n = 5). G Graph showing the relative proliferation of WT or Ant2−/− CD8+ T cells treated with the indicated concentrations of SR-18292. Relative proliferation was assessed by calculating the ratio of each treated sample’s P. index to the average P. index of the corresponding untreated control (WT or Ant2−/−). H Same as (A) for cells treated with MitoQ at the indicated concentrations. I Bar graph summarizing the results in (H) as a proliferation index (n = 5). J Same as G for cells treated with MitoQ. Statistical method: two-tailed Mann–Whitney test (B, F, G, I, J), or two-ways ANOVA (D). Data are represented as mean ± S.D. n refers to the number of biologically independent samples. ns = not significant. Source data are provided as a Source Data file.
Fig. 8
Fig. 8. Pharmacological inhibition of ANT heightens naïve T cell responsiveness to activation stimuli.
A Schematic of adoptive transfer: WT mice received daily i.p. injections of CATR or PBS for 14 days. Splenocytes were CellTrace-stained and transferred to WT recipients. Recipients received OVA i.p. one day post-transfer. Three days post-transfer, splenocytes were analyzed for CellTrace intensity and ex vivo restimulation with SIINFEKL peptide. B Representative flow cytometry histograms showing CellTrace intensity gated on donor PBS-treated (gray) or CATR-treated (red) WT OT-I T cells. C Graph depicting proliferation index of donor PBS-treated or CATR-treated WT OT-I T cells (n = 6). D Representative flow cytometry plots showing CD8 vs. IFNγ staining gated on donor PBS-treated (left) or CATR-treated (right) WT OT-I T cells. E Bar graphs summarizing the results shown in D as the frequency of CD8+IFNγ+ T cells (left), and gMFI of IFNγ gated on CD8+IFNγ+ T cells (right) (n = 6). FK Female mice were injected subcutaneously with 1 × 106 B16-OVA tumor cells. Mice were then divided into three groups (n = 5 per group): control (no adoptive transfer), OT-I untreated, and ATR-treated OT-I CD8+ T cell adoptive transfer groups. F Intensity of mtDendra2 in naïve OT-I CD8+ T cells after spleen dissection. G Representative flow cytometry plots displaying IFNγ versus granzyme B (GzmB) staining in donor untreated and ATR-treated 24-h activated CD8+ OT-I T cells. H Bar graphs summarizing the frequency of IFNγ+GzmB+ (left), and the gMFI of IFNγ+ cells (middle), and gMFI of GzmB+ cells (right), all gated on donor CD8+ OT-I T cells. I Images of tumors from control, OT-I untreated, and ATR-treated OT-I CD8+ T cell-injected mice at the end of the experiment (Scale bar: 5 mm). J Tumor volume (mm³) was measured daily day 17 post-tumor implantation. K Tumors were excised, weighed, and presented as tumor weight (mg). Statistical method: two-tailed Mann–Whitney test (C, E, F, H), or two-way ANOVA test (J), or Kruskal–Wallis test (K). Data are represented as mean ± S.D for all expect ±SEM (J). n refers to the number of biologically independent samples. ns = not significant. Source data are provided as a Source Data file.
Fig. 9
Fig. 9. Metabolic alternations in Ant2−/− CD8+ T cells.
1) Ant2 deficiency leads to a reduction in mtATP transfer to the cytosol, accompanied by a concomitant decrease in ADP concentrations within the mitochondrial matrix. 2) Functionality of the ATP-synthase complex is hindered, resulting in mitochondrial membrane hyperpolarization and OXPHOS inhibition. 3) Increased aerobic glycolysis and proline biosynthesis for NAD+ regeneration. 4) Increased PC activity as a result of PDH inhibition. 5) Increased cataplerosis (TCA-cycle derived amino-acids). 6) Increased anti-oxidative stress machinery and NADPH consumption. 7) Increased phosphate pentose pathway activity due to increased NADPH consumption.

References

    1. Reina-Campos, M., Scharping, N. E. & Goldrath, A. W. CD8+ T cell metabolism in infection and cancer. Nat. Rev. Immunol.21, 718–738 (2021). - PMC - PubMed
    1. Pearce, E. L., Poffenberger, M. C., Chang, C.-H. & Jones, R. G. Fueling immunity: insights into metabolism and lymphocyte function. Science 342. 10.1126/science.1242454 (2013). - PMC - PubMed
    1. Chapman, N. M., Boothby, M. R. & Chi, H. Metabolic coordination of T cell quiescence and activation. Nat. Rev. Immunol.20, 55–70 (2020). - PubMed
    1. Bantug, G. R., Galluzzi, L., Kroemer, G. & Hess, C. The spectrum of T cell metabolism in health and disease. Nat. Rev. Immunol.18, 19–34 (2018). - PubMed
    1. Wang, R. & Green, D. R. Metabolic checkpoints in activated T cells. Nat. Immunol.13, 907–915 (2012). - PubMed

MeSH terms

LinkOut - more resources