

Estimating transmissibility of Zika virus in Colombia in the presence of surveillance bias
- PMID: 40341193
- PMCID: PMC12062338
- DOI: 10.1038/s41467-025-59655-9
Estimating transmissibility of Zika virus in Colombia in the presence of surveillance bias
Abstract
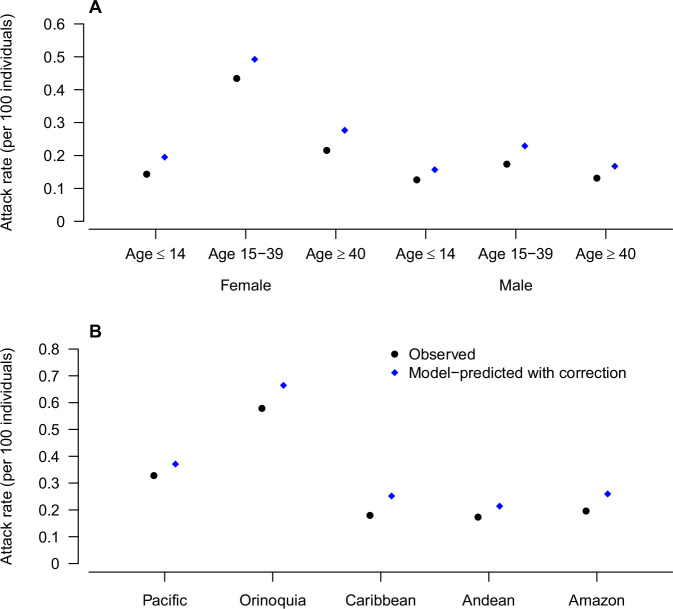
The 2015-2016 Zika virus outbreak in the Americas presented significant challenges in understanding the transmission dynamics due to substantial reporting biases, as women of reproductive age (15-39 years) were disproportionately represented in the surveillance data when public awareness of relationship between Zika and microcephaly increased. Using national surveillance data from Colombia during July 27, 2015-November 21, 2016, we developed a Bayesian hierarchical modeling framework to reconstruct the true numbers of symptomatic cases and estimate transmission parameters while accounting for differential reporting across age-sex groups. Our model revealed that the detection rate of symptomatic cases among women of reproductive age was 99% (95% CI: 98.7-100), compared to 85.4% (95% CI: 84.7-86.1) in other demographic groups. After correcting for these biases, our results showed that females aged 15-39 years remained 82.8% (95% CI: 80.2-85.2%) more susceptible to Zika symptomatic infection than males of the same age, independent of differential reporting areas. Departments with medium-high altitude, medium-high population density, low coverage of forest, or high dengue incidence from 2011-2015 exhibited greater Zika risk. This study underscores the importance of accounting for surveillance biases in epidemiological studies to better understand factors influencing Zika transmission and to inform disease control and prevention.
© 2025. The Author(s).
Conflict of interest statement
Competing interests: All authors report no potential conflicts of interest. Ethics and inclusion statement: This study used publicly available, de-identified surveillance data from the Instituto Nacional de Salud (INS) and regional health departments in Colombia. Since the data were de-identified and publicly available, and no interaction with human subjects occurred, ethical approval was not required for this analysis. Direct collaboration was not established with local researchers; their critical role in data collection is acknowledged in the Acknowledgements. The study adhered to relevant local ethical standards and incorporated local and regional research in its citations, underscoring our commitment to ethical and equitable global research collaborations.
Figures


Similar articles
-
Estimating the numbers of pregnant women infected with Zika virus and infants with congenital microcephaly in Colombia, 2015-2017.J Infect. 2018 Jun;76(6):529-535. doi: 10.1016/j.jinf.2018.02.010. Epub 2018 Apr 6. J Infect. 2018. PMID: 29627357
-
The epidemiology and transmissibility of Zika virus in Girardot and San Andres island, Colombia, September 2015 to January 2016.Euro Surveill. 2016 Jul 14;21(28):10.2807/1560-7917.ES.2016.21.28.30283. doi: 10.2807/1560-7917.ES.2016.21.28.30283. Euro Surveill. 2016. PMID: 27452806 Free PMC article.
-
Zika Virus Disease in Colombia - Preliminary Report.N Engl J Med. 2020 Aug 6;383(6):e44. doi: 10.1056/NEJMoa1604037. Epub 2016 Jun 15. N Engl J Med. 2020. PMID: 27305043
-
Zika virus: lessons learned in Brazil.Microbes Infect. 2018 Dec;20(11-12):661-669. doi: 10.1016/j.micinf.2018.02.008. Epub 2018 Mar 6. Microbes Infect. 2018. PMID: 29501560 Review.
-
Trends of the microcephaly and Zika virus outbreak in Brazil, January-July 2016.Travel Med Infect Dis. 2016 Sep-Oct;14(5):458-463. doi: 10.1016/j.tmaid.2016.09.006. Epub 2016 Oct 1. Travel Med Infect Dis. 2016. PMID: 27702683 Review.
References
-
- World Health Organization. Situation Report-Zika Virus, Microcephaly and Guillain-barré Syndrome. Available from: https://apps.who.int/iris/handle/10665/204961 (2016).
-
- World Health Organization. Situation Report-zika Virus, Microcephaly, Guillain-barré Syndrome. Available from: https://www.who.int/publications/m/item/zika-situation-report (2017).
-
- European Centre for Disease Prevention and Control (ECDC). Rapid Risk Assessment: Zika Virus Infection Outbreak, French Polynesia. (Stockholm: ECDC, 2014).
MeSH terms
LinkOut - more resources
Full Text Sources
Medical
