Pitfalls of bacterial pan-genome analysis approaches: a case study of Mycobacterium tuberculosis and two less clonal bacterial species
- PMID: 40341387
- PMCID: PMC12119186
- DOI: 10.1093/bioinformatics/btaf219
Pitfalls of bacterial pan-genome analysis approaches: a case study of Mycobacterium tuberculosis and two less clonal bacterial species
Abstract
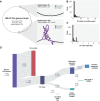
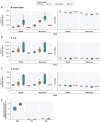
Summary: Pan-genome analysis is a fundamental tool for studying bacterial genome evolution; however, the variety in methods used to define and measure the pan-genome poses challenges to the interpretation and reliability of results. Using Mycobacterium tuberculosis, a clonally evolving bacterium with a small accessory genome, as a model system, we systematically evaluated sources of variability in pan-genome estimates. Our analysis revealed that differences in assembly type (short-read versus hybrid), annotation pipeline, and pan-genome software, significantly impact predictions of core and accessory genome size. Extending our analysis to two additional bacterial species, Escherichia coli and Staphylococcus aureus, we observed consistent tool-dependent biases but species-specific patterns in pan-genome variability. Our findings highlight the importance of integrating nucleotide- and protein-level analyses to improve the reliability and reproducibility of pan-genome studies across diverse bacterial populations.
Availability and implementation: Panqc is freely available under an MIT license at https://github.com/maxgmarin/panqc.
© The Author(s) 2025. Published by Oxford University Press.
Figures


Update of
-
Analysis of the limited M. tuberculosis accessory genome reveals potential pitfalls of pan-genome analysis approaches.bioRxiv [Preprint]. 2024 May 4:2024.03.21.586149. doi: 10.1101/2024.03.21.586149. bioRxiv. 2024. Update in: Bioinformatics. 2025 May 6;41(5):btaf219. doi: 10.1093/bioinformatics/btaf219. PMID: 38585972 Free PMC article. Updated. Preprint.
Similar articles
-
Comparative Genomics of Borderline Oxacillin-Resistant Staphylococcus aureus Detected during a Pseudo-outbreak of Methicillin-Resistant S. aureus in a Neonatal Intensive Care Unit.mBio. 2022 Feb 22;13(1):e0319621. doi: 10.1128/mbio.03196-21. Epub 2022 Jan 18. mBio. 2022. PMID: 35038924 Free PMC article.
-
Prescription of Controlled Substances: Benefits and Risks.2025 Jul 6. In: StatPearls [Internet]. Treasure Island (FL): StatPearls Publishing; 2025 Jan–. 2025 Jul 6. In: StatPearls [Internet]. Treasure Island (FL): StatPearls Publishing; 2025 Jan–. PMID: 30726003 Free Books & Documents.
-
Whole-genome phenotype prediction with machine learning: open problems in bacterial genomics.Bioinformatics. 2025 Jul 1;41(7):btaf206. doi: 10.1093/bioinformatics/btaf206. Bioinformatics. 2025. PMID: 40581074 Free PMC article.
-
Xpert® MTB/RIF assay for extrapulmonary tuberculosis and rifampicin resistance.Cochrane Database Syst Rev. 2018 Aug 27;8(8):CD012768. doi: 10.1002/14651858.CD012768.pub2. Cochrane Database Syst Rev. 2018. Update in: Cochrane Database Syst Rev. 2021 Jan 15;1:CD012768. doi: 10.1002/14651858.CD012768.pub3. PMID: 30148542 Free PMC article. Updated.
-
Xpert® MTB/RIF assay for pulmonary tuberculosis and rifampicin resistance in adults.Cochrane Database Syst Rev. 2013 Jan 31;(1):CD009593. doi: 10.1002/14651858.CD009593.pub2. Cochrane Database Syst Rev. 2013. Update in: Cochrane Database Syst Rev. 2014 Jan 21;(1):CD009593. doi: 10.1002/14651858.CD009593.pub3. PMID: 23440842 Free PMC article. Updated.
Cited by
-
Linkage-based ortholog refinement in bacterial pangenomes with CLARC.Nucleic Acids Res. 2025 Jun 20;53(12):gkaf488. doi: 10.1093/nar/gkaf488. Nucleic Acids Res. 2025. PMID: 40539515 Free PMC article.
-
Sequence Modeling Is Not Evolutionary Reasoning.bioRxiv [Preprint]. 2025 Jun 27:2025.01.17.633626. doi: 10.1101/2025.01.17.633626. bioRxiv. 2025. PMID: 39896621 Free PMC article. Preprint.
References
-
- Banu S, Honoré N, Saint-Joanis B et al. Are the PE-PGRS proteins of Mycobacterium tuberculosis variable surface antigens? Role of PE-PGRS proteins of M. tuberculosis. Mol Microbiol 2002;44:9–19. - PubMed
-
- Behruznia M, Marin M, Farhat MR et al. The Mycobacterium tuberculosis complex pangenome is small and driven by sub-lineage-specific regions of difference. eLife 2024;13:RP97870. 10.7554/eLife.97870.1 . - DOI
MeSH terms
Grants and funding
LinkOut - more resources
Full Text Sources

