. 2025 May 8;16(1):4294.
doi: 10.1038/s41467-025-59638-w.

Targeted disruption of PRC1.1 complex enhances bone remodeling

Affiliations

Targeted disruption of PRC1.1 complex enhances bone remodeling

Liangyu Xing et al. Nat Commun. .

Abstract

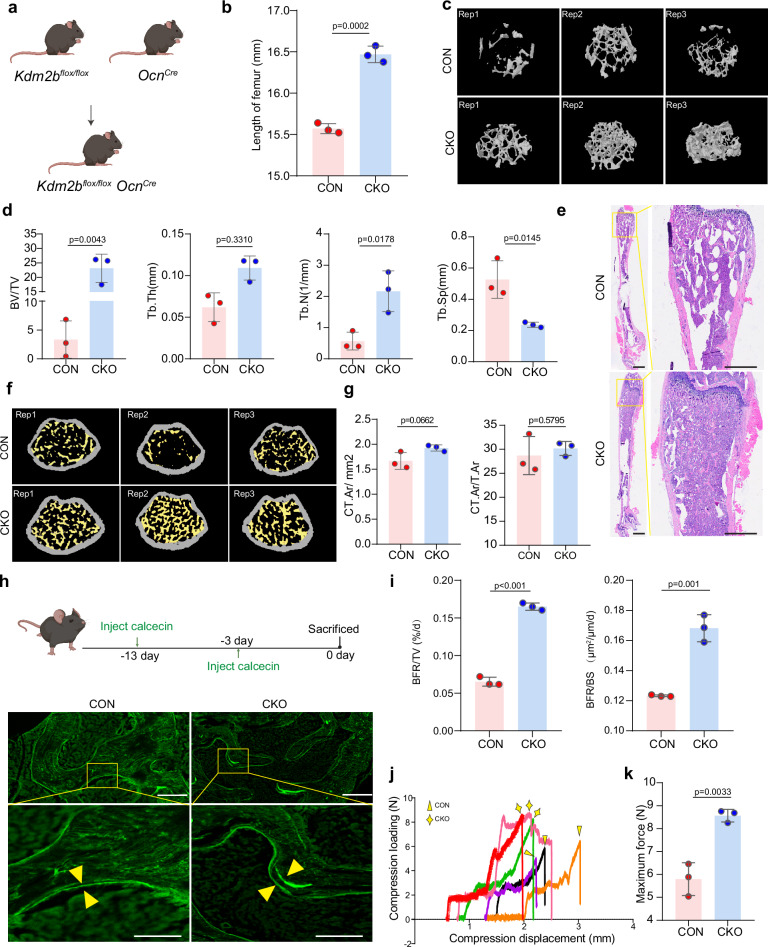
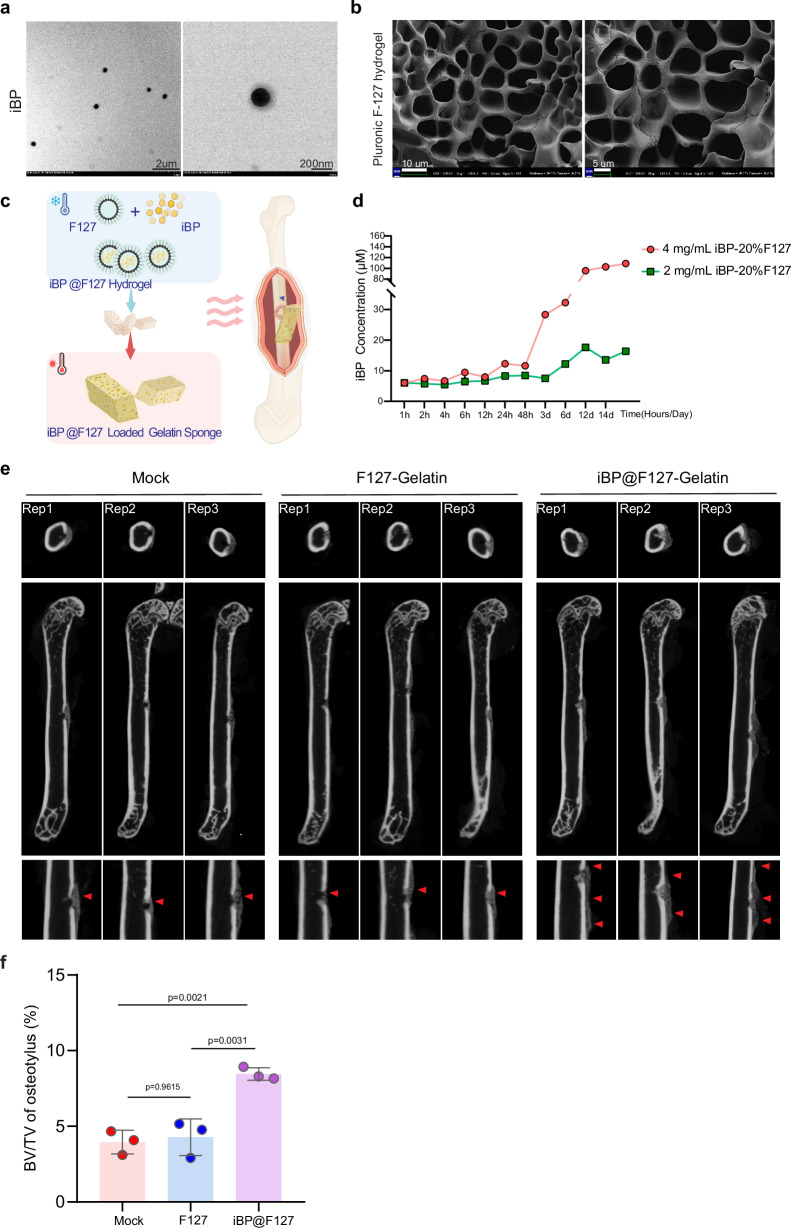
Polycomb repressive complexes (PRCs) are pivotal epigenetic regulators that preserve cell identity by restricting transcription responses to sub-threshold extracellular signals. Their roles in osteoblast function and bone formation remain unclear. Here in aging osteoblasts, we found marked activation of PRC1.1 complex, with KDM2B acting as a chromatin-binding factor and BCOR and PCGF1 enabling histone H2A monoubiquitylation (H2AK119ub1). Osteoblast-specific Kdm2b inactivation significantly enhances bone remodeling under steady-state conditions and in scenarios of bone loss. This enhancement is attributed to H2AK119ub1 downregulation and subsequent Wnt signaling derepression. Furthermore, we developed a small molecule termed iBP, that specifically inhibits the interaction between BCOR and PCGF1, thereby suppressing PRC1.1 activity. Notably, iBP administration promotes bone formation in mouse models of bone loss. Therefore, our findings identify PRC1.1 as a critical epigenetic brake on bone formation and demonstrate that therapeutic targeting of this complex enhances Wnt pathway activation, offering a promising strategy against skeletal deterioration.


Conflict of interest statement

Competing interests: The authors declare no competing interests. Ethics statement: We support inclusive, diverse, and equitable conduct of research.

Figures

Fig. 1
Fig. 1. An aberrant gain of PRC1.1 function is linked to impaired ossification.
a Representative images of scanning sections of mouse femurs at ages of 3 and 18 months. b Volcano plot of DEGs in OBs (n = 3 YOUNG and n = 3 OLD). Upregulated genes are labeled in red and downregulated genes in blue (Wald test, p < 0.05; |Fold change| >1.5). OBs were collected after 14 days of culture by removing the bone fragments. c Heatmap showing mRNA levels of osteocyte aging-associated genes between the two groups, colorscale: Z-Score. d GO enrichment analysis of the biological processes in downDEGs in aged OBs (Fisher’s exact test, p < 0.05). Number of genes and statistical significance are shown. e Heatmap showing mRNA levels of ossification-related genes between the two groups. Colorscale: Z-Score. f, g WB analyses comparing the levels of PRC members and associated histone modifications in OBs from young and aged mice. ACTIN and H3 were used as loading controls, respectively. h Heatmaps showing H2AK119ub1 signals in chromatin of YOUNG and OLD OBs around the peak center (± 5 kb) of H2AK119ub1 target genes. Colors represent CUT&Tag RPM, and rows were ranked by CUT&Tag signals in young group (n = 2 YOUNG and n = 2 OLD). OBs were collected after 14 days of culture by removing the bone fragments. i Boxplots showing quantification of differential H2AK119ub1 enrichment at downDEGs (OLD vs YOUNG, n = 386, Wilcoxon matched-pairs signed rank test, two tailed, p < 0.0001). The boxplots indicate the median (centre line), the third and first quartiles (box limits) and 1.5 × IQR above and below the box (whiskers). j, k The IGV view of increased H2AK119ub1 enrichment at the promoter of representative ossification-related genes and their decreased mRNA levels in aged OBs compared with young group, with Actin serving as a negative control. Signals representing CUT&Tag and RNA-seq RPM. 2 M: 2 months; 3 M:3 months; 8 M:8 months; 18 M:18 months. Source data of (f, g, i) are provided as a Source Data file.
Fig. 2
Fig. 2. KDM2B inactivation in OBs leads to increased bone mass and enhanced bone formation.
a Schematic diagram of construction of CKO mice. b Statistical analysis of femur length of 9-week-old mice (n = 3 per genotype). c Representative images of 3D reconstruction and scanning sections of femurs from control and CKO mice at the age of 9 weeks. d μCT analysis of trabecular parameters (n = 3 per genotype). e Representative images of H&E staining of the whole femur (left) and metaphysis (right) from CKO and control mice. f Representative images of femurs from control and CKO mice, the yellow areas represent trabecular bone and the gray areas represent cortical bone. g μCT analysis of cortical bone parameters (n = 3 per genotype). h, i Schematic diagram of the timeline of the calcein double labeling experiment. Representative images (h) and quantification of calcein double labeling parameters (i) (n = 3 mice per genotype). j Three-point bending experiment, with blue arrows indicating the CKO group and yellow arrows indicating the CON group. k Statistical analysis of the maximum load bearing capacity of fresh unfixed femurs from three-point bending tests (n = 3 mice per genotype). Statistical significance was assessed using Student’s t tests, two-tailed, in (b, d, g, i, k), error bars are presented as mean values ± SD. Scale bar, 1 mm in (e) and 100 μm in (h). CON: Ocn-Cre CKO: Kdm2bfl/fl Ocn-Cre, (a) and (h) created with Biorender (https://biorender.com/w07p252, https://BioRender.com/ibb92gm). Source data of (b, d, e, g, i, j, k) are provided as a Source Data file.
Fig. 3
Fig. 3. KDM2B inactivation boosts OB functions to counteract bone loss and enhance bone repair.
a Representative images of 3D reconstruction and scanning sections of femurs from control and CKO mice at the age of 18 months. b μCT analysis of trabecular parameters (n = 3 mice per genotype). c Representative images of three-dimensional reconstruction and scanning sections of trabecular bone from OVX-CON, OVX-CKO, sham-CON, sham-CKO. d Statistical analysis to compare the BV/TV ratio in designated groups (n = 3 mice per genotype). e Representative images of scanning sections in coronal and sagittal plane of femur of bone defects (three columns on the left) and images of 3D reconstruction of repaired circular bone defect (column on the right) from control and CKO mice. f μCT analysis of BV/TV ratio of newly formed bone between control and CKO group (n = 3 mice per genotype). g Representative images of H&E staining of femur of repaired bone defect from control and CKO mice, box areas shown at a higher magnification. (C cortex, BM bone marrow). Statistical significance was assessed using Student’s t tests, two-tailed, in (b, f), error bars are presented as mean values ± SD. Statistical significance was assessed using Two-Way ANOVA, two-tailed, in (d), error bars are presented as mean values ± SD. Scale bar, 1 mm in low-power field and 100 μm in high-power field of 3 g. sham, sham operation. OVX, Ovariectomy. CON Ocn-Cre, CKO Kdm2bfl/fl Ocn-Cre. Source data of (b, d, f, g) are provided as a Source Data file.
Fig. 4
Fig. 4. KDM2B inactivation enhances OB functions through the activation Wnt signaling.
a Schematic of tdTomato-positive mouse generation. b Fluorescent images of trabecular and cortical bone sections from tdTomato mice. White triangles highlight Tomato-positive OBs in the trabecular region (green dashed line, ~400 μm²), while yellow triangles indicate OBs in the cortical region (yellow box, ~100 μm²). c Quantification of tdTomato-positive cells in periosteum of trabecula and cortex bone (n = 3 mice per genotype). d Workflow for isolation, sorting and analysis of tdTomato-positive OBs. e Volcano plot of DEGs in OBs isolated from 3-months-old mice (n = 3 CON and n = 3 CKO). Upregulated genes are labeled in red and downregulated genes in blue (Wald test, p < 0.05; |Foldchange| >1.5) OBs were collected after 14 days of culture by removing the bone fragments. f and h GO enrichment analysis for biological processes and KEGG enrichment analysis in upDEGs (CKO vs CON (YOUNG), Fisher’s exact test, p < 0.05). Number of genes and statistical significance are shown. g and j RT-qPCR analysis of representative genes in CKO and control OBs. i The heatmap showing the levels of leading genes in Wnt/β-catenin signaling pathway. Gene expression levels are shown as relative Z-Scores between two groups. k WB analysis of β-catenin levels in total protein lysates of femur tissue and tdTomato-positive OBs of control and CKO mice. GAPDH was used as loading control. l WB analysis of cytoplasmic and nuclear β-catenin in tdTomato-positive OBs from control and CKO mice. TUBULIN and H3 were used as fraction-specific controls. m WB analysis of KDM2B levels in KDM2B-WT and KDM2B-CxxC deletion mutant overexpressing MC3T3-E1 cells. n ChIP-qPCR analysis comparing β-catenin enrichment at target genes in differentiated MC3T3-E1 cells (n = 3/group). o Representative images of 3D reconstruction of trabecula bone from CKO mice treated with PBS or LGK974 for 1 month. p µCT analysis of trabecular parameters (n = 4 mice/group). Statistical significance was assessed using Student’s t tests, two-tailed, in (c, g, j, p), error bars are presented as mean values ± SD. Statistical significance was assessed using Two-Way ANOVA, two-tailed, in (n), error bars are presented as mean values ± SD. Scale bar, 100 μm. CON: Ocn Cre td-Tomato, CKO: Kdm2bfl/fl Ocn Cre td-Tomato in (b–i, o, p); CON: empty vector in (m). a and d created with Biorender (https://biorender.com/w07p252, https://biorender.com/p69f867). Source data of (c, g, j, k, l, m, n, p) are provided as a Source Data file.
Fig. 5
Fig. 5. Derepression of the Wnt/β-catenin target genes in KDM2B-inactive OBs is associated with reduced H2AK119ub1 enrichment.
a Heatmaps represent the enrichment for H2AK119ub1 in chromatin of CON and CKO mice around the TSS (± 5 Kb) of H2AK119ub1 target genes. (n = 2 per group). Colors represent CUT&Tag RPM, and rows  are ranked by CUT&Tag signals in CON. b Box plot showing peak intensity of CUT&Tag reads for H2AK119ub described in panel (a). (Wilcoxon matched-pairs signed rank test, two tailed, p < 0.0001) c Quantification of log2-transformed fold change of expression levels of H2AK119ub1 decreased genes (CKO vs CON, n = 759) in promoter region of OBs (n = 3 per group, Wilcoxon matched-pairs signed rank test, two tailed, p < 0.0001). The box plots in (b) and (c) indicate the median (centre line), the third and first quartiles (box limits) and 1.5 × IQR above and below the box (whiskers). (d, e) KEGG enrichment analysis and GO enrichment analysis for biological processes of genes described in (c), (n = 763, Fisher’s exact test, p < 0.05). Number of genes and statistical significance are shown. (f) The IGV view of decreased H2AK119ub1 enrichment at representative Wnt/β-catenin target genes and increased gene expression levels in control and CKO OBs. An intergenic region serves as a negative control. CON: Ocn Cre td-Tomato CKO: Kdm2bfl/fl Ocn Cre td-Tomato. Source data of (b, c) are provided as a Source Data file.
Fig. 6
Fig. 6. Screening and validation of specific PRC1.1 inhibitors.
a Structural model of the binding interface between PCGF1-BCOR complex (PDB: 4HPL). The RAWUL domain of PCGF1 is shown as a surface (carbon in white, oxygen in red, nitrogen in blue, sulfur in yellow), while the PUFD domain of BCOR is depicted as a green cartoon. b Flowchart of screening and verification of PRC1.1 inhibitors. c AlphaScreen assay to show the inhibition of PCGF1RAWUL L238/F242 interaction with BCORPUFD by selected compounds. d Split-GFP system construction. Representative images of each group of transfected 293 T cells are shown. Scale bar, 100 μm. e Quantification of GFP/Hoechst fluorescence intensity in 293 T cells co-transfected with GFP1-10-PCGF1 and GFP11-BCOR, subsequent to treatment with candidate inhibitors. Statistical significance was assessed using One-Way ANOVA, two-tailed, error bars are presented as mean values ± SD (n = 3 per group). f Chemical structure of iBP (Left). Docking model of PCGF1RAWUL (surface) and iBP (orange stick). g AlphaScreen determination of iBP’s IC50 value for inhibiting the interaction between PCGF1RAWUL L238A/F242A and BCORPUFD. h Biolayer interferometry (BLI) analysis of iBP binding to PCGF1RAWUL L238A/F242A. Representative data and 1:1 binding model fit shown as blue and red lines, respectively. i, j Co-IP assay examining how iBP treatment at various concentrations affects the interaction between PCGF1 and BCOR. k ChIP-qPCR analysis comparing H2AK119ub1, PCGF1 and RING1B enrichment at PRC1-target promoters and non-targeted gene bodies as control in control and iBP-treated 293 T cells. Statistical significance was assessed using Two-Way ANOVA, two-tailed, error bars are presented as mean values ± SD (n = 3 ~ 6 per group). Source data of (e, gk) are provided as a Source Data file.
Fig. 7
Fig. 7. iBP treatment enhances OB functions and reverses bone loss in OVX models.
a Volcano plot of DEGs in OBs (n = 3 CON and n = 3 CON-iBP). Upregulated genes are labeled in red and downregulated genes in blue (Wald test, p < 0.05; |Fold change| >1.5). The x-axis shows the log2 (fold change) in gene expression between CKO and control OBs, and the y-axis shows the statistical significance of the differences. OBs were collected after 14 days of culture by removing bone fragments. b GO enrichment analysis for biological processes and KEGG enrichment analysis of upDEGs in (a), (CKO-iBP vs CON, n = 1786, Fisher’s exact test, p < 0.05). Number of genes and statistical significance are shown. c Boxplots showing log2-transformed fold change of expression levels of downDEGs in aged OBs (OLD vs YOUNG, n = 386) following KDM2B ablation or iBP treatment (n = 3 per group, Wilcoxon matched-pairs signed rank test, two tailed, p < 0.0001). The boxplots indicate the median (centre line), the third and first quartiles (box limits) and 1.5 × IQR above and below the box (whiskers). d, e Images of 3D reconstruction of trabecula bone of OVX mice treated with iBP or PBS, with sham group as controls. CT analysis of the distal femur metaphysis. Statistical significance was assessed using One-Way ANOVA, two-tailed, error bars are presented as mean values ± SD, n = 5 per group. f H&E staining of femur of the designated groups of mice. g IHC staining of WNT2, WNT3A and β-catenin in femurs of the designated groups of mice. Scale bar, 1 mm. OVX, Ovariectomy. Source data of (e, f, g) are provided as a Source Data file.
Fig. 8
Fig. 8. iBP treatment accelerates bone healing.
a Images obtained by transmission scanning microscope of iBP. b Images of scanning electron microscope of F127. c Schematic diagram of construction of iBP loaded gelatin sponge -F127 hydrogel. d Statistical analysis of sustained release efficiency of iBP for 14 days. e Representative images of scanned sections and sagittal plane views of femur defects in the designated treatment groups for two weeks. Red triangles indicate the new callus at the sites of circular bone defect. f BV/TV quantification of the osteotylus in (e). Statistical significance was assessed using One-Way ANOVA, two-tailed, error bars are presented as mean values ± SD, n = 3 per group, Mock: A model representing femur defects, F127-Gelatin: femur defects area treated with F127-Gelatin for two weeks, iBP@F127-Gelatin: femur defects area treated with iBP@F127-Gelatin for two weeks. c created with Biorender (https://biorender.com/j89n671). Source data of (a, b, d, f) are provided as a Source Data file.

References

    1. Hadjidakis, D. J. & Androulakis, I. I. Bone remodeling. Ann. N. Y. Acad. Sci.1092, 385–396 (2006). - PubMed
    1. Eriksen, E. F. Cellular mechanisms of bone remodeling. Rev. Endocr. Metab. Disord.11, 219–227 (2010). - PMC - PubMed
    1. Dirckx, N., Moorer, M. C., Clemens, T. L. & Riddle, R. C. The role of osteoblasts in energy homeostasis. Nat. Rev. Endocrinol.15, 651–665 (2019). - PMC - PubMed
    1. Wu, Z. et al. Regulation of bone homeostasis: signaling pathways and therapeutic targets. MedComm (2020)5, e657 (2024). - PMC - PubMed
    1. Schupbach, D., Comeau-Gauthier, M., Harvey, E. & Merle, G. Wnt modulation in bone healing. Bone138, 115491 (2020). - PubMed

MeSH terms

Substances

LinkOut - more resources