. 2025 May 15;39(9):e70573.
doi: 10.1096/fj.202403278R.

Boi-Ogi-To, a Traditional Japanese Kampo Medicine, Promotes Cellular Excretion of Chloride and Water by Activating Volume-Sensitive Outwardly Rectifying Anion Channels

Affiliations

Boi-Ogi-To, a Traditional Japanese Kampo Medicine, Promotes Cellular Excretion of Chloride and Water by Activating Volume-Sensitive Outwardly Rectifying Anion Channels

Kaori Sato-Numata et al. FASEB J. .

Abstract

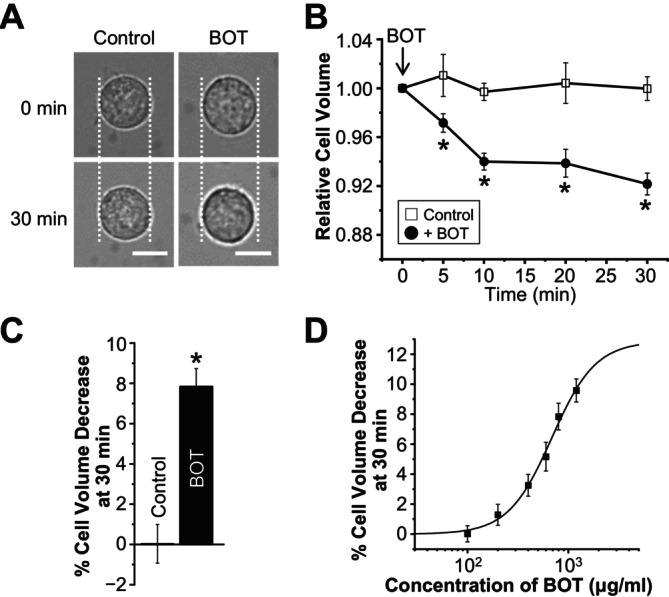
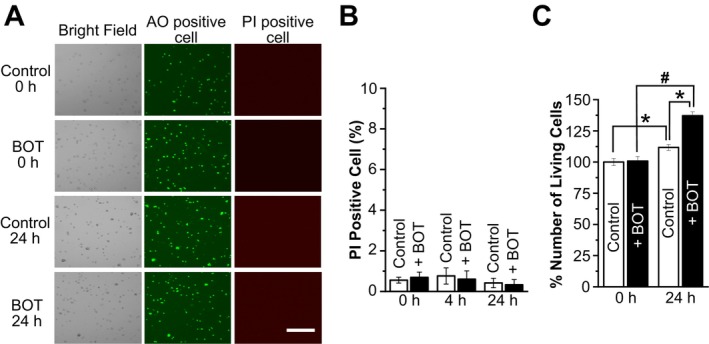
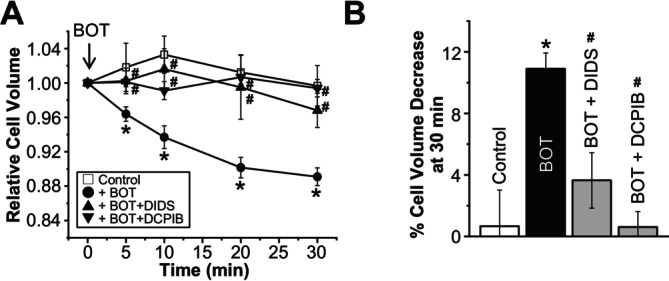
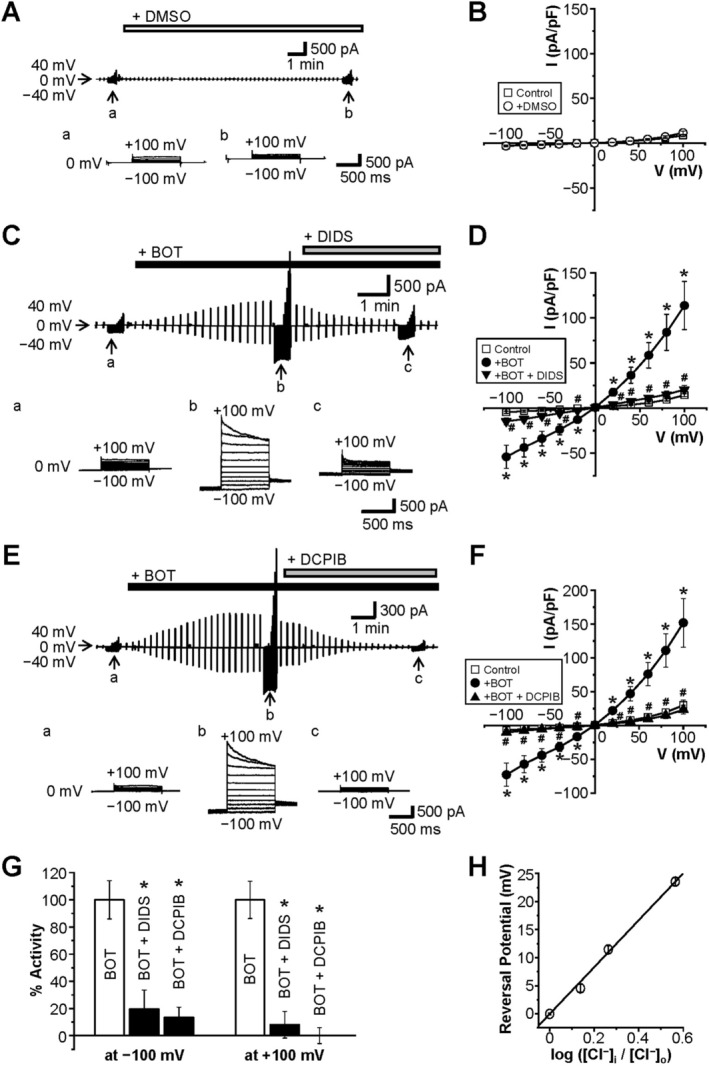
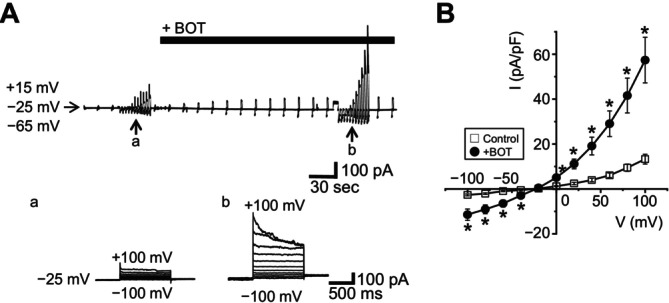
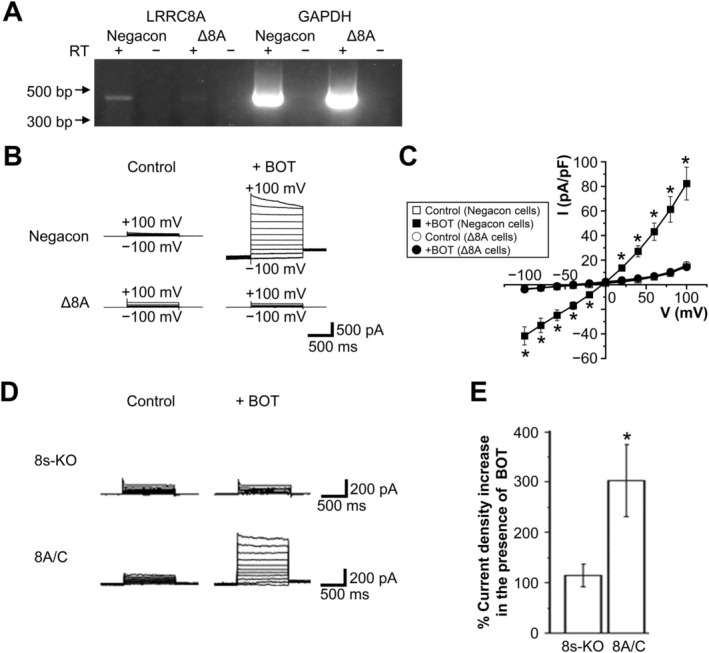
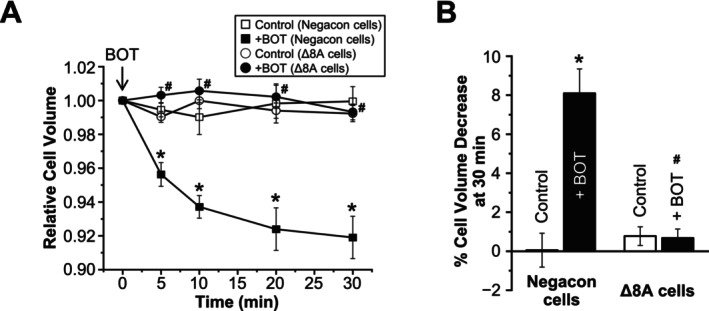
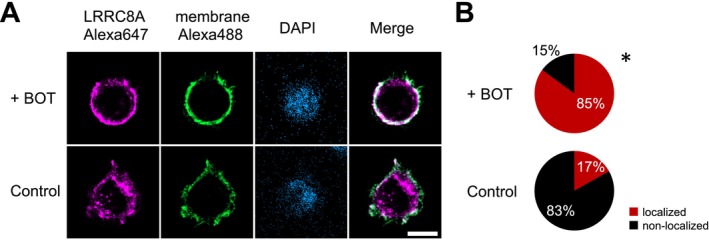
The Japanese Kampo medicine Boi-ogi-to (BOT) is known as an effective therapeutic agent for edema and nephrosis by promoting the excretion of excess body fluids. Despite its empirical effectiveness, scientific evidence supporting its effectiveness remains limited. In this study, we conducted a retrospective study of the effects of BOT administration on the blood test values of patients before and after taking the drug to attempt translational research between basic science and daily clinical practice by focusing on the molecular mechanism of action of BOT in vitro. We found that blood sodium and chloride levels are higher after taking BOT by analyzing the clinical test values before and after taking the drug from 28 patients attending Akita University Hospital. In this light, we measured the cell volume of human embryonic kidney HEK293T cells in vitro in order to investigate the possibility that BOT induces Cl- excretion and cell volume reduction. BOT showed concentration-dependent cell volume reduction with an EC50 of 686 μg/mL. The volume reduction effect was suppressed by the Cl- channel inhibitors DIDS and DCPIB. Furthermore, patch-clamp studies showed that BOT-activated Cl- currents exhibit outward rectification and time-dependent inactivation upon depolarization. These biophysical properties of BOT-induced Cl- currents correspond to those of volume-sensitive outward rectifier (VSOR) anion channels. The Cl- currents activated by the administration of BOT were inhibited by applying DIDS, DCPIB, and siRNA targeting the gene of LRRC8A, a core component of the VSOR channel, as well as in LRRC8-deficient cells. Additionally, BOT-induced Cl- currents were restored by coexpression of LRRC8A/C in LRRC8-deficient cells. Also, BOT was found to translocate LRRC8A proteins to the plasma membrane. These results demonstrated that BOT activates LRRC8-containing VSOR channels by delivering LRRC8A to the plasma membrane and induces Cl- release, thereby promoting water excretion.

Keywords: Boi‐Ogi‐to (BOT); VSOR; cell volume regulation; edema; herbal medicine; translational science.


Conflict of interest statement

Declaration of Transparency and Scientific Rigor: This declaration acknowledges that this paper adheres to the principles for transparent reporting and scientific rigor of preclinical research recommended by funding agencies, publishers, and other organizations engaged with supporting research.

The authors declare no conflicts of interest.

Figures

FIGURE 1
FIGURE 1
Boi‐ogi‐to (BOT) induces cell volume reduction in HEK293T cells. (A) Representative transmission microscopy images of HEK293T cells at 0 and 30 min in the absence (Control) and presence of BOT. Scale bar indicates 50 μm. (B) Time course of mean cell volume changes in HEK293T cells. BOT (800 μg/mL) was applied at 0 min, except in the control condition (n = 7–15). (C) Percentages of cell volume decrease at 30 min in the control and BOT‐treated cells compared to their initial cell volume (n = 7–15). (D) Concentration‐dependent cell volume decreases induced by 30‐min application of BOT with different concentrations. The data were fitted using a Hill curve, with an EC50 of 686.17 ± 121.4 μg/mL and a Hill coefficient of 2.0. (n = 5–15). *p < 0.05 compared to the Control.
FIGURE 2
FIGURE 2
Boi‐ogi‐to (BOT) does not affect cell viability. (A) Representative bright‐field transmission microscopy images of AO‐ and PI‐stained HEK293T cells in the control and BOT‐treated (800 μg/mL) groups at 0 min and 24 h. Scale bar indicates 300 μm. (B) Percentage of PI‐positive (dead) cells relative to AO‐positive (alive) cells in the control and BOT‐treated (800 μg/mL) groups at 0, 4, and 24 h (n = 6–18). (C) Number of AO‐positive cells in the control and BOT‐treated (800 μg/mL) groups at 0 and 24 h (n = 12–19). *p < 0.05 compared to Control; # p < 0.05 compared to 0 h. The data at 0 h were calculated by normalizing individual control values to the average cell count of the control group at the 0‐h time point. Similarly, for the 24‐h data, the percentage of live cells was determined by normalizing each value to the average cell count at 0 h. The same normalization approach was applied to the BOT‐treated group.
FIGURE 3
FIGURE 3
Cl channel inhibitors prevent cell volume reduction induced by Boi‐ogi‐to (BOT). (A) Time course of changes in the mean cell volume of HEK293T cells in the absence (Control) or presence of BOT (800 μg/mL) alone or together with 100 μM DIDS or 5 μM DCPIB. (n = 6–13) (B) Percentage of cell volume decrease measured at 30 min after BOT administration, calculated from the data in A. *p < 0.05 compared to Control; # p < 0.05 compared to BOT alone.
FIGURE 4
FIGURE 4
Boi‐ogi‐to (BOT) induces activation of Cl currents in a manner sensitive to DCPIB and DIDS. Continuous traces of whole‐cell currents in HEK293T cells during the application of alternating pulses from 0 to ±40 mV every 10 s. Traces of current responses to step pulses of 20 mV each from −100 mV to +100 mV at a, b, and c are shown in A, C, and E. (A) Representative recordings in Control cells and those treated with DMSO alone (open bar). (C, E) Representative recordings in the cells treated with BOT (black bars) followed by application of DIDS or DCPIB dissolved in DMSO (gray bars). (B, D, F) Current–voltage (I–V) relationships of mean currents recorded in A, C, and E (n = 6–14). (G) Percent currents activated by BOT at −100 mV and +100mV in the absence or presence of DCPIB or DIDS (n = 6–14). (H) The reversal potential was measured by varying the extracellular chloride ion concentration ([Cl]o) from 110 mM to 80 mM, 60 mM, and 30 mM. The vertical axis represents the reversal potential, while the horizontal axis represents the logarithmic ratio of intracellular to extracellular chloride concentration ([Cl]i/[Cl]o). Linear fitting analysis indicated that a 10‐fold reduction in [Cl]o led to a + 41.8 mV shift in the reversal potential (n = 6–10).
FIGURE 5
FIGURE 5
Boi‐ogi‐to (BOT) induces activation of Cl currents under physiological Cl conditions. Experiments were performed using a Cl gradient representative of epithelial cells, with the extracellular chloride concentration ([Cl]o) set at 120 mM and the intracellular chloride concentration ([Cl]i) at 45 mM. Whole‐cell currents were continuously recorded from HEK293T cells while applying alternating voltage pulses of ±40 mV every 10 s from a holding potential of −25 mV. (A) Representative whole‐cell current traces recorded in cells treated with BOT (black bars). The lower panels (a, b) show current responses to step pulses ranging from −100 mV to +100 mV in 20 mV increments. (B) Current–voltage (I–V) relationships of the averaged currents recorded in (A). The reversal potential was −16.4 ± 0.5 mV (n = 7). Statistically significant differences are indicated by *p < 0.05 compared to BOT alone.
FIGURE 6
FIGURE 6
Effects of LRRC8A knockdown and LRRC8A/C overexpression on Boi‐ogi‐to (BOT)‐induced Cl currents. (A) Representative RT‐PCR results showing expression of LRRC8A mRNA in HEK293T cells transfected with negative‐control siRNA (Negacon) and LRRC8A siRNA (Δ8A). GAPDH is used as a housekeeping gene control. RT(+) and RT(−) represent lanes with and without reverse transcriptase. (B) Representative traces of BOT‐induced whole‐cell currents recorded upon step pulse applications in Negacon and Δ8A cells. (C) Current–voltage relationships for currents recorded in the absence and presence of BOT in Negacon and Δ8A cells (n = 8–14). (D) Representative traces of BOT‐evoked whole‐cell currents recorded during step pulse application in LRRC8‐deficient (8s‐KO) cells and in LRRC8A/C‐coexpressing cells. (E) Bar graphs showing peak current densities at +100 mV for the conditions described in (D) (n = 6–7). *p < 0.05 compared to Control.
FIGURE 7
FIGURE 7
Effects of LRRC8A knockdown on Boi‐ogi‐to‐induced cell volume decrease. (A) Time course of mean cell volume changes in Negacon and Δ8A cells. At time 0 min, BOT (800 μg/mL) was applied except in the control conditions. (B) Percentages of cell volume decrease at 30 min (n = 9–17). *p < 0.05 compared to Control in Negacon cells; # p < 0.05 compared to BOT‐treated Negacon.
FIGURE 8
FIGURE 8
Effects of Boi‐ogi‐to (BOT) on the expression pattern of LRRC8A protein within HEK293T cells. (A) Confocal images of HEK293T cells stained with anti‐mCherry antibody (hLRRC8A‐mCherry: Red) and anti‐GFP antibody (EGFP‐F: Green) in the presence or absence of BOT (800 μg/mL). Nuclei are stained with DAPI (blue). Merge shows the overlay of LRRC8A‐mCherry and EGFP‐F images. Scale bar: 10 μm. (B) BOT treatment increases the localization of LRRC8A to the cell periphery region corresponding to the plasma membrane compared to cells without BOT treatment. Statistical significance was determined by chi‐square test (*p < 0.001). A total of 67–237 cells were observed and analyzed.

Similar articles

References

    1. Besharat S., Grol‐Prokopczyk H., Gao S., Feng C., Akwaa F., and Gewandter J. S., “Peripheral Edema: A Common and Persistent Health Problem for Older Americans,” PLoS One 16 (2021): e0260742. - PMC - PubMed
    1. Wu W. N., Wu P. F., Chen X. L., et al., “Sinomenine Protects Against Ischaemic Brain Injury: Involvement of Co‐Inhibition of Acid‐Sensing Ion Channel 1a and L‐Type Calcium Channels,” British Journal of Pharmacology 164 (2011): 1445–1459. - PMC - PubMed
    1. Lee J.‐Y., Yoon S.‐Y., Won J., Kim H.‐B., Kang Y., and Oh S. B., “Sinomenine Produces Peripheral Analgesic Effects via Inhibition of Voltage‐Gated Sodium Currents,” Neuroscience 358 (2017): 28–36. - PubMed
    1. Díaz L., Bernadez‐Vallejo S. V., Vargas‐Castro R., et al., “The Phytochemical α‐Mangostin Inhibits Cervical Cancer Cell Proliferation and Tumor Growth by Downregulating E6/E7‐HPV Oncogenes and KCNH1 Gene Expression,” International Journal of Molecular Sciences 24 (2023): 3055. - PMC - PubMed
    1. Miyamura Y., Hitomi S., Omiya Y., et al., “Isoliquiritigenin, an Active Ingredient of Glycyrrhiza, Elicits Antinociceptive Effects via Inhibition of nav Channels,” Naunyn‐Schmiedeberg's Archives of Pharmacology 394, no. 5 (2021): 967–980, 10.1007/s00210-020-02030-w. - DOI - PubMed

LinkOut - more resources