

Genetic diversity and population structure of soybean (Glycine max (L.) Merril) germplasm
- PMID: 40341701
- PMCID: PMC12061401
- DOI: 10.1371/journal.pone.0312079
Genetic diversity and population structure of soybean (Glycine max (L.) Merril) germplasm
Abstract
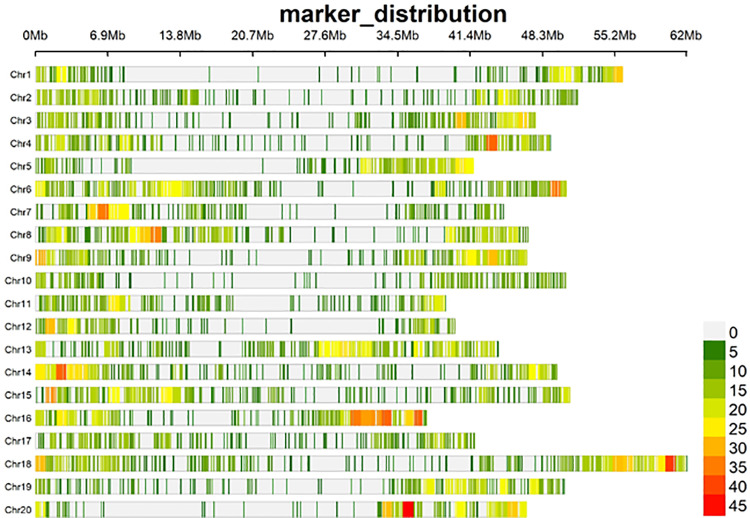
Soybean (Glycine max (L.) Merril) is a significant legume crop for oil and protein. However, its yield in Africa is less than half the global average resulting in low production, which is inadequate for satisfying the continent's needs. To address this disparity in productivity, it is crucial to develop new high-yielding cultivars by utilizing the genetic diversity of existing germplasms. Consequently, the genetic diversity and population structure of various soybean accessions were evaluated in this study. To achieve this objective, a collection of 147 soybean accessions was genotyped using the Diversity Array Technology Sequencing method, enabling high-throughput analysis of 7,083 high-quality single-nucleotide polymorphisms (SNPs) distributed across the soybean genome. The average values observed for polymorphism information content (PIC), minor allele frequency, expected heterozygosity and observed heterozygosity were 0.277, 0.254, 0.344, and 0.110, respectively. The soybean genotypes were categorized into four groups on the basis of model-based population structure, principal component analysis, and discriminant analysis of the principal component. Alternatively, hierarchical clustering was used to organize the accessions into three distinct clusters. Analysis of molecular variance indicated that the genetic variance (77%) within the populations exceeded the variance (23%) among them. The insights gained from this study will assist breeders in selecting parental lines for genetic recombination. The present study demonstrates that soybean improvement is viable within the IITA breeding program, and its outcome will help to optimize the genetic enhancement of soybeans.
Copyright: © 2025 Silue et al. This is an open access article distributed under the terms of the Creative Commons Attribution License, which permits unrestricted use, distribution, and reproduction in any medium, provided the original author and source are credited.
Conflict of interest statement
The authors have declared that no competing interests exist.
Figures


References
-
- Shete R, Borale S, Andhale G, Girase V. Screening of soybean genotypes for pod-shattering tolerance and association of different traits with seed yield. The Pharma Innovation Journal. 2023;12:1548–51.
-
- Abebe AT, Kolawole AO, Unachukwu N, Chigeza G, Tefera H, Gedil M. Assessment of diversity in tropical soybean (Glycine max (L.) Merr.) varieties and elite breeding lines using single nucleotide polymorphism markers. Plant Genet Resour. 2021;19(1):20–8. doi: 10.1017/s1479262121000034 - DOI
-
- Dean F, Science H, Ranga A. Soyabean the miracle golden bean in Indian foods. Acta Scientific Nutritional Health. 2019;3:44–9.
-
- Alfred O, Shaahu A, Ochigbo A, Amon T, Vange T, Msaakpa T. Soybean: A major component of livestock feed (Fish). Journal of Agriculture and Veterinary Science. 2020;13:38–43.
-
- Tolorunse K, Joseph E, Gana A, Azuh V. Molecular characterization of soybean (Glycine max (L.) Merrill) genotypes using SSR markers. Nigeria Journal of Plant Breeding. 2022;1:12–7.
MeSH terms
LinkOut - more resources
Full Text Sources
