. 2025 May 8;20(5):e0320519.
doi: 10.1371/journal.pone.0320519. eCollection 2025.

Anatomically distinct cortical tracking of music and speech by slow (1-8Hz) and fast (70-120Hz) oscillatory activity

Affiliations

Anatomically distinct cortical tracking of music and speech by slow (1-8Hz) and fast (70-120Hz) oscillatory activity

Sergio Osorio et al. PLoS One. .

Abstract

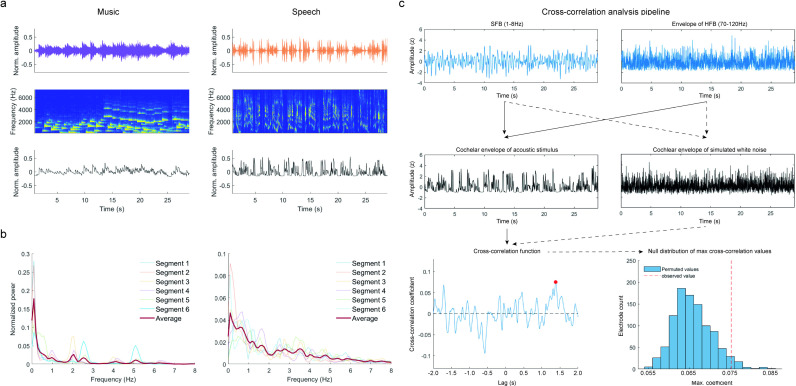
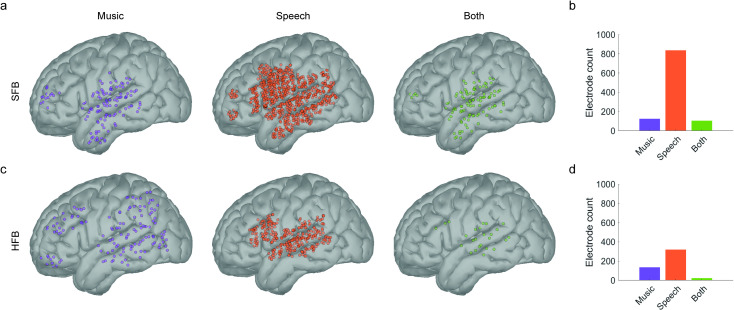
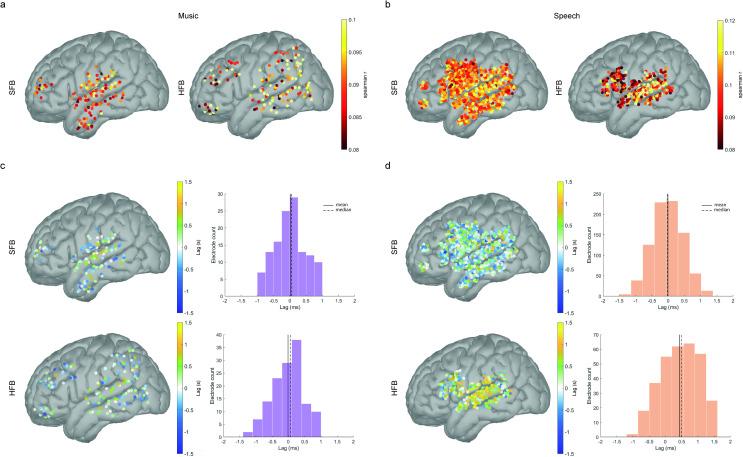
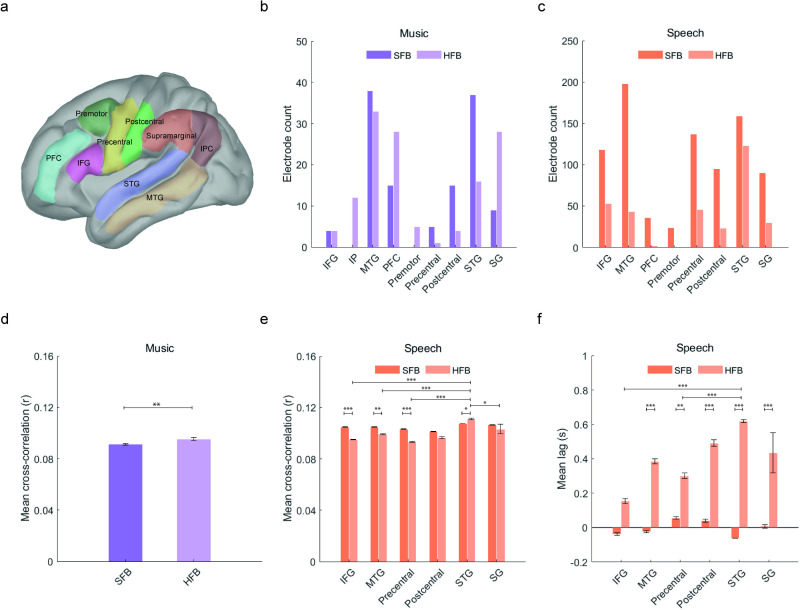
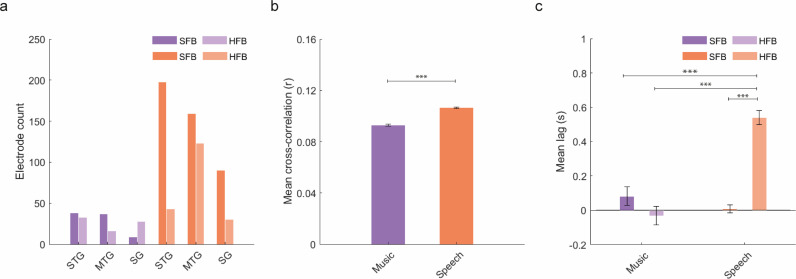
Music and speech encode hierarchically organized structural complexity at the service of human expressiveness and communication. Previous research has shown that populations of neurons in auditory regions track the envelope of acoustic signals within the range of slow and fast oscillatory activity. However, the extent to which cortical tracking is influenced by the interplay between stimulus type, frequency band, and brain anatomy remains an open question. In this study, we reanalyzed intracranial recordings from thirty subjects implanted with electrocorticography (ECoG) grids in the left cerebral hemisphere, drawn from an existing open-access ECoG database. Participants passively watched a movie where visual scenes were accompanied by either music or speech stimuli. Cross-correlation between brain activity and the envelope of music and speech signals, along with density-based clustering analyses and linear mixed-effects modeling, revealed both anatomically overlapping and functionally distinct mapping of the tracking effect as a function of stimulus type and frequency band. We observed widespread left-hemisphere tracking of music and speech signals in the Slow Frequency Band (SFB, band-passed filtered low-frequency signal between 1-8Hz), with near zero temporal lags. In contrast, cortical tracking in the High Frequency Band (HFB, envelope of the 70-120Hz band-passed filtered signal) was higher during speech perception, was more densely concentrated in classical language processing areas, and showed a frontal-to-temporal gradient in lag values that was not observed during perception of musical stimuli. Our results highlight a complex interaction between cortical region and frequency band that shapes temporal dynamics during processing of naturalistic music and speech signals.


Conflict of interest statement

The authors have declared that no competing interests exist.

Figures

Fig 1
Fig 1. Analysis of acoustic signals.
a. Sound waves of representative acoustic segments for music (top-left panel) and speech (top-right panel), their cochlear spectrograms (middle panels) and cochlear envelope (bottom panels). b. PSD for all music (left) and speech (right) segments. For normalization, power at each frequency bin was divided the sum of power values across all frequencies. The red line shows average power across segments. c. Schematic representation of the cross-correlation analysis. For brain signals (SFB, 1-8Hz, top left and envelope of HFB, 70-120Hz, top right), cross-correlation was estimated against the cochlear envelope of stimuli signals (middle left) to obtain the maximum correlation coefficient and its corresponding lag (bottom left). A permutation procedure was conducted by estimating the cross-correlation function between SFB and HFB brain signals and the cochlear envelope of simulated white-noise (middle right), to obtain a null distribution of maximum correlation coefficients which was used to estimate significance thresholds. Solid black arrows represent the pipeline for real data. Dotted black lines represent the permutation procedure.
Fig 2
Fig 2. Statistically significant electrodes and their anatomical localization in the MNI-ICBM152 cortical template.
a. and c. Spatial distribution of significant electrodes in the SFB (a) and HFB (c) after density-based clustering analyses for music (orange) and speech (purple). Electrodes that show mixed-selectivity (i.e., respond to both stimuli) are presented in green. b. and d. Number of electrodes that survive permutation statistics and density-based clustering classification in the SFB (b) and HFB (d).
Fig 3
Fig 3. Cortical tracking of music and speech envelopes in the MNI-ICBM152 cortical template.
a. and b. Spatial distribution of mean correlation values for music (a) and speech (b) in the SFB and HFB. c. and d. Spatial distribution and histograms (left) of temporal lags (right) in the SFB and HFB. Positive lags indicate that the acoustic signal precedes brain signals, whereas negative lags indicate that the brain signals precede the acoustic signal. All electrodes shown are statistically significant (p < 0.001, uncorrected) and survive clustering analyses.
Fig 4
Fig 4. Anatomical regions of interest and significant effects as per mixed-effects modeling analyses.
a. Anatomical location of statistically significant electrodes after density-based clustering analyses. b. and c. Number of electrodes per anatomical parcellation for music (a) and speech (c). d. Main effect of frequency band for mean cross-correlation values during cortical tracking of music. e. Main and interaction effects for cross-correlation values during cortical tracking of speech. f. Main and interaction effects for temporal lags during cortical tracking of speech. Whiskers represent the Standard Error of the Mean (SEM). For all panels, * p < 0.05, ** p < 0.01, *** p < 0.001.
Fig 5
Fig 5. Number of electrodes per anatomical location and statistical effects of joint mixed-effects model.
Purple bars represent an effect for music whereas orange lines represent an effect for speech. a. Number of electrodes in the three anatomical locations where statistically significant electrodes were found for both conditions. b. Main effect of condition for cross-correlation coefficients. c. Main effect and interaction for temporal lags. Whiskers represent the SEM. For all panels, * p < 0.05, ** p < 0.01, *** p < 0.001.

Similar articles

References

    1. Fujita H, Fujita K. Human language evolution: a view from theoretical linguistics on how syntax and the lexicon first came into being. Primates. 2022;63(5):403–15. doi: 10.1007/s10329-021-00891-0 - DOI - PMC - PubMed
    1. Asano R. The evolution of hierarchical structure building capacity for language and music: a bottom-up perspective. Primates [Internet]. 2022;63(5):417–28. doi: 10.1007/s10329-021-00905-x - DOI - PMC - PubMed
    1. Miyagawa S, Berwick RC, Okanoya K. The emergence of hierarchical structure in human language. Front Psychol. 2013;4:1–6. - PMC - PubMed
    1. McFee B, Nieto O, Farbood MM, Bello JP. Evaluating hierarchical structure in music annotations. Front Psychol. 2017;8:1–17. doi: 10.3389/fpsyg.2017.01337 - DOI - PMC - PubMed
    1. Lerdahl F, Jackendoff R. An overview of hierarchical structure in music. Music Percept: An Interdiscip J. 1983;1(2):229–52.

LinkOut - more resources