. 2025 May 8;8(1):715.
doi: 10.1038/s42003-025-08167-9.

TRPV2 mediates stress resilience in mouse cardiomyocytes

Affiliations

TRPV2 mediates stress resilience in mouse cardiomyocytes

Yubing Dong et al. Commun Biol. .

Abstract

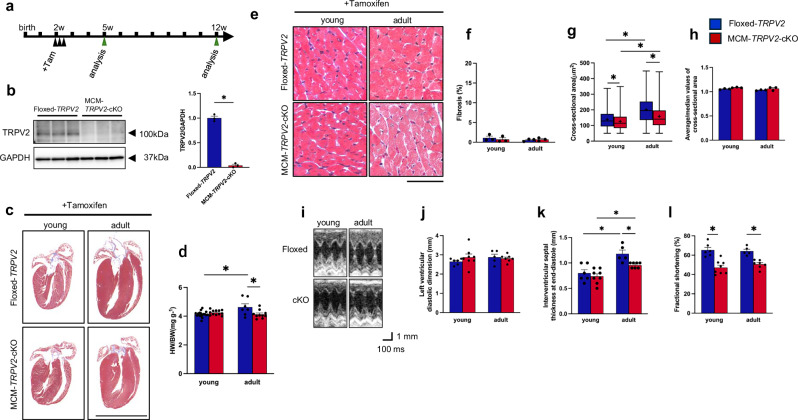
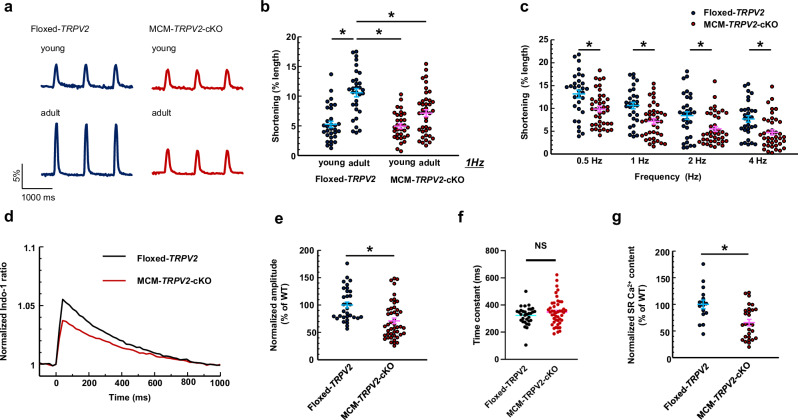
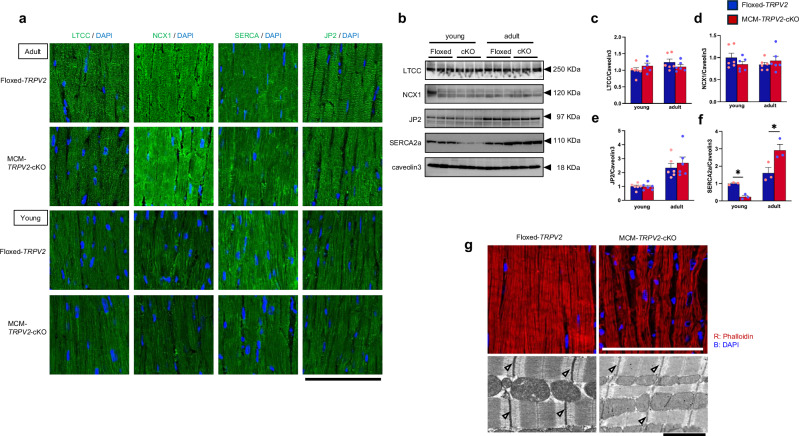
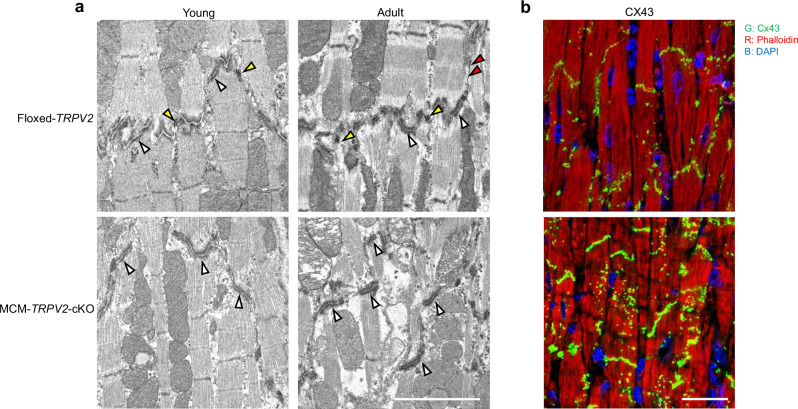
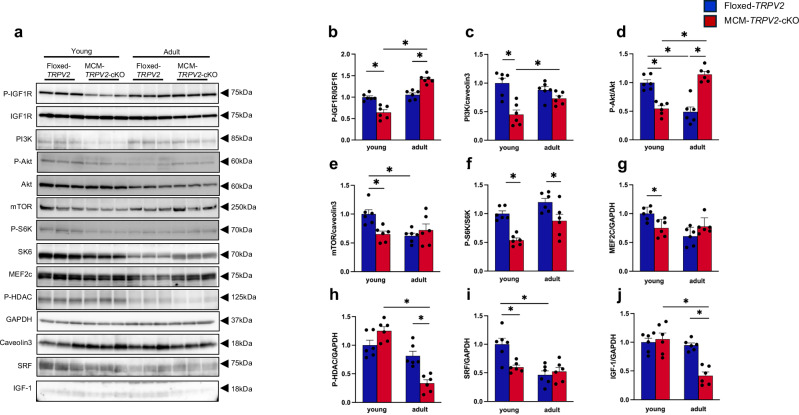
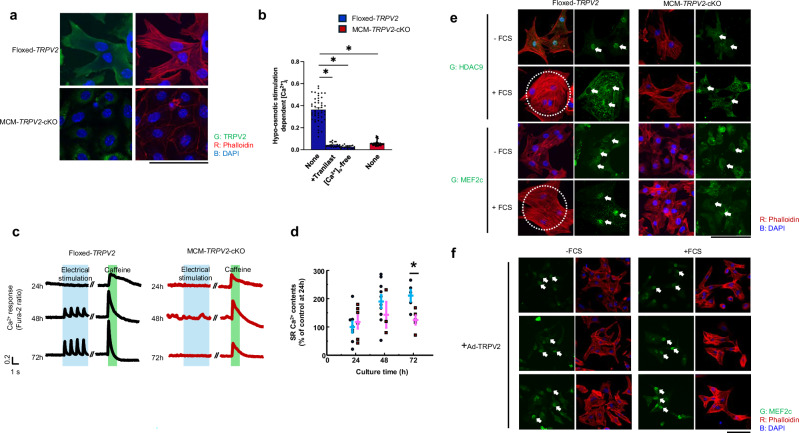
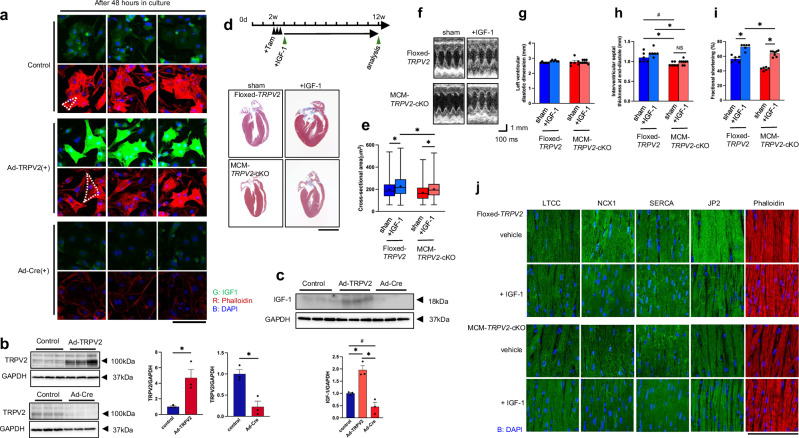
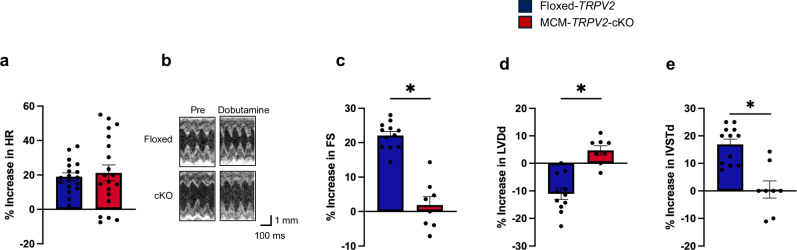
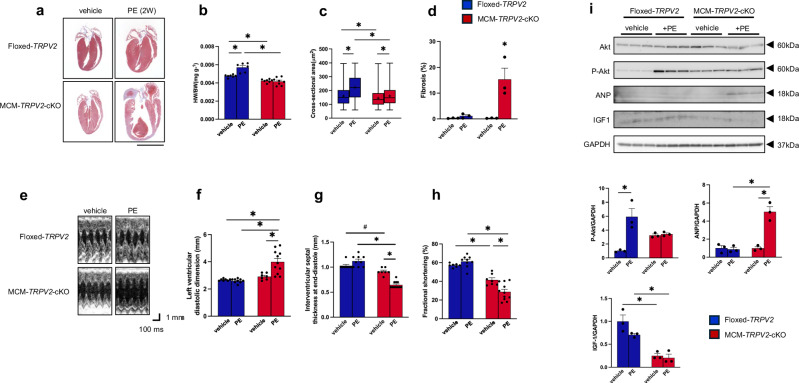
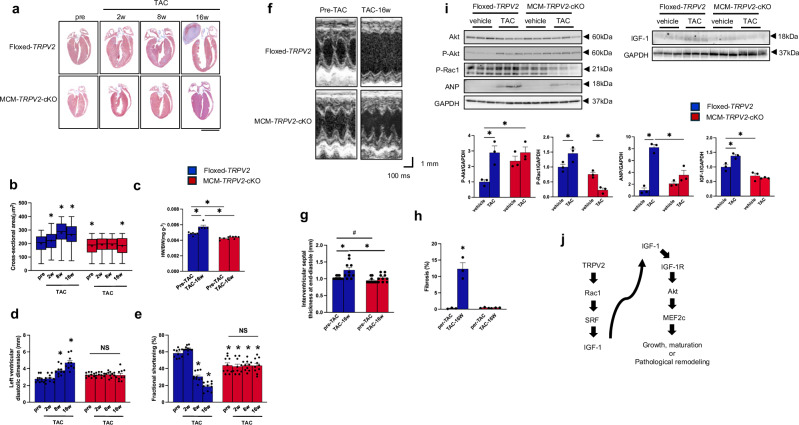
The heart dynamically compensates for haemodynamic stress, but how this resilience forms during cardiac growth is not clear. Using a temporally inducible, cardiac-specific knockout in mice we show that the Transient receptor potential vanilloid family 2 (TRPV2) channel is crucial for the maturation of cardiomyocyte stress resilience. TRPV2 defects in growing hearts lead to small morphology, abnormal intercalated discs, weak contractility, and low expression of serum response factor and Insulin-like growth factor-1 (IGF-1) signalling. Individual cardiomyocytes of TRPV2-deficient hearts show reduced contractility with abnormal Ca2+ handling. In cultured neonatal cardiomyocytes, mechanical Ca2+ response, excitation-contraction coupling, sarcoplasmic reticulum Ca2+ content, actin formation, nuclear localisation of Myocyte enhancer factor 2c, and IGF-1 expression require TRPV2. TRPV2-deficient hearts show a defective response to dobutamine stress and no compensatory hypertrophic response to phenylephrine administration, but no stress response to pressure overload. These data suggest TRPV2 mediates the maturation of cardiomyocyte stress resilience, and will advance therapeutic interventions and drug discovery for heart disease.


Conflict of interest statement

Competing interests: The authors declare no competing interests.

Figures

Fig. 1
Fig. 1. Cardiac changes after removal of TRPV2 from a young age.
a Schedule of tamoxifen administration. b Expression of TRPV2 protein in tamoxifen-treated heart at 5 weeks (N = 3). c Cardiac morphology (scale bar, 5 mm). d Changes in heart-to-body weight (HW/BW) ratio (N = 7–17 mice per group). e Masson’s trichrome staining of the left ventricle. Scale bar, 50 µm. f Fibrosis percentage. g, h Changes in cross-sectional area of cardiomyocytes (n = 723–995 cells from 3 mice per group). i Representative tracing of two-dimensional transthoracic M-mode echocardiography. jl Echocardiographic assessment of left ventricular end dimension at systole, interventricular septal thickness at end-diastole, and fractional shortening (N = 5–8 mice per group). Data are shown as mean ± standard error of the mean (SEM). *P < 0.05 between indicated groups based on Tukey–Kramer test.
Fig. 2
Fig. 2. Changes in contractility and Ca2+ handling of MCM-TRPV2-cKO cardiomyocytes.
a Representative tracing of myocyte shortening. b Change in contractility at 1 Hz in young and adult myocytes (n = 31–40 cells from three hearts per group). *P < 0.05 between indicated groups based on Tukey–Kramer test. c Frequency-dependent shortening of cardiomyocytes (n = 31–40 cells from three hearts per group). *P < 0.05 vs. tamoxifen-treated floxed cells at the same frequency based on Student’s t-test. d Representative trace of Indo-1 fluorescence in single cardiomyocytes stimulated at 1 Hz. e Peak amplitude of Ca2+ transients (n = 32–46 cells from three hearts per group). f Decay time constant (obtained by fitting the decline phase). g Estimation of sarcoplasmic reticulum Ca2+ content (n = 16–28 cells from three hearts per group). *P < 0.05 vs. tamoxifen-treated floxed cells based on Student’s t-test. Data are shown as mean ± standard error of the mean (SEM).
Fig. 3
Fig. 3. Expression of Ca2+ handling proteins in young and adult MCM-TRPV2-cKO hearts.
a Change in localisation of LTCC, NCX1, SERCA, and JP2 in young and adult hearts. Double staining of the antibody of target protein (Green) and DAPI (blue). Scale bar, 100 µm. bf Representative immunoblots (c) and expression level (df) of LTCC, NCX1, SERCA, and JP2 in extracts of young and adult hearts (20 µg per lane), using Caveolin 3 as the internal control on cardiac muscle (N = 3–6 mice per group; see full blots in Supplementary Fig. 4) Data are shown as mean ± standard error of the mean (SEM). *P < 0.05 between indicated groups based on Tukey–Kramer test. g Representative double staining of phalloidin (red) and DAPI (blue). Scale bar, 100 µm (upper panels). Representative electron micrographs of myofilaments in Floxed-TRPV2 and MCM-TRPV2-cKO hearts. Scale bar, 2 µm (lower panels).
Fig. 4
Fig. 4. Abnormality of intercalated discs in MCM-TRPV2-cKO hearts.
a Electron micrograph of intercalated discs in young and adult Floxed-TRPV2 and MCM-TRPV2-cKO mice. Scale bar, 1 µm. White triangles are adherence junctions. Yellow triangles are desmosomes. Red triangles are gap junctions. b Triple staining of anti-Connexin 43 antibody (green), phalloidin (red), and DAPI (blue). Scale bar, 10 µm.
Fig. 5
Fig. 5. Changes in expression of IGF-1, MEF2c, HDAC, and SRF in MCM-TRPV2-cKO hearts.
a Representative immunoblots of young and adult Floxed-TRPV2 and MCM-TRPV2-cKO hearts. (N = 6 mice per group; see full blots in Supplementary Fig. 4) bj Data summarising the expression levels of each molecule. Data are shown as mean ± standard error of the mean (SEM). *P < 0.05 between indicated groups based on Tukey–Kramer test.
Fig. 6
Fig. 6. Impaired actin organisation, Ca2+ handling, and MEF2c/HDAC axis in cultured cardiomyocytes isolated from MCM-TRPV2-cKO hearts.
a Triple staining of anti-TRPV2 (green), phalloidin (red), and DAPI (blue). Scale bar, 50 µm b Hypo-osmotic stimulation-dependent intracellular Ca2+ increase in Floxed-TRPV2 and MCM-TRPV2-cKO cardiomyocytes (n = 19–47 cells from three hearts per group). Data are shown as mean ± standard error of the mean (SEM). *P < 0.05 vs. cells from other groups based on Tukey–Kramer test. c Representative electrical stimulation- and caffeine-induced Ca2+ response in Floxed-TRPV2 and MCM-TRPV2-cKO cardiomyocytes. d Estimation of sarcoplasmic reticulum (SR) Ca2+ content (n = 3–10 cells from three hearts per group). Data are shown as mean ± standard error of the mean (SEM). *P < 0.05 vs. Floxed-TRPV2 mice at the same frequency based on Student’s t-test. e Localisation of HDAC9 and MEF2c (green) in Floxed-TRPV2 and MCM-TRPV2-cKO cardiomyocytes. Red and blue indicate phalloidin and DAPI, respectively. White arrows indicate nuclear location. Actin development is seen within the dotted circles. Scale bar, 50 µm. f Localisation of MEF2c (green) in Floxed-TRPV2 cardiomyocytes infected with Ad-TRPV2. White arrows indicate nuclear location. Scale bar, 50 µm.
Fig. 7
Fig. 7. TRPV2 dependence of IGF-1 expression and partial recovery of cardiac structure and function by IGF-1 administration.
a Changes in IGF-1 expression and actin formation dependent on TRPV2 expression. Representative immunostaining for IGF-1 (green), phalloidin (red), and DAPI (blue). Scale bar, 200 µm. b Expression of TRPV2 protein in Ad-TRPV2–infected myocytes (upper panels) or Ad-Cre–infected myocytes (lower panels). c Expression of IGF-1 protein in Ad-TRPV2– or Ad-Cre–infected myocytes (N = 3 mice per group). *P < 0.05 vs. hearts from other groups based on Tukey–Kramer test. d Schedule of IGF-1 administration (upper panel). Histological analysis after 8 weeks of IGF-1 administration. Scale bar, 5 mm. e Cross-sectional area from paraffin sections of left ventricles (n = 518–2480 cells from 3 mice per group). Centre line = median; + = mean; box limits = upper and lower quartiles, whiskers = minimum and maximum. f Representative tracing of two-dimensional transthoracic M-mode echocardiography. gi Echocardiographic assessment of left ventricular diastolic dimension, interventricular septal thickness at end-diastole, and fractional shortening (N = 6–8 mice per group). *P < 0.05 vs. multiple comparisons based on Tukey–Kramer test. # P < 0.05 vs. sham-operated Floxed-TRPV2 based on Student’s t-test. j Change in localisation of LTCC, NCX1, SERCA, JP2, and myofilament structure in Floxed-TRPV2 and MCM-TRPV2-cKO hearts. Double staining of the antibody of target protein (Green) or phalloidin (red) and DAPI (blue). Scale bar, 100 µm. Data are shown as mean ± standard error of the mean (SEM).
Fig. 8
Fig. 8. Dobutamine stress challenge in Floxed-TRPV2 and MCM-TRPV2-cKO mice.
a Change in heart rate (N = 18–20 mice per group). b Representative tracing of two-dimensional transthoracic M-mode echocardiography. ce Echocardiographic assessment of fractional shortening, left ventricular diastolic dimension, and interventricular septal thickness at end-diastole (N = 8–12 mice per group). Data are shown as mean ± standard error of the mean (SEM). *P < 0.05 vs. Floxed-TRPV2 mice based on Student’s t-test.
Fig. 9
Fig. 9. Changes induced by PE administration in MCM-TRPV2-cKO mice.
a Histological analysis after 2 weeks of PE administration. Scale bar, 5 mm. b Changes in heart-to-body weight (HW/BW) ratio (N = 6–8 mice per group). c Changes in cross-sectional area of cardiomyocytes (n = 1110–2060 cells from 3 mice per group). Centre line = median; + = mean; box limits = upper and lower quartiles, whiskers = minimum and maximum. d Fibrosis percentage (N = 3 hearts per group). e Representative tracing of two-dimensional transthoracic M-mode echocardiography. fh Echocardiographic assessment of left ventricular diastolic dimension, interventricular septal thickness at end-diastole, and fractional shortening (N = 7–11 mice per group). *P < 0.05 vs. multiple comparisons based on Tukey–Kramer test. # P < 0.05 vs. vehicle-treated Floxed-TRPV2 based on Student’s t-test. i Representative immunoblots. (N = 3 mice) *P < 0.05 vs. multiple comparisons based on Tukey–Kramer test. Data are shown as mean ± standard error of the mean (SEM).
Fig. 10
Fig. 10. Changes induced by pressure overload in MCM-TRPV2-cKO mice.
a Histological analysis 2, 8, and 16 weeks after pressure overload induction. Scale bar, 5 mm. b Changes in cross-sectional area of cardiomyocytes (n = 144–504 cells from 3 mice per group). Centre line = median; + = mean; box limits = upper and lower quartiles, whiskers = minimum and maximum. c Changes in heart-to-body weight (HW/BW) ratio (N = 5–6 mice per group). d, e Echocardiographic assessment of left ventricular end dimension at systole and fractional shortening (N = 10 mice per group). *P < 0.05 in multiple comparisons based on Tukey–Kramer test. f Representative tracing of two-dimensional transthoracic M-mode echocardiography. g Echocardiographic assessment of interventricular septal thickness at end-diastole. *P < 0.05 in multiple comparisons based on Tukey–Kramer test. # P < 0.05 vs. pre-TAC Floxed-TRPV2 based on Student’s t-test. h Fibrosis percentage (N = 3 hearts per group). i Representative immunoblots of hearts treated with vehicle or TAC after 16 weeks. (N = 3 mice) *P < 0.05 vs. multiple comparisons based on Tukey–Kramer test. j Estimated TRPV2 signal pathway affecting maturation and pathological remodelling. Data are shown as mean ± standard error of the mean (SEM).

References

    1. Guo, Y. & Pu, W. T. Cardiomyocyte maturation. Circ. Res.126, 1086–1106 (2020). - PMC - PubMed
    1. Ellingsen, O. et al. Molecular regulation of cardiomyocyte maturation. Curr. Cardiol. Rep.27, 32 (2025). - PubMed
    1. Cho, G. S. et al. Neonatal transplantation confers maturation of PSC-derived cardiomyocytes conductive to modelling cardiomyopathy. Cell Rep.18, 571–582 (2017). - PMC - PubMed
    1. Hill, J. A. & Olson, E. N. Cardiac plasticity. N. Engl. J. Med.358, 1370–1380 (2008). - PubMed
    1. Coste, B. et al. PIEZO1 and PIEZO2 are essential components of distinct mechanically activated cation channels. Science330, 55–60 (2010). - PMC - PubMed

LinkOut - more resources