. 2025 May 8;21(5):e1013044.
doi: 10.1371/journal.pcbi.1013044. eCollection 2025 May.

Macroecological patterns in experimental microbial communities

Affiliations

Macroecological patterns in experimental microbial communities

William R Shoemaker et al. PLoS Comput Biol. .

Abstract

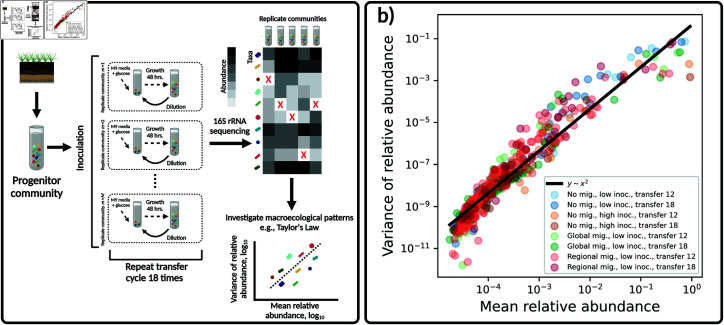
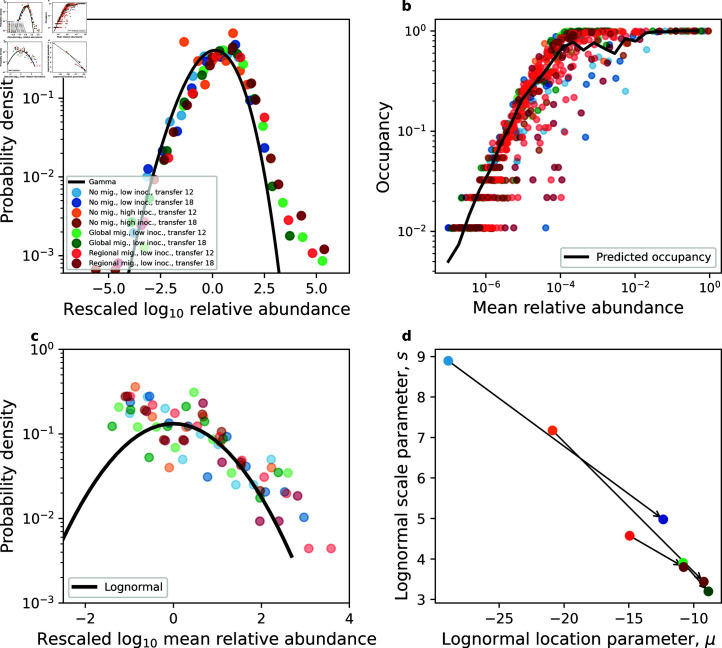
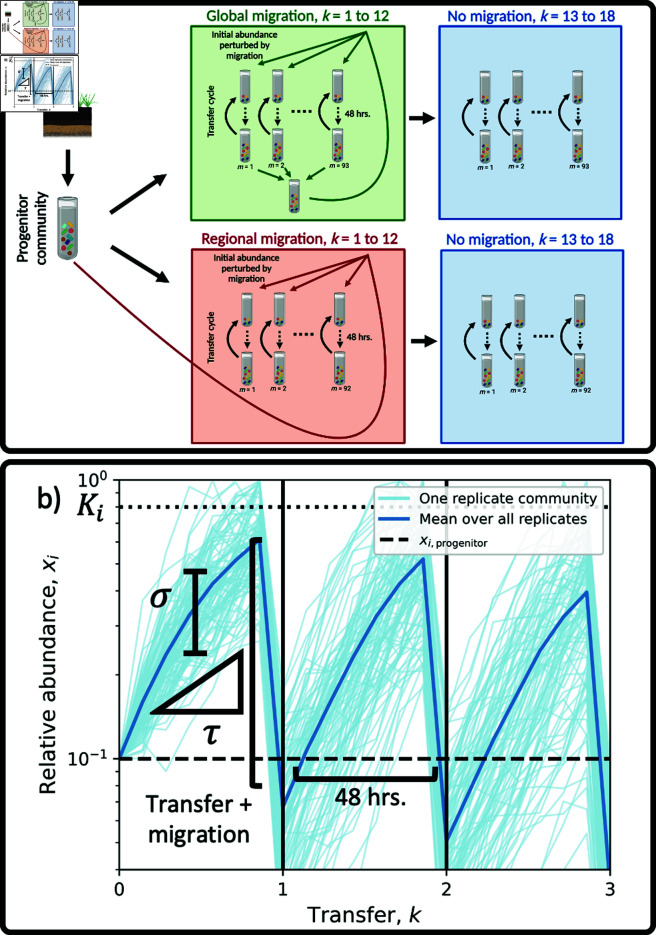
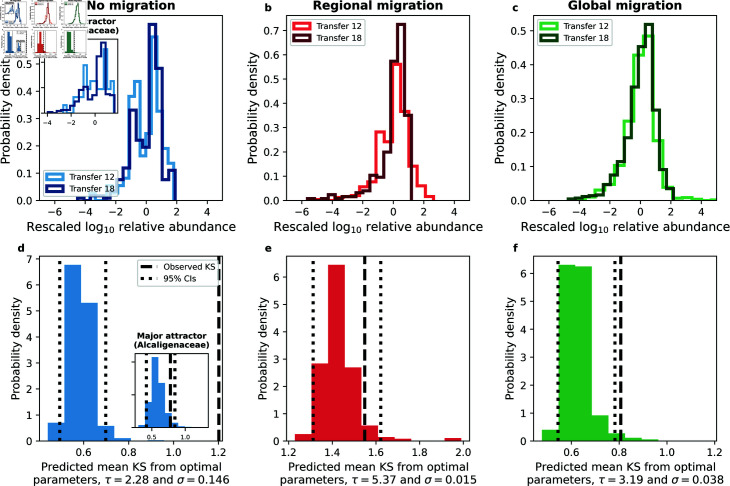
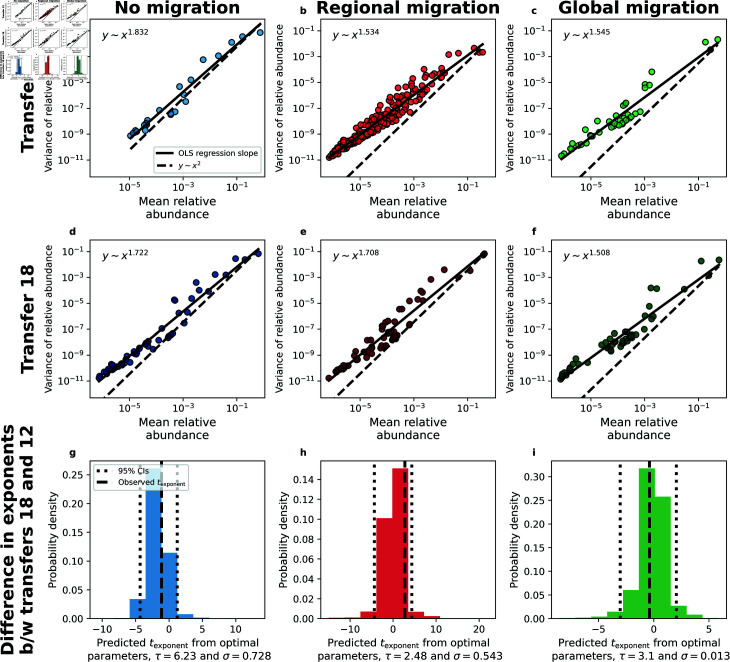
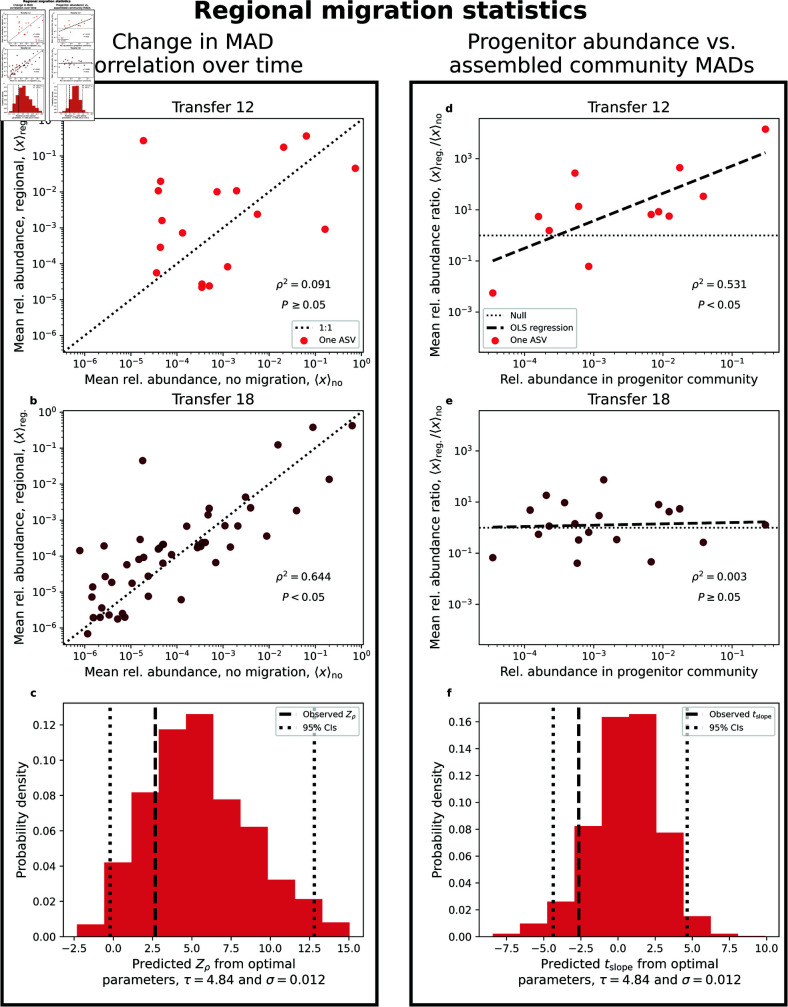
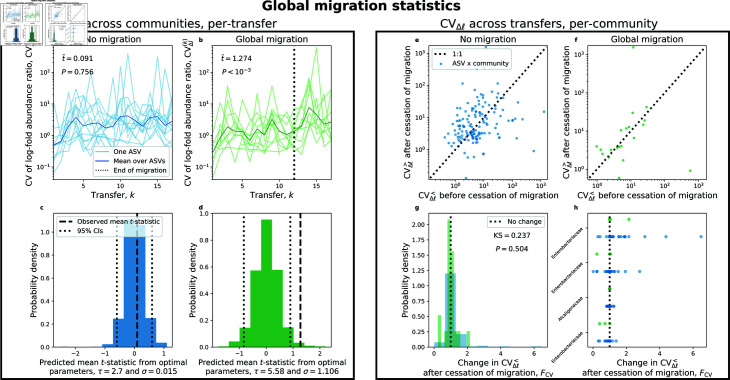
Ecology has historically benefited from the characterization of statistical patterns of biodiversity within and across communities, an approach known as macroecology. Within microbial ecology, macroecological approaches have identified universal patterns of diversity and abundance that can be captured by effective models. Experimentation has simultaneously played a crucial role, as the advent of high-replication community time-series has allowed researchers to investigate underlying ecological forces. However, there remains a gap between experiments performed in the laboratory and macroecological patterns documented in natural systems, as we do not know whether these patterns can be recapitulated in the lab and whether experimental manipulations produce macroecological effects. This work aims at bridging the gap between experimental ecology and macroecology. Using high-replication time-series, we demonstrate that microbial macroecological patterns observed in nature exist in a laboratory setting, despite controlled conditions, and can be unified under the Stochastic Logistic Model of growth (SLM). We found that demographic manipulations (e.g., migration) impact observed macroecological patterns. By modifying the SLM to incorporate said manipulations alongside experimental details (e.g., sampling), we obtain predictions that are consistent with macroecological outcomes. By combining high-replication experiments with ecological models, microbial macroecology can be viewed as a predictive discipline.


Conflict of interest statement

The authors have declared that no competing interests exist.

Figures

Fig 1
Fig 1. Emergent variation in experimental communities.
a) Microbial community assembly experiments provide a means to maintain diversity in a laboratory setting. These experiments are commonly performed by growing a community sampled from a given environment (e.g., soil) and using it to inoculate a large number of replicate microcosms containing the same resource (e.g., M9 minimal media with glucose as the sole carbon source). These replicate communities are allowed to grow for a period of time (e.g., 48 h.) before aliquots are taken and diluted into microcosms containing replenished resource. This process known as a “transfer cycle" is repeated a given number of times (e.g., 18) and the resulting communities are sequenced via 16S rRNA sequencing. The abundances of community members have the potential to provide the variation necessary to investigate the existence of macroecological patterns in an experimental setting (e.g., Taylor’s Law), a goal of this study. Red “X" symbols represent the absence of a community member in a sample. b) Variation in abundance consistently arose across treatments and timescales in experimental communities. This variation could be captured by the relationship between the mean and variance of relative abundance, a pattern known as Taylor’s Law. Each data point represents statistical moments calculated across replicate communities for a single ASV from a single experimental treatment. Fig 1a created with Biorender (ID a78p433).
Fig 2
Fig 2. Macroecological patterns hold in experimental communities.
Empirical macroecological patterns that were previously identified in natural microbial systems consistently arise in experimental communities [32]. a) The Abundance Fluctuation Distribution (AFD) tended to follow a gamma distribution across treatments. b) A gamma distribution that explicitly considers sampling successfully predicted the fraction of communities where an ASV is present (i.e., its occupancy). The prediction of the gamma (black line) was obtained by averaging over ASVs within a given mean relative abundance bin. c) The Mean Abundance Distribution (MAD) was similar across treatments and largely follow a lognormal distribution. The left side of the distribution represents community members with mean abundances below the detection limit set by finite sampling (Materials and Methods; [32]) d). By examining the location parameter (μ) and the scale parameter (s) of the lognormal distribution for each treatment, we found that these independently inferred parameters converged towards the same value as the experiment progressed from transfer 12 (light shade) to transfer 18 (dark shade). These two parameters control the shape of the MAD, meaning that different treatments are converging to similar distributions of mean abundance.
Fig 3
Fig 3. Incorporating experimental details into the Stochastic Logistic Model.
a) Replicate communities were initiated from a single progenitor community that was isolated from soil. Communities were grown in microcosms containing a single carbon source for 48 hours, where they were then transferred to a microcosm with replenished resourced. This process constitutes a single transfer cycle. Migration was manipulated by altering the abundances of ASVs at the start of a transfer cycle. Two forms of migration were performed: regional and global. Regional migration represents a form of island-mainland migration, where aliquots of the progenitor community were added at the start of a transfer cycle. Global migration was manipulated by mixing aliquots of each replicate community at the end of a transfer cycle, which was then redistributed at the start of the subsequent transfer cycle. In both cases migration manipulations were performed for the first 12 transfers (1 to 12) and ceased for the remaining six transfers (13 to 18). Community assembly experiments were also performed with no migration manipulations for the entirety of the 18 transfers (not pictured). b) We modeled the ecological dynamics of each ASV within a given transfer cycle by incorporating the forms of migration performed in the experiment into the Stochastic Logistic Model of growth (S6 Text). For a given migration treatment we inferred two parameters of the SLM: the strength of environmental noise (σ; represented as variation in abundance trajectories within a transfer cycle) and the timescale of growth (τ; inverse of the maximum rate of growth). The parameter τ is particularly relevant for serial-dilution community assembly experiments, as it determines whether the community member reached its carrying capacity before the start of the subsequent transfer cycle. Migration altered the relative abundance of an ASV at the start of a transfer cycle as a perturbation of initial conditions (Eq 11). This experimental detail reduces the relative abundance of a given ASV if the relative abundance in a migration inoculum was lower than the carrying capacity (Ki), where the ASV then proceeds to increase in abundance at a rate set by the timescale of growth τ. Conceptual diagram a was modified from Estrela et al. [53]. Fig 3a created with Biorender (ID j67r579)
Fig 4
Fig 4. Migration impacts the shape of AFDs.
a-c) By rescaling log10 transformed AFDs for each ASV, we examined how the shape of the AFD changed before and after the cessation of migration. We quantified this shift by estimating the KS distance between ASVs before (transfer 12) and after (transfer 18) the cessation of the migration treatment for each ASV, then calculated the mean over ASVs. d-f) Using the selected parameter combinations of the strength of environmental noise (σ) and the typical timescale of growth (τ) identified by ABC, we found that the SLM predicted reasonable KS statistics for regional migration as well as within the major attractor of the no migration treatment (inset of sub-plots a,d), with borderline successful predictions for the global migration treatment. The solid vertical line represents the mean KS statistic from empirical data while the dashed vertical lines represent the 95% confidence intervals of the distribution of mean KS statistics calculated from our simulated data.
Fig 5
Fig 5. Regional migration impacts the exponent of Taylor’s Law.
a-f) By examining the exponent of Taylor’s Law for each treatment we found that the exponent only considerably changed after the cessation of migration for the regional migration treatment. Each data point represents statistical moments calculated across replicate communities for a single ASV from a single experimental treatment. g-i) Using ABC-selected parameters (strength of environmental noise (σ) and the typical timescale of growth (τ)) we found that the SLM succeeded in predicting the change in the exponent for regional migration.
Fig 6
Fig 6. Regional migration alters typical abundance in a manner consistent with SLM simulations.
The properties of the MAD were examined to evaluate the impact of migration over time. a) At transfer 12, the last transfer with migration, we found no apparent correlation between the MADs of the regional and no migration treatments. b) Contrastingly, the strength of the correlation rapidly increased by transfer 18. The significance of this difference can be evaluated by calculating Fisher’s Z-statistic, a statistic that can be applied to correlations calculated from simulated data. c) By performing simulations over a range of environmental noise strengths (σ) and timescales of growth (τ), we visualized how the observed value of Zρ compared to simulated distributions and identified reasonable parameter regimes as well as the relative error of our predictions. d, e) The ratio of the MAD between regional and no migration provided a single variable that can be compared to the abundance of an ASV in the progenitor community. There was a positive significant slope at transfer 12 that dissipated by transfer 18, reflecting the cessation of migration. Only sub-plots c and f contain simulated data.
Fig 7
Fig 7. SLM simulations are unable to reproduce log-fold fluctuations across communities under global migration.
By leveraging the entire timeseries we can examine how the coefficient of variation of Δ was altered by migration for two scenarios: 1) fluctuations across replicate communities at a given transfer (CVΔ(k)) and 2) fluctuations before (CVΔ<) and after (CVΔ>) the cessation of migration within a given community. a) As expected, there was no change in CVΔ(k) for the no migration treatment. b) However, CVΔ(k) tended to slightly increase after transfer 12 for global migration, a shift that was found to be significant using a t-test where transfer labels were permuted for each ASV. c, d) Our SLM predictions using the ABC-selected strength of environmental noise (σ) and typical timescale of growth (τ) succeeded for the no migration treatment, but was unable to capture observed values of t¯ under global migration. These results pertaining to the fluctuations across communities can be contrasted with fluctuations within a community. e, f) We did not observe a systematic shift in the CV before vs. after the cessation of migration for either treatment. g) By calculating the difference between two CVs (FCV) for each ASV in each replicate community, we did not observe a significant difference between migration treatments using a KS test constrained on ASV identity. h) This conclusion is confirmed by investigating the change in the CV for high occupancy ASVs, as there was no systematic difference between migration treatments.

Similar articles

References

    1. Schluter J, Foster KR. The evolution of mutualism in gut microbiota via host epithelial selection. PLoS Biol. 2012;10(11):e1001424. doi: 10.1371/journal.pbio.1001424 - DOI - PMC - PubMed
    1. Eloe-Fadrosh EA, Rasko DA. The human microbiome: from symbiosis to pathogenesis. Annu Rev Med. 2013;64:145–63. doi: 10.1146/annurev-med-010312-133513 - DOI - PMC - PubMed
    1. Brown JH, Maurer BA. Macroecology: the division of food and space among species on continents. Science. 1989;243(4895):1145–50. doi: 10.1126/science.243.4895.1145 - DOI - PubMed
    1. Brown J. Macroecology. University of Chicago Press. 1995.
    1. Azaele S, Suweis S, Grilli J, Volkov I, Banavar JR, Maritan A. Statistical mechanics of ecological systems: Neutral theory and beyond. Rev Mod Phys. 2016;88(3). doi: 10.1103/revmodphys.88.035003 - DOI

LinkOut - more resources