. 2025 Apr 30;42(5):msaf094.
doi: 10.1093/molbev/msaf094.

Efficient Detection and Characterization of Targets of Natural Selection Using Transfer Learning

Affiliations

Efficient Detection and Characterization of Targets of Natural Selection Using Transfer Learning

Sandipan Paul Arnab et al. Mol Biol Evol. .

Abstract

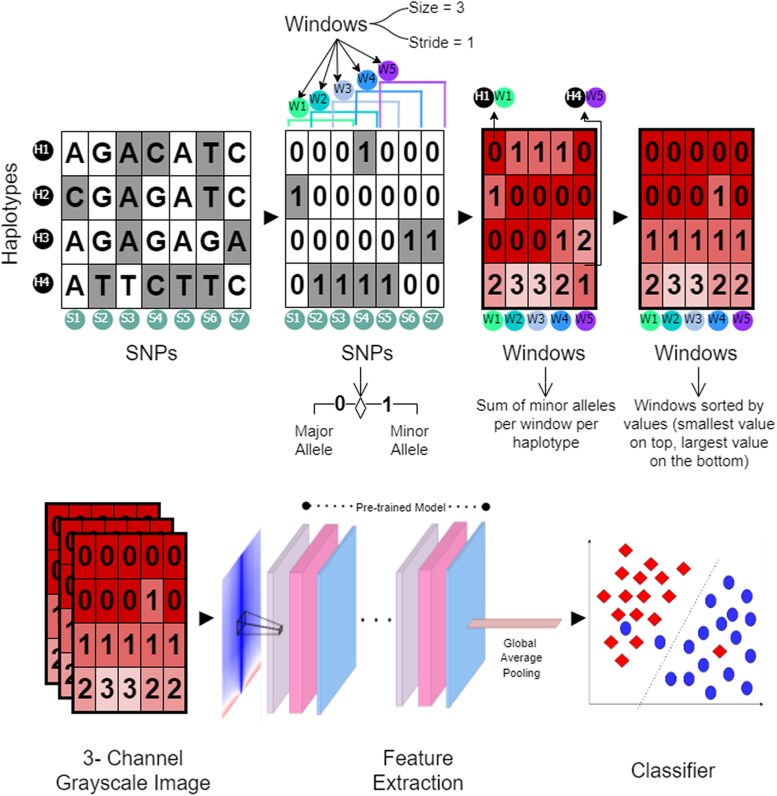
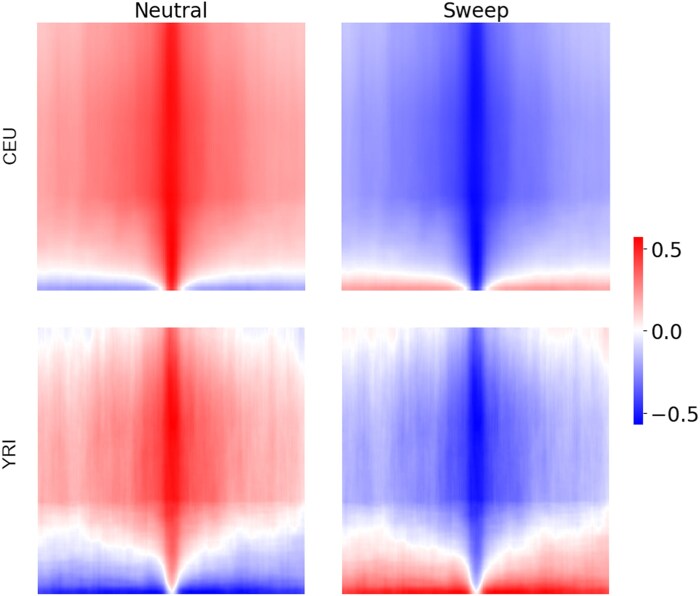
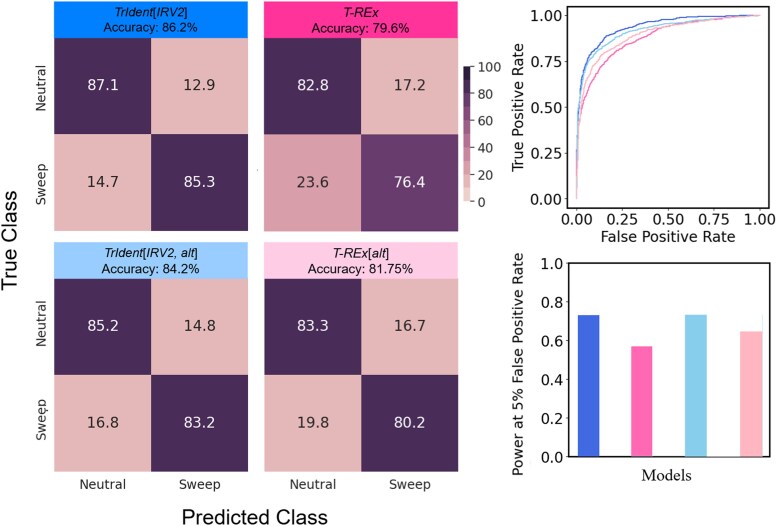
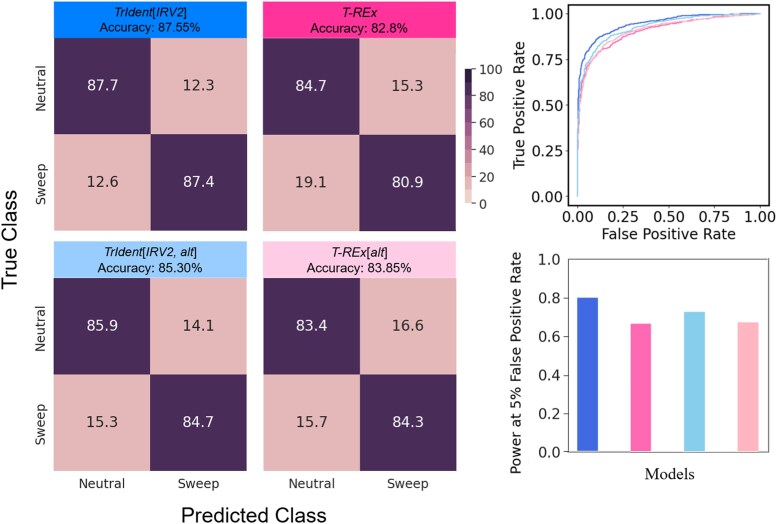
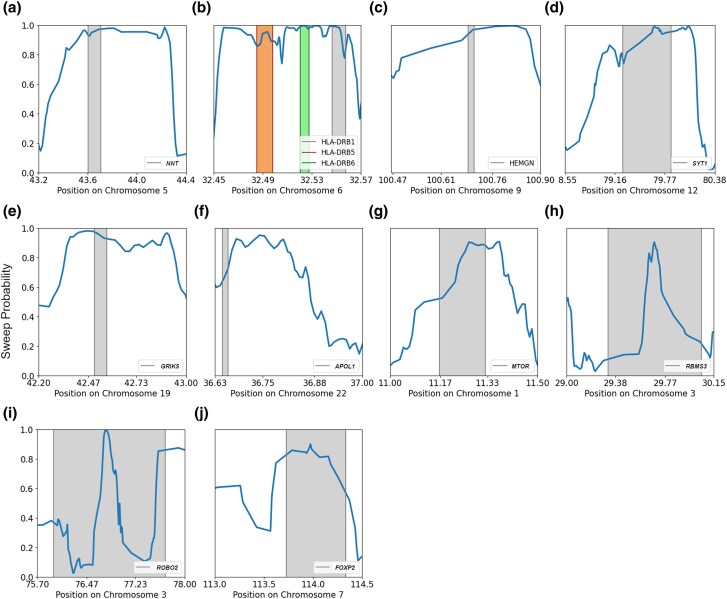
Natural selection leaves detectable patterns of altered spatial diversity within genomes, and identifying affected regions is crucial for understanding species evolution. Recently, machine learning approaches applied to raw population genomic data have been developed to uncover these adaptive signatures. Convolutional neural networks (CNNs) are particularly effective for this task, as they handle large data arrays while maintaining element correlations. However, shallow CNNs may miss complex patterns due to their limited capacity, while deep CNNs can capture these patterns but require extensive data and computational power. Transfer learning addresses these challenges by utilizing a deep CNN pretrained on a large dataset as a feature extraction tool for downstream classification and evolutionary parameter prediction. This approach reduces extensive training data generation requirements and computational needs while maintaining high performance. In this study, we developed TrIdent, a tool that uses transfer learning to enhance detection of adaptive genomic regions from image representations of multilocus variation. We evaluated TrIdent across various genetic, demographic, and adaptive settings, in addition to unphased data and other confounding factors. TrIdent demonstrated improved detection of adaptive regions compared to recent methods using similar data representations. We further explored model interpretability through class activation maps and adapted TrIdent to infer selection parameters for identified adaptive candidates. Using whole-genome haplotype data from European and African populations, TrIdent effectively recapitulated known sweep candidates and identified novel cancer, and other disease-associated genes as potential sweeps.

Keywords: convolutional neural networks; logistic regression; natural selection; population genomics; transfer learning.


Figures

Fig. 1.
Fig. 1.
Depiction of the TrIdent[IRV2] model (bottom panel), including the native TrIdent image generation method (top panel). As described in Image generation subsection of the Methods, for a haplotype alignment with haplotypes on rows and SNPs on columns, the major allele is represented by zero and the minor allele by one at each SNP. From this processed alignment, the number of minor alleles for each haplotype is counted in a window and window locations are shifted by a specific stride, which is chosen as window size of three SNPs and a stride of one SNP in this schematic. The minor allele counts for each window are then sorted, such that the top row with have smallest value and the bottom row the largest value for a given window. A matrix based on a certain number of consecutive windows (here five windows) is created, this matrix is copied over two more channels to create a tensor, resulting in a three-channel grayscale image. This image is fed as input to the “Feature Extraction” block consisting of a pretrained deep CNN model that may incorporate various combinations (indicated by blocks of different colors) of a subset of the following layers: convolutional, maxpooling, dense, dropout, squeeze-and-excitation, depth-wise separable convolutional, and residual connections. A GAP layer is attached to the pretrained model to generate a feature vector, which is then used to train a classifier. The TrIdent[IRV2] model, which is focused on this article, combines the use of InceptionResNetV2 as the pretrained model and penalized logistic regression as the binary classifier.
Fig. 2.
Fig. 2.
Heatmaps depicting standardized input images of size 224×224, averaged across the 1,000 training replicates for either the neutral or sweep class simulated under either the European (CEU) or Sub-Saharan African (YRI) human demographic history (Tennessen et al. 2012). Standardized input images are processed as in the Image generation subsection of the Materials and Methods, with standardization occurring across the 2,000 neutral and sweep training replicates for each pixel. Rows of the images represent haplotypes, whereas columns represent genomic window of 25 contiguous SNPs within a haplotype, with an equal number of windows flanking the center of a simulated genomic region. The colorbar indicates a measure proportional to the number of minor alleles within the haplotype window relative to the mean number (scaled by the standard deviation of minor allele counts) for that window across the neutral and sweep training observations. Darker blue shading represents a higher number of major alleles than average and darker red shading represents a higher number of minor alleles than average.
Fig. 3.
Fig. 3.
Classification rates and accuracies as depicted by confusion matrices, powers (true positive rates) to detect sweeps as depicted by ROC curves to differentiate sweeps from neutrality, and powers at a 5% FPR to detect sweeps on the CEU dataset for the best performing TrIdent model (TrIdent[IRV2]) compared to T-REx. The comparison also includes TrIdent[IRV2, alt] and T-REx[alt], which are trained and tested using their alternate image generation styles (see Viability of alternate architectures and methods subsection of the Results for details).
Fig. 4.
Fig. 4.
Classification rates and accuracies as depicted by confusion matrices, powers (true positive rates) to detect sweeps as depicted by ROC curves to differentiate sweeps from neutrality, and powers at a 5% FPR to detect sweeps on the YRI dataset for the best performing TrIdent model (TrIdent[IRV2]) compared to T-REx. The comparison also includes TrIdent[IRV2, alt] and T-REx[alt], which are trained and tested using their alternate image generation styles (see Viability of alternate architectures and methods subsection of the Results for details).
Fig. 5.
Fig. 5.
Classification rates and accuracies as depicted by confusion matrices, powers (true positive rates) to detect sweeps as depicted by ROC curves to differentiate sweeps from neutrality, and powers at a 5% FPR to detect sweeps on the CEU dataset for the best performing TrIdent model (TrIdent[IRV2]) compared to diploS/HIC and smbCNN. The smbCNN model represents a custom-built shallow CNN trained using TrIdent’s native images, and TrIdent[IRV2, SS] represents an alternate TrIdent[IRV2] architecture trained using summary statistics based images (see Viability of alternate architectures and methods for details).
Fig. 6.
Fig. 6.
Classification rates and accuracies as depicted by confusion matrices, powers (true positive rates) to detect sweeps as depicted by ROC curves to differentiate sweeps from neutrality, and powers at a 5% FPR to detect sweeps on the YRI dataset for the best performing TrIdent model (TrIdent[IRV2]) compared to diploS/HIC and smbCNN. The smbCNN model represents a custom-built shallow CNN trained using TrIdent’s native images, and TrIdent[IRV2, SS] represents an alternate TrIdent[IRV2] architecture trained using summary statistics based images (see Viability of alternate architectures and methods for details).
Fig. 7.
Fig. 7.
Heatmaps of mean GradCAM from InceptionResNetV2 applied to CEU (left panel) and YRI (right panel) training data, with the mean taken across 2,000 training observations with 1,000 observations from each of the neutral and sweep classes.
Fig. 8.
Fig. 8.
Summaries of distributions for true and predicted values of selection parameters (f, s, and τ) using the nonlinear TrIdent[IRV2, ANN] regression model. Distributions are summarized using violin plots with embedded box plots for the CEU (top) and YRI (bottom) datasets.
Fig. 9.
Fig. 9.
Identified candidate sweep regions from the genome-wide scan produced using the trained TrIdent[IRV2] model on the central European humans (CEU) population in the 1000 Genomes Project dataset. Regions were classified as being under positive selection if they had 10 consecutive windows with a sweep probability higher than 0.9. A total of 575 genes across 22 autosomes exhibit qualifying signs of selective sweeps, of which a few of the most interesting candidates are reported here (a–k). supplementary Figure S21, Supplementary Material online provides a visual representation of the haplotype diversity surrounding the candidate genes in the plotted panels.
Fig. 10.
Fig. 10.
Identified candidate sweep regions from the genome-wide produced using the trained TrIdent[IRV2] model on the sub-Saharan African (YRI) population in the 1000 Genomes Project dataset. Regions were classified as being under positive selection if they had ten consecutive windows with a sweep probability higher than 0.9. A total of 666 genes across 22 autosomes exhibit qualifying signs of selective sweeps, of which a few of the most interesting candidates are reported here (a–j). supplementary fig. S22, Supplementary Material online provides a visual representation of the haplotype diversity surrounding the candidate genes in the plotted panels.

Update of

Similar articles

Cited by

References

    1. 1000 Genomes Project Consortium . A global reference for human genetic variation. Nature. 2015:526(7571):68. 10.1038/nature15393. - DOI - PMC - PubMed
    1. Abadi M, Agarwal A, Barham P, Brevdo E, Chen Z, Citro C, Corrado G, Davis A, Dean J, Devin M, et al. 2015. TensorFlow: large-scale machine learning on heterogeneous systems. Software available from tensorflow.org. https://www.tensorflow.org/.
    1. Adrion J, Cole C, Dukler N, Galloway J, Gladstein A, Gower G, Kyriazis C, Ragsdale A, Tsambos G, Baumdicker G, et al. A community-maintained standard library of population genetic models. eLife. 2020:9:e54967. 10.7554/eLife.54967. - DOI - PMC - PubMed
    1. Alberts B, Johnson A, Lewis J, Raff M, Roberts K, Walter P. The cytoskeleton and cell behavior. In: Molecular biology of the cell. 4th ed. New York (NY): Garland Science; 2002.
    1. Albrechtsen A, Moltke I, Nielsen R. Natural selection and the distribution of identity-by-descent in the human genome. Genetics. 2010:186(1):295–308. 10.1534/genetics.110.113977. - DOI - PMC - PubMed

LinkOut - more resources